Cook County Investment Properties for Sale
Browse homes for sale and investment properties in Cook County. Refine your search by price, property type, or more.
Best cash flowing properties in Cook County
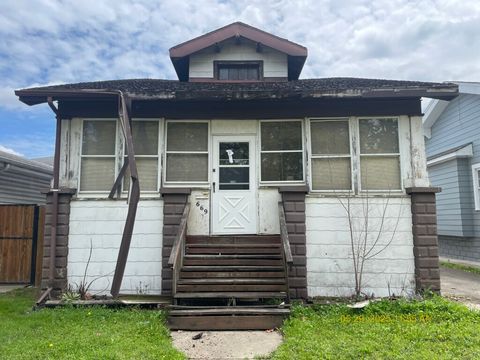
Active
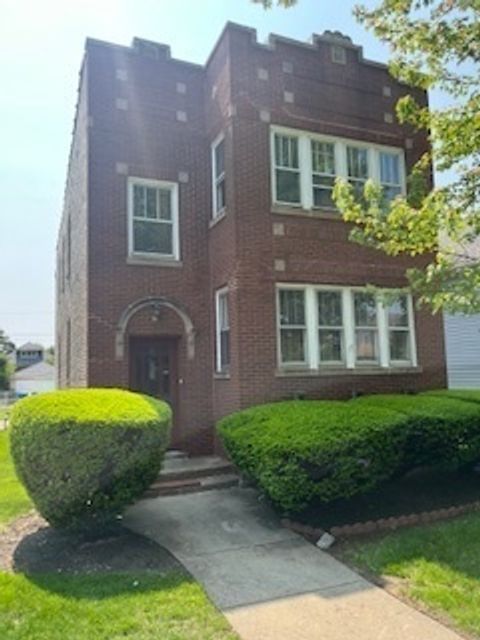
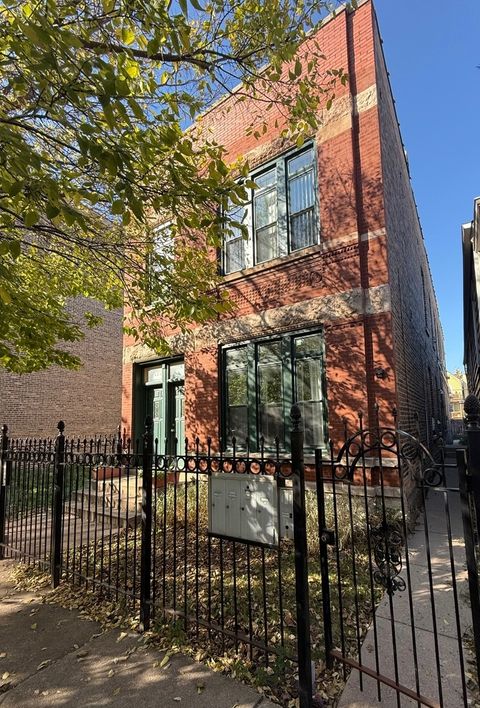
$62,000
2
bds
|
1
ba
|
1,000
sqft
|
built
1913
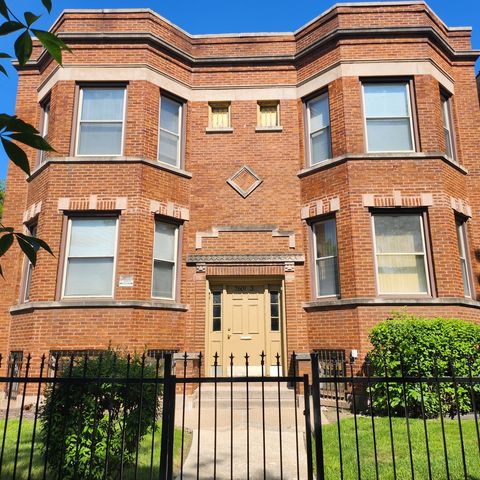
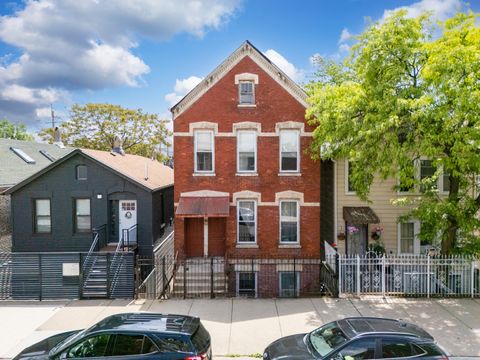
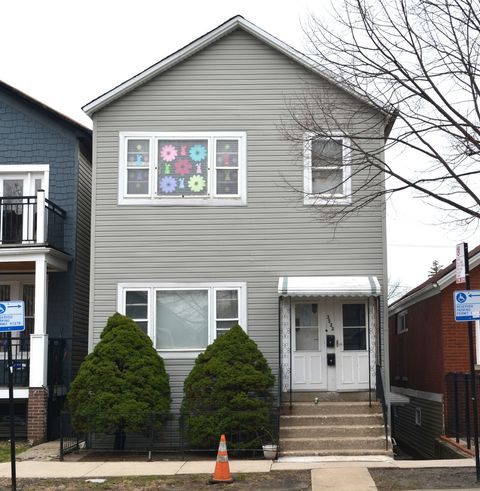
669 Douglas Ave, Calumet City, IL 60409
$812
Cash flow
15.3%
Cash-on-Cash Return
15.7%
Cap rate
2.9%
Rent to Value Ratio
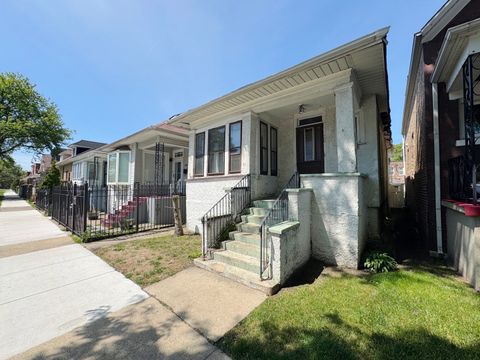
Active
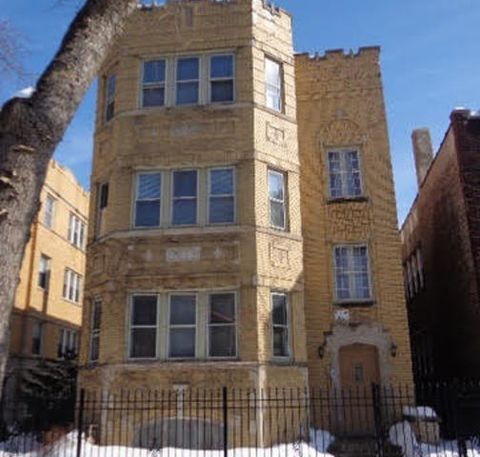
$109,900
3
bds
|
1
ba
|
1,200
sqft
|
built
1913
7514 S Rhodes Ave, Chicago, IL 60619
$754
Cash flow
35.8%
Cash-on-Cash Return
13.9%
Cap rate
1.8%
Rent to Value Ratio
4,811 out of 5,592 properties for sale in Cook County
Limited Results Shown
Create a free account, or log in to reveal all property listings and enjoy the complete experience.
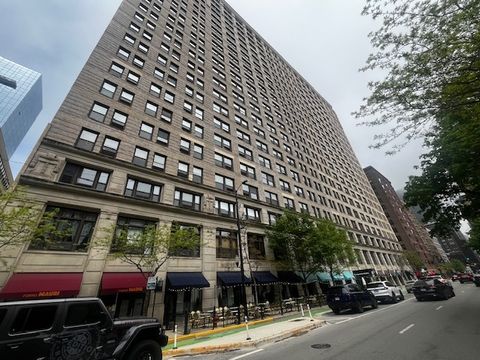
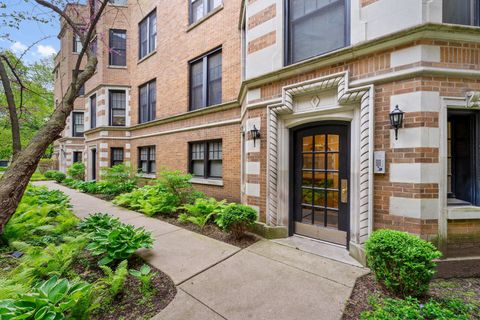
Active
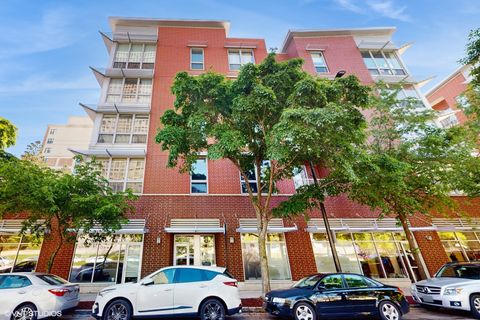
$219,900
1
bds
|
1
ba
|
883
sqft
|
built
1911
600 S Dearborn St, Chicago, IL 60605
$-334
Cash flow
-7.9%
Cash-on-Cash Return
3.9%
Cap rate
0.9%
Rent to Value Ratio
Active
$179,900
2
bds
|
1
ba
|
850
sqft
|
built
1955
3950 N Lake Shore Dr, Chicago, IL 60613
$-63
Cash flow
-1.8%
Cash-on-Cash Return
5.3%
Cap rate
1.4%
Rent to Value Ratio
Active
$340,000
4
bds
|
4
ba
|
0
sqft
|
built
1912
7601 S Morgan St, Chicago, IL 60620
$-581
Cash flow
-8.9%
Cash-on-Cash Return
3.6%
Cap rate
0.6%
Rent to Value Ratio
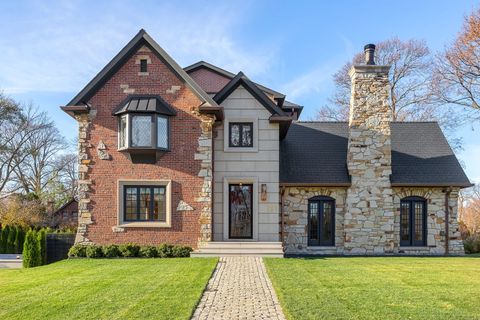
Active
$3,295,000
5
bds
|
6
ba
|
5,118
sqft
|
built
2000
530 Essex Rd, Kenilworth, IL 60043
$-14,969
Cash flow
-23.7%
Cash-on-Cash Return
0.2%
Cap rate
0.3%
Rent to Value Ratio
Active
$175,000
1
bds
|
2
ba
|
825
sqft
|
built
1971
4720 Laurel Dr, Richton Park, IL 60471
$161
Cash flow
4.8%
Cash-on-Cash Return
6.8%
Cap rate
1.1%
Rent to Value Ratio
Active
$219,000
4
bds
|
2
ba
|
1,664
sqft
|
built
1954
106 Blackhawk Dr, Park Forest, IL 60466
$-63
Cash flow
-1.5%
Cash-on-Cash Return
5.3%
Cap rate
1.1%
Rent to Value Ratio
Active
$395,000
9
bds
|
4
ba
|
0
sqft
|
built
1889
2227 W 21st St, Chicago, IL 60608
$-1,170
Cash flow
-15.5%
Cash-on-Cash Return
2.1%
Cap rate
0.6%
Rent to Value Ratio
Active
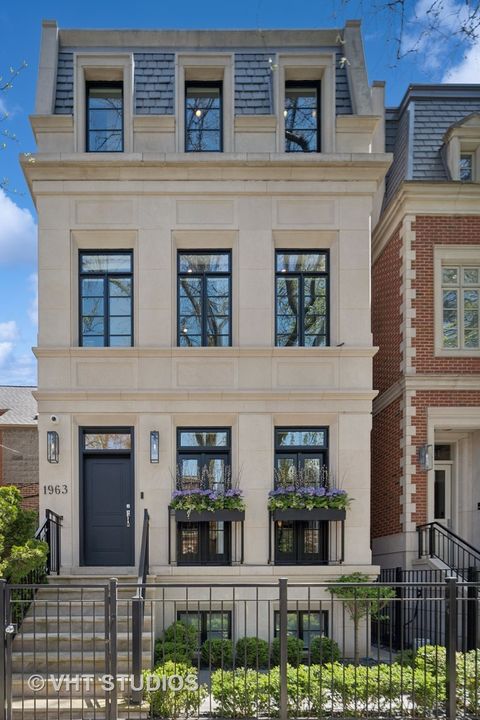
$1,799,000
3
bds
|
3
ba
|
3,334
sqft
|
built
2002
1155 N Dearborn St, Chicago, IL 60610
$-7,728
Cash flow
-22.4%
Cash-on-Cash Return
0.5%
Cap rate
0.5%
Rent to Value Ratio
Active
$400,000
5
bds
|
3
ba
|
0
sqft
|
built
1913
641 N Spaulding Ave, Chicago, IL 60624
$-785
Cash flow
-10.2%
Cash-on-Cash Return
3.3%
Cap rate
0.6%
Rent to Value Ratio
Active
$119,900
2
bds
|
2
ba
|
1,000
sqft
|
built
1970
9745 S Karlov Ave, Oak Lawn, IL 60453
$130
Cash flow
5.7%
Cash-on-Cash Return
7.0%
Cap rate
1.5%
Rent to Value Ratio
Active
$464,900
5
bds
|
3
ba
|
1,855
sqft
|
built
1961
1141 Hartford Ln, Elk Grove Village, IL 60007
$-555
Cash flow
-6.2%
Cash-on-Cash Return
4.2%
Cap rate
0.7%
Rent to Value Ratio
Active
$480,000
5
bds
|
3
ba
|
0
sqft
|
built
1910
648 N Drake Ave, Chicago, IL 60624
$-875
Cash flow
-9.5%
Cash-on-Cash Return
3.5%
Cap rate
0.5%
Rent to Value Ratio
Active
$335,000
3
bds
|
3
ba
|
2,354
sqft
|
built
2003
5013 180th St, Country Club Hills, IL 60478
$-346
Cash flow
-5.4%
Cash-on-Cash Return
4.4%
Cap rate
0.9%
Rent to Value Ratio
Active
$325,500
3
bds
|
3
ba
|
1,600
sqft
|
built
1949
9012 S Harper Ave, Chicago, IL 60619
$-295
Cash flow
-4.7%
Cash-on-Cash Return
4.6%
Cap rate
0.6%
Rent to Value Ratio
Active
$510,000
8
bds
|
3
ba
|
0
sqft
|
built
1888
3533 S Union Ave, Chicago, IL 60609
$-939
Cash flow
-9.6%
Cash-on-Cash Return
3.5%
Cap rate
0.5%
Rent to Value Ratio
Active
$169,000
3
bds
|
2
ba
|
1,308
sqft
|
built
1984
1155 Harding Ave, Calumet City, IL 60409
$91
Cash flow
2.8%
Cash-on-Cash Return
6.3%
Cap rate
1.3%
Rent to Value Ratio
Active
$1,200,000
9
bds
|
5
ba
|
0
sqft
|
built
1896
1727 W Roscoe St, Chicago, IL 60657
$-4,825
Cash flow
-21.0%
Cash-on-Cash Return
0.9%
Cap rate
0.3%
Rent to Value Ratio
Active
$699,000
4
bds
|
5
ba
|
3,767
sqft
|
built
2004
8534 Terminal Ave, Skokie, IL 60077
$-907
Cash flow
-6.8%
Cash-on-Cash Return
4.1%
Cap rate
0.8%
Rent to Value Ratio
Active
$229,500
1
bds
|
1
ba
|
1,000
sqft
|
built
1927
602 Sheridan Rd, Evanston, IL 60202
$-43
Cash flow
-1.0%
Cash-on-Cash Return
5.5%
Cap rate
1.0%
Rent to Value Ratio
Active
$3,599,000
6
bds
|
6
ba
|
0
sqft
|
built
1930
111 Oxford Rd, Kenilworth, IL 60043
$-14,313
Cash flow
-20.7%
Cash-on-Cash Return
0.9%
Cap rate
0.2%
Rent to Value Ratio
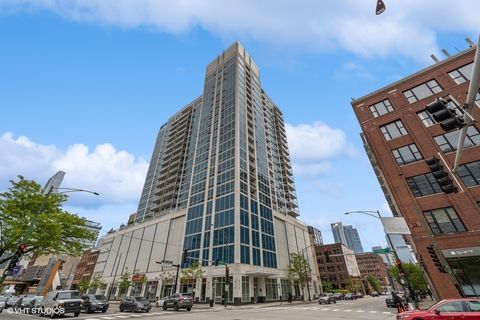
Active
$510,000
2
bds
|
2
ba
|
1,184
sqft
|
built
2008
757 N Orleans St, Chicago, IL 60654
$-1,635
Cash flow
-16.7%
Cash-on-Cash Return
1.8%
Cap rate
0.7%
Rent to Value Ratio
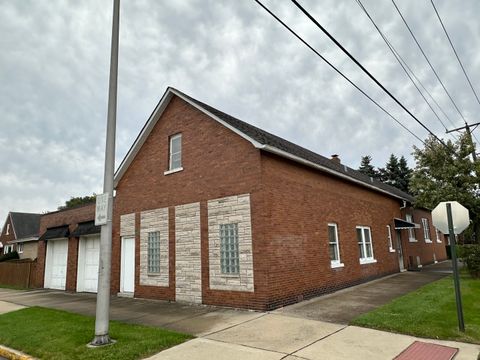
Active
$154,900
5
bds
|
2
ba
|
2,184
sqft
|
built
1923
347 156th St, Calumet City, IL 60409
$511
Cash flow
17.2%
Cash-on-Cash Return
9.6%
Cap rate
1.6%
Rent to Value Ratio
Active
$599,000
6
bds
|
2
ba
|
0
sqft
|
built
1920
4979 N Kolmar Ave, Chicago, IL 60630
$-2,004
Cash flow
-17.5%
Cash-on-Cash Return
1.7%
Cap rate
0.4%
Rent to Value Ratio
Active
$3,950,000
6
bds
|
7
ba
|
4,366
sqft
|
built
2020
1963 N Dayton St, Chicago, IL 60614
$-17,011
Cash flow
-22.5%
Cash-on-Cash Return
0.5%
Cap rate
0.3%
Rent to Value Ratio
Active
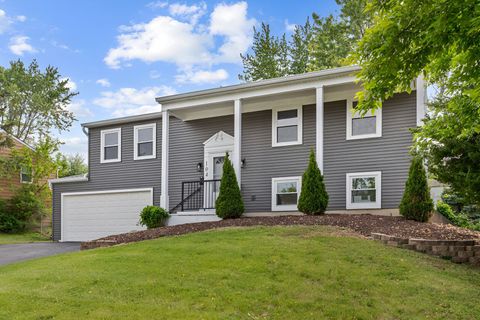
$485,000
4
bds
|
2
ba
|
2,332
sqft
|
built
1974
104 N Braintree Dr, Schaumburg, IL 60194
$-790
Cash flow
-8.5%
Cash-on-Cash Return
3.7%
Cap rate
0.7%
Rent to Value Ratio
Active
$234,900
5
bds
|
2
ba
|
2,900
sqft
|
built
1893
14020 S Green Bay Ave, Burnham, IL 60633
$388
Cash flow
8.6%
Cash-on-Cash Return
7.7%
Cap rate
1.2%
Rent to Value Ratio
Active
$1,199,000
3
bds
|
3
ba
|
2,610
sqft
|
built
2003
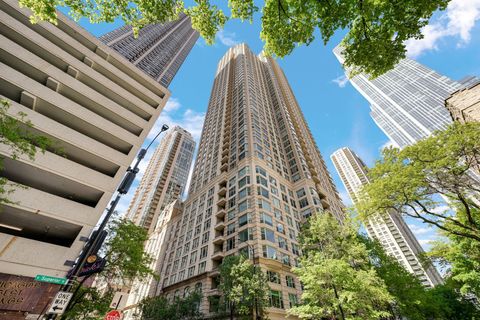
25 E Superior St, Chicago, IL 60611
$-5,112
Cash flow
-22.2%
Cash-on-Cash Return
0.6%
Cap rate
0.6%
Rent to Value Ratio
Active
$315,000
2
bds
|
2
ba
|
1,000
sqft
|
built
2000
420 S Clinton St, Chicago, IL 60607
$-649
Cash flow
-10.7%
Cash-on-Cash Return
3.2%
Cap rate
0.9%
Rent to Value Ratio
Active
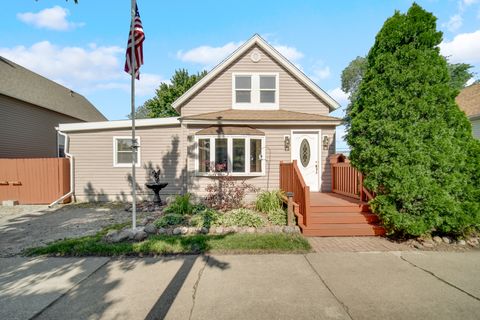
$78,900
2
bds
|
1
ba
|
1,037
sqft
|
built
1956
14723 Michigan Ave, Dolton, IL 60419
$601
Cash flow
39.7%
Cash-on-Cash Return
14.8%
Cap rate
2.5%
Rent to Value Ratio
Active
$349,000
4
bds
|
3
ba
|
2,287
sqft
|
built
1964
10540 Lockwood Ave, Oak Lawn, IL 60453
$-290
Cash flow
-4.3%
Cash-on-Cash Return
4.7%
Cap rate
0.9%
Rent to Value Ratio
Active
$329,000
4
bds
|
2
ba
|
1,849
sqft
|
built
1957
7826 W 98th Pl, Hickory Hills, IL 60457
$-203
Cash flow
-3.2%
Cash-on-Cash Return
4.9%
Cap rate
0.9%
Rent to Value Ratio
Active
$369,000
3
bds
|
2
ba
|
1,215
sqft
|
built
1973
7728 Natchez Ave, Burbank, IL 60459
$-590
Cash flow
-8.3%
Cash-on-Cash Return
3.8%
Cap rate
0.7%
Rent to Value Ratio
Active
$264,000
4
bds
|
3
ba
|
2,310
sqft
|
built
1971
22757 Lakeshore Dr, Richton Park, IL 60471
$-64
Cash flow
-1.3%
Cash-on-Cash Return
5.4%
Cap rate
1.0%
Rent to Value Ratio
Active
$150,000
3
bds
|
1
ba
|
1,341
sqft
|
built
1954
1387 Price Ave, Calumet City, IL 60409
$12
Cash flow
0.4%
Cash-on-Cash Return
5.8%
Cap rate
1.3%
Rent to Value Ratio
Active
$1,224,000
8
bds
|
4
ba
|
0
sqft
|
built
1879
1454 W Ohio St, Chicago, IL 60642
$-5,136
Cash flow
-21.9%
Cash-on-Cash Return
0.6%
Cap rate
0.2%
Rent to Value Ratio
Active
$399,999
9
bds
|
3
ba
|
0
sqft
|
built
1927
7921 S Hermitage Ave, Chicago, IL 60620
$-704
Cash flow
-9.2%
Cash-on-Cash Return
3.6%
Cap rate
0.6%
Rent to Value Ratio
Active
$414,000
2
bds
|
2
ba
|
1,027
sqft
|
built
2007
2025 S Indiana Ave, Chicago, IL 60616
$-1,101
Cash flow
-13.9%
Cash-on-Cash Return
2.5%
Cap rate
0.7%
Rent to Value Ratio
Active
$359,900
3
bds
|
2
ba
|
2,000
sqft
|
built
1923
785 Alice St, Chicago Heights, IL 60411
$-375
Cash flow
-5.4%
Cash-on-Cash Return
4.4%
Cap rate
0.6%
Rent to Value Ratio