Cook County Investment Properties for Sale
Browse homes for sale and investment properties in Cook County. Refine your search by price, property type, or more.
Best cash flowing properties in Cook County
Active
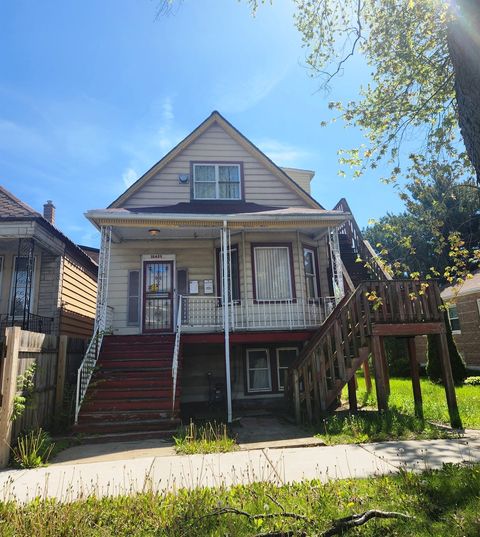
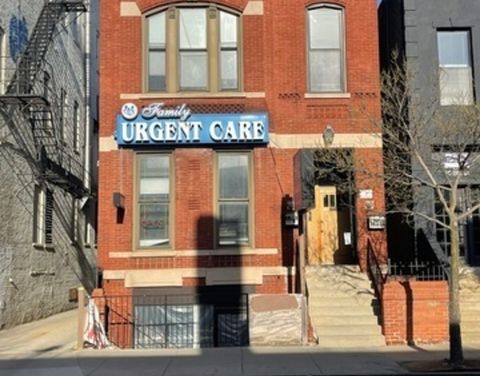
$74,900
3
bds
|
3
ba
|
1,600
sqft
|
built
1905
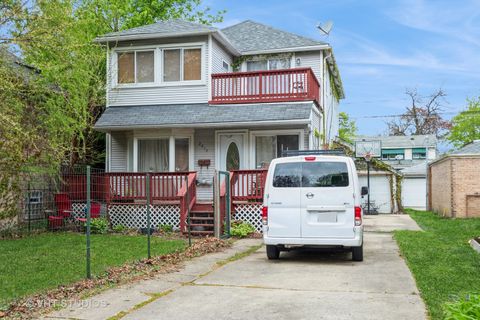
10435 S Calhoun Ave, Chicago, IL 60617
$1,470
Cash flow
22.9%
Cash-on-Cash Return
23.6%
Cap rate
2.9%
Rent to Value Ratio
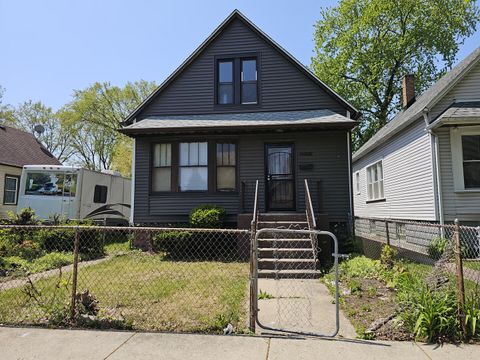
Active
$89,900
4
bds
|
1
ba
|
861
sqft
|
built
1913
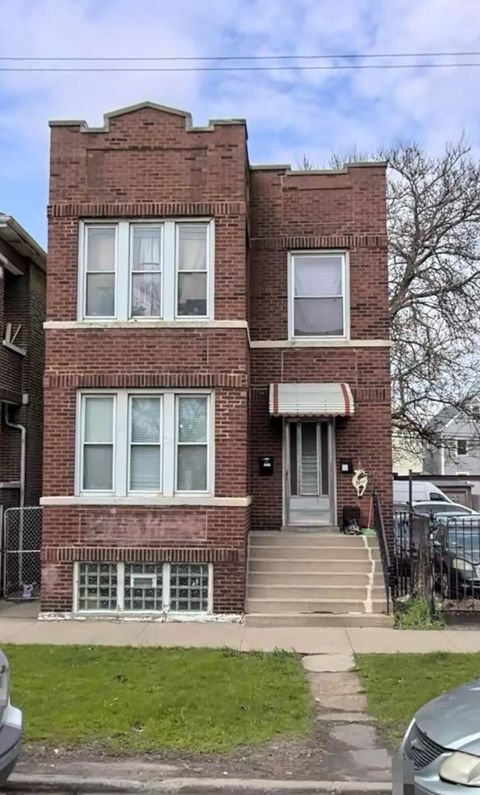
12028 S Lafayette Ave, Chicago, IL 60628
$777
Cash flow
45.1%
Cash-on-Cash Return
16.0%
Cap rate
2.0%
Rent to Value Ratio
4,654 out of 5,416 properties for sale in Cook County
Limited Results Shown
Create a free account, or log in to reveal all property listings and enjoy the complete experience.
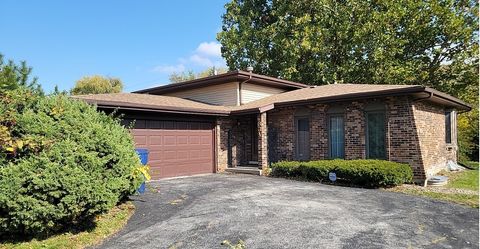
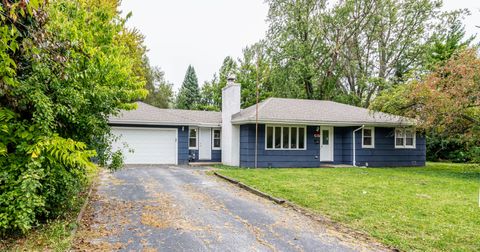
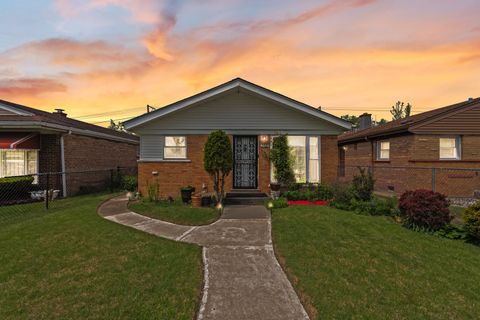
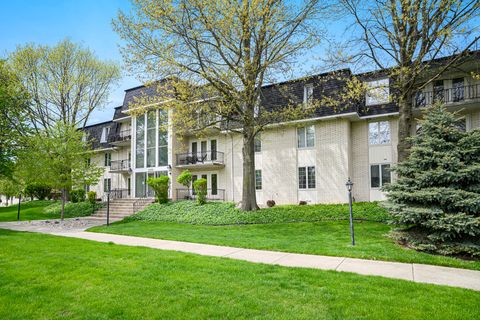
Active
$329,900
3
bds
|
2
ba
|
1,180
sqft
|
built
1976
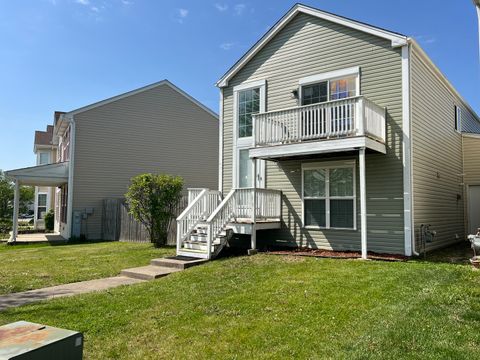
831 Violet Ln, Matteson, IL 60443
$-571
Cash flow
-9.0%
Cash-on-Cash Return
3.6%
Cap rate
0.7%
Rent to Value Ratio
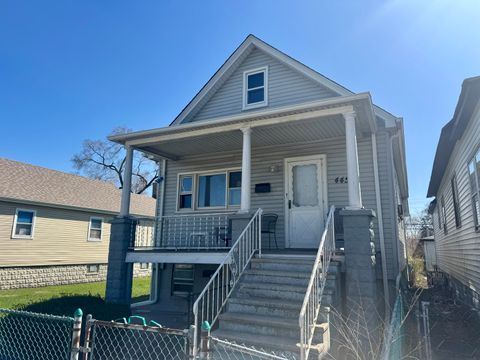
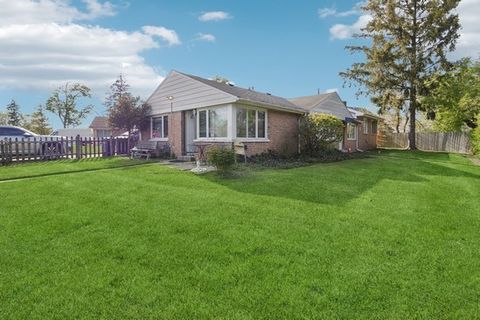
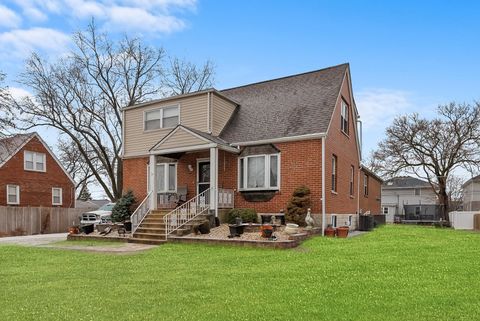
Active
$94,900
2
bds
|
2
ba
|
680
sqft
|
built
1893
445 State St, Calumet City, IL 60409
$328
Cash flow
18.0%
Cash-on-Cash Return
9.8%
Cap rate
1.7%
Rent to Value Ratio
Active
$529,770
3
bds
|
2
ba
|
1,654
sqft
|
built
1927
2614 W Morse Ave, Chicago, IL 60645
$-862
Cash flow
-8.5%
Cash-on-Cash Return
3.7%
Cap rate
0.6%
Rent to Value Ratio
Active
$189,000
3
bds
|
2
ba
|
1,376
sqft
|
built
2007
410 Main St, Park Forest, IL 60466
$-37
Cash flow
-1.0%
Cash-on-Cash Return
5.4%
Cap rate
1.2%
Rent to Value Ratio
Active
$329,900
3
bds
|
3
ba
|
2,122
sqft
|
built
1961
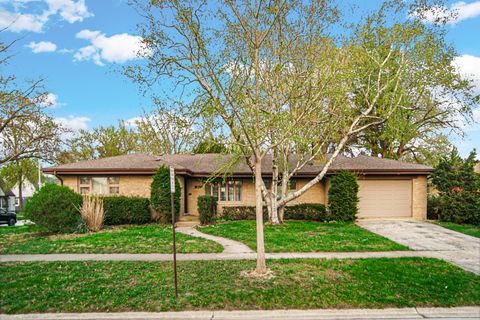
10001 Kedvale Ave, Oak Lawn, IL 60453
$-230
Cash flow
-3.6%
Cash-on-Cash Return
4.8%
Cap rate
0.9%
Rent to Value Ratio
Active
$319,000
4
bds
|
2
ba
|
0
sqft
|
built
1924
4334 S Western Ave, Chicago, IL 60609
$-310
Cash flow
-5.1%
Cash-on-Cash Return
4.5%
Cap rate
0.7%
Rent to Value Ratio
Active
$264,900
4
bds
|
3
ba
|
2,200
sqft
|
built
1962
16037 Evans Ave, South Holland, IL 60473
$70
Cash flow
1.4%
Cash-on-Cash Return
6.0%
Cap rate
1.2%
Rent to Value Ratio

Active
$174,999
3
bds
|
1
ba
|
1,053
sqft
|
built
1953
12509 S Bishop St, Calumet Park, IL 60827
$287
Cash flow
8.6%
Cash-on-Cash Return
7.6%
Cap rate
1.1%
Rent to Value Ratio
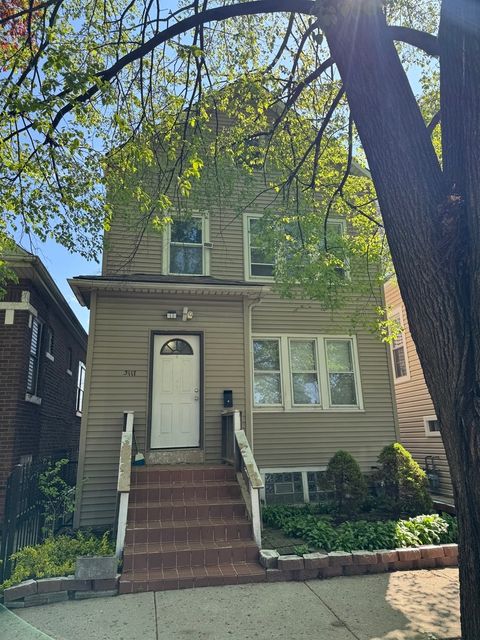
Active
$319,000
4
bds
|
2
ba
|
0
sqft
|
built
1913
3117 S 53rd Ave, Cicero, IL 60804
$-1,043
Cash flow
-17.1%
Cash-on-Cash Return
1.8%
Cap rate
0.4%
Rent to Value Ratio
Active
$150,000
2
bds
|
2
ba
|
878
sqft
|
built
1922
10159 S Wentworth Ave, Chicago, IL 60628
$400
Cash flow
13.9%
Cash-on-Cash Return
8.9%
Cap rate
1.2%
Rent to Value Ratio
Active
$240,000
3
bds
|
2
ba
|
1,088
sqft
|
built
1956
124 Wilson St, Park Forest, IL 60466
$-171
Cash flow
-3.7%
Cash-on-Cash Return
4.8%
Cap rate
1.1%
Rent to Value Ratio
Active
$198,000
3
bds
|
1
ba
|
1,062
sqft
|
built
1955
9532 S Green St, Chicago, IL 60643
$443
Cash flow
11.7%
Cash-on-Cash Return
8.4%
Cap rate
1.0%
Rent to Value Ratio
Active
$369,900
4
bds
|
3
ba
|
1,664
sqft
|
built
1955
2104 S River Rd, Des Plaines, IL 60018
$-269
Cash flow
-3.8%
Cash-on-Cash Return
4.8%
Cap rate
0.8%
Rent to Value Ratio
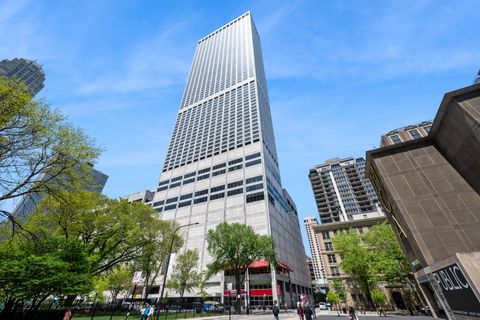
Active
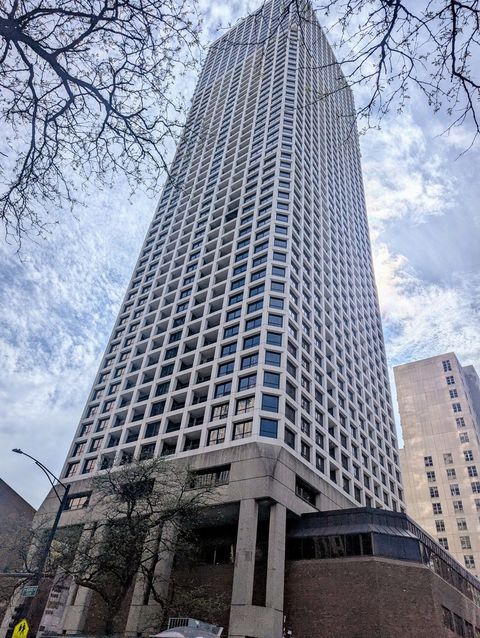
$1,497,747
3
bds
|
3
ba
|
2,754
sqft
|
built
1975
180 E Pearson St, Chicago, IL 60611
$-8,082
Cash flow
-28.2%
Cash-on-Cash Return
-0.8%
Cap rate
0.3%
Rent to Value Ratio
Active
$150,000
5
bds
|
3
ba
|
3,125
sqft
|
built
1931
14910 Wood St, Harvey, IL 60426
$-704
Cash flow
-24.5%
Cash-on-Cash Return
0.0%
Cap rate
0.8%
Rent to Value Ratio
Active
$215,000
3
bds
|
2
ba
|
1,600
sqft
|
built
1975
11151 Cottonwood Dr, Palos Hills, IL 60465
$-186
Cash flow
-4.5%
Cash-on-Cash Return
4.6%
Cap rate
1.1%
Rent to Value Ratio
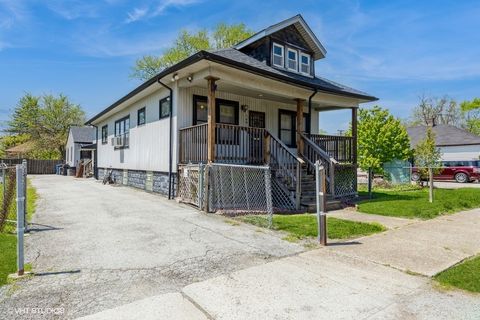
Active
$329,999
6
bds
|
2
ba
|
0
sqft
|
built
1894
7223 S Union Ave, Chicago, IL 60621
$-162
Cash flow
-2.6%
Cash-on-Cash Return
5.1%
Cap rate
0.7%
Rent to Value Ratio
Active
$620,000
2
bds
|
1
ba
|
2,000
sqft
|
built
1952
7330 N Kildare Ave, Lincolnwood, IL 60712
$-1,805
Cash flow
-15.2%
Cash-on-Cash Return
2.2%
Cap rate
0.5%
Rent to Value Ratio
Active
$209,000
4
bds
|
2
ba
|
1,700
sqft
|
built
1957
433 Wildwood Dr, Park Forest, IL 60466
$169
Cash flow
4.2%
Cash-on-Cash Return
6.6%
Cap rate
1.3%
Rent to Value Ratio
Active
$2,749,000
6
bds
|
7
ba
|
5,500
sqft
|
built
1910
527 Warwick Rd, Kenilworth, IL 60043
$-9,695
Cash flow
-18.4%
Cash-on-Cash Return
1.4%
Cap rate
0.3%
Rent to Value Ratio
Active
$280,000
3
bds
|
2
ba
|
2,060
sqft
|
built
1956
9539 S Forest Ave, Chicago, IL 60628
$15
Cash flow
0.3%
Cash-on-Cash Return
5.7%
Cap rate
0.8%
Rent to Value Ratio
Active
$359,900
1
bds
|
2
ba
|
1,002
sqft
|
built
2007
611 S Wells St, Chicago, IL 60607
$-977
Cash flow
-14.2%
Cash-on-Cash Return
2.4%
Cap rate
0.8%
Rent to Value Ratio
Active
$280,000
4
bds
|
3
ba
|
0
sqft
|
built
1924
26 E 101st Pl, Chicago, IL 60628
$-146
Cash flow
-2.7%
Cash-on-Cash Return
5.1%
Cap rate
0.7%
Rent to Value Ratio
Active
$399,000
4
bds
|
3
ba
|
2,050
sqft
|
built
1958
115 N Lavergne Ave, Northlake, IL 60164
$30
Cash flow
0.4%
Cash-on-Cash Return
5.8%
Cap rate
0.8%
Rent to Value Ratio
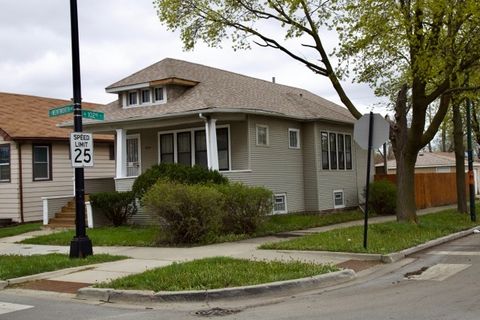
Active
$380,000
5
bds
|
5
ba
|
3,449
sqft
|
built
2008
5904 Burr Oak Ave, Berkeley, IL 60163
$-29
Cash flow
-0.4%
Cash-on-Cash Return
5.6%
Cap rate
1.2%
Rent to Value Ratio
Active
$1,475,000
4
bds
|
3
ba
|
0
sqft
|
built
1908
2645 N Mozart St, Chicago, IL 60647
$-4,726
Cash flow
-16.7%
Cash-on-Cash Return
1.8%
Cap rate
0.3%
Rent to Value Ratio
Active
$77,000
2
bds
|
1
ba
|
750
sqft
|
built
1975
6707 S Chappel Ave, Chicago, IL 60649
$189
Cash flow
12.8%
Cash-on-Cash Return
8.6%
Cap rate
1.7%
Rent to Value Ratio
Active
$899,900
5
bds
|
4
ba
|
3,360
sqft
|
built
1966
2405 E Miner St, Arlington Heights, IL 60004
$-1,950
Cash flow
-11.3%
Cash-on-Cash Return
3.1%
Cap rate
0.6%
Rent to Value Ratio
Active
$549,999
4
bds
|
3
ba
|
2,194
sqft
|
built
1942
12617 S 74th Ave, Palos Heights, IL 60463
$-1,037
Cash flow
-9.8%
Cash-on-Cash Return
3.4%
Cap rate
0.6%
Rent to Value Ratio
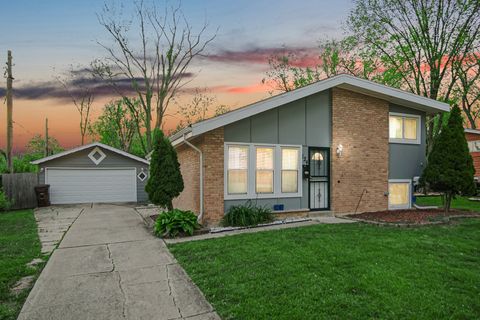
Active
$279,900
4
bds
|
3
ba
|
1,868
sqft
|
built
1980
50 Wedgewood Rd, Matteson, IL 60443
$88
Cash flow
1.6%
Cash-on-Cash Return
6.1%
Cap rate
1.1%
Rent to Value Ratio
Active
$285,000
6
bds
|
2
ba
|
0
sqft
|
built
1908
7542 S Peoria St, Chicago, IL 60620
$-526
Cash flow
-9.6%
Cash-on-Cash Return
3.5%
Cap rate
0.6%
Rent to Value Ratio
Active
$350,000
3
bds
|
2
ba
|
0
sqft
|
built
1895
624 N Spaulding Ave, Chicago, IL 60624
$-231
Cash flow
-3.4%
Cash-on-Cash Return
4.9%
Cap rate
0.7%
Rent to Value Ratio
Active
$560,000
2
bds
|
2
ba
|
1,200
sqft
|
built
1970
1030 N State St, Chicago, IL 60610
$-1,559
Cash flow
-14.5%
Cash-on-Cash Return
2.3%
Cap rate
0.8%
Rent to Value Ratio
Active
$124,000
6
bds
|
2
ba
|
0
sqft
|
built
1884
334 N Avers Ave, Chicago, IL 60624
$247
Cash flow
10.4%
Cash-on-Cash Return
8.1%
Cap rate
1.1%
Rent to Value Ratio
Active
$120,000
1
bds
|
1
ba
|
850
sqft
|
built
1927
10433 S Hale Ave, Chicago, IL 60643
$-56
Cash flow
-2.4%
Cash-on-Cash Return
5.1%
Cap rate
1.2%
Rent to Value Ratio
Active
$1,570,000
3
bds
|
4
ba
|
0
sqft
|
built
1873
1631 N Halsted St, Chicago, IL 60614
$-6,927
Cash flow
-23.0%
Cash-on-Cash Return
0.4%
Cap rate
0.2%
Rent to Value Ratio
Active
$140,000
2
bds
|
2
ba
|
1,250
sqft
|
built
1983
2608 186th St, Lansing, IL 60438
$214
Cash flow
8.0%
Cash-on-Cash Return
7.5%
Cap rate
1.3%
Rent to Value Ratio
Active
$549,000
3
bds
|
3
ba
|
4,088
sqft
|
built
1945
5348 8th Ave, Countryside, IL 60525
$-424
Cash flow
-4.0%
Cash-on-Cash Return
4.8%
Cap rate
0.7%
Rent to Value Ratio