Cook County Investment Properties for Sale
Browse homes for sale and investment properties in Cook County. Refine your search by price, property type, or more.
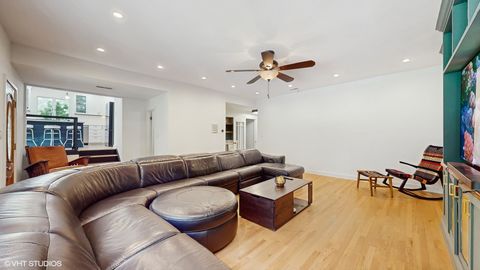
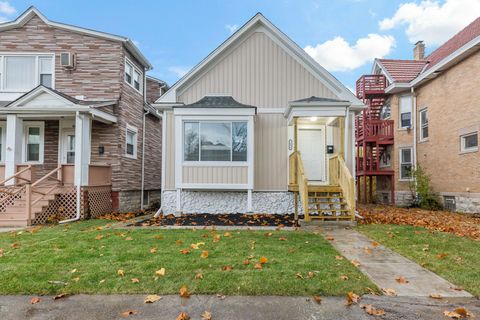
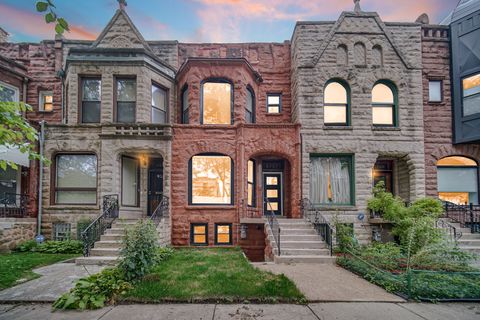
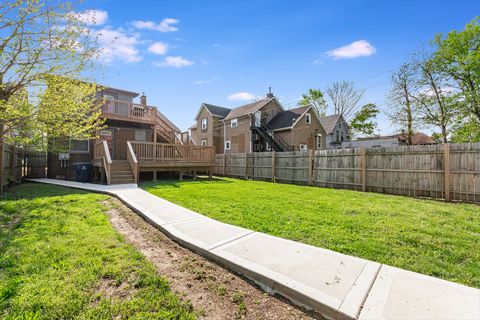
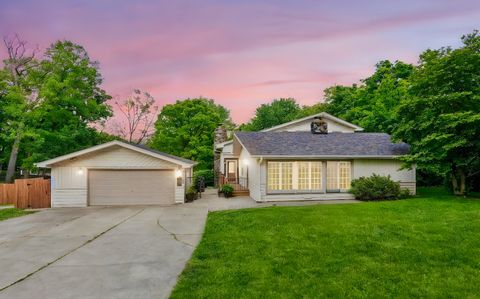
Best cash flowing properties in Cook County
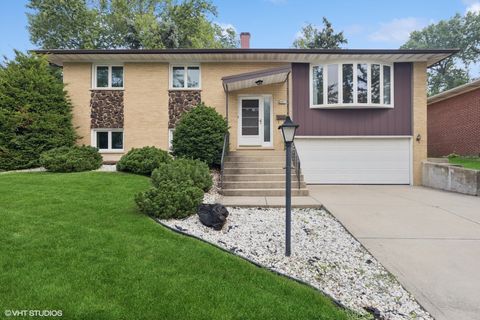
Active
$85,000
2
bds
|
2
ba
|
900
sqft
|
built
1973
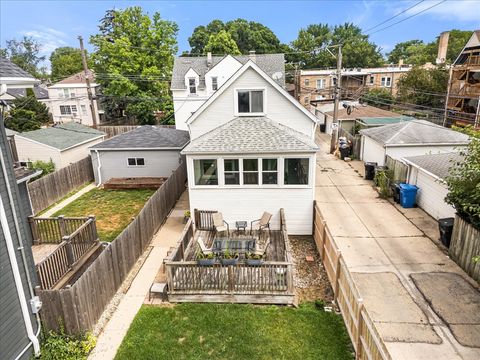
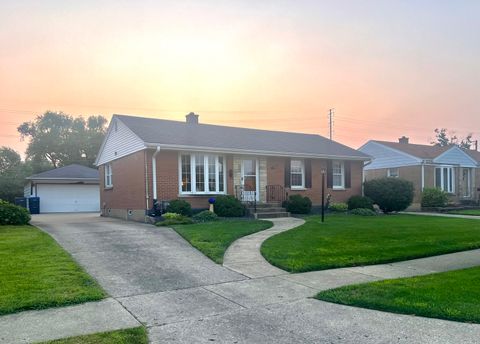
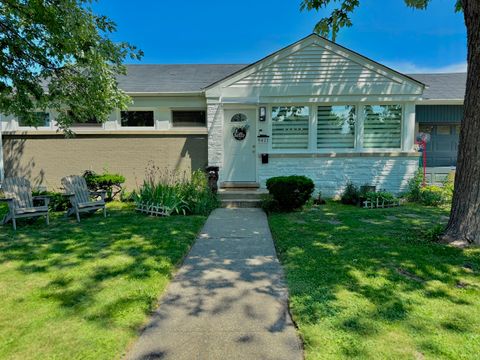
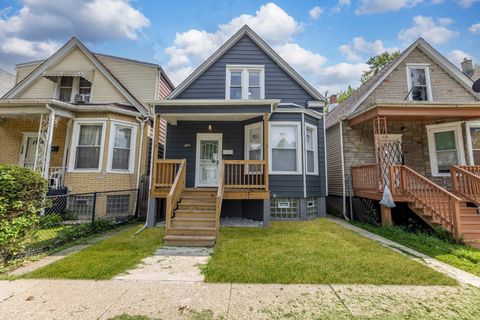
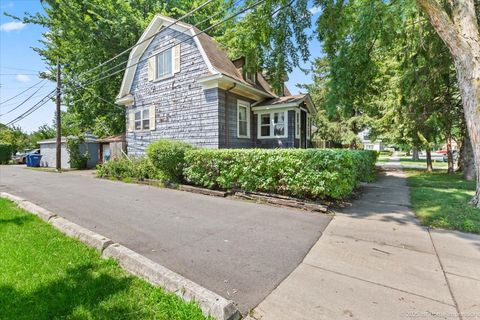
17975 Huntleigh Ct, Country Club Hills, IL 60478
$699
Cash flow
42.9%
Cash-on-Cash Return
15.5%
Cap rate
2.6%
Rent to Value Ratio
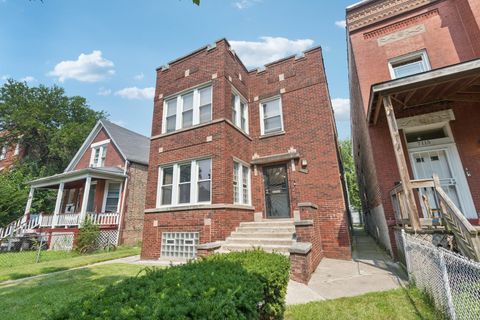
Active
$105,000
4
bds
|
2
ba
|
0
sqft
|
built
1908
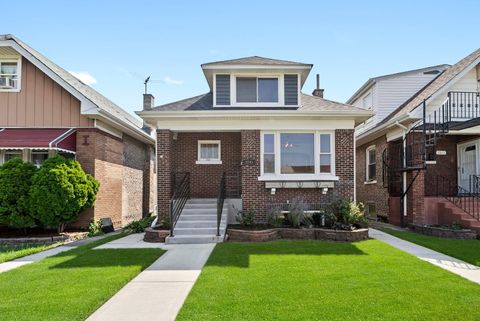
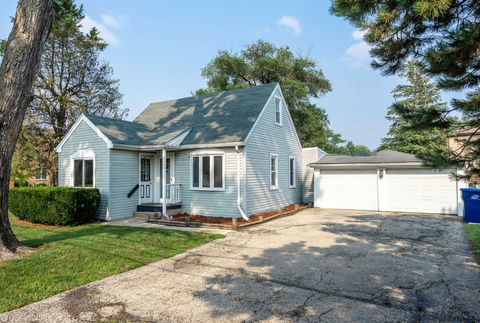
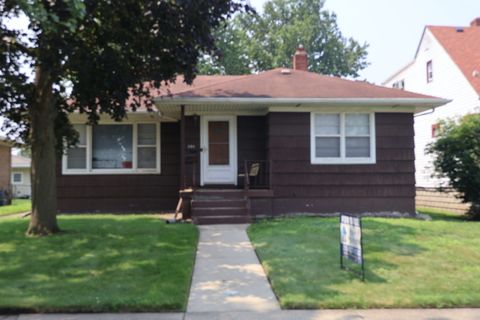
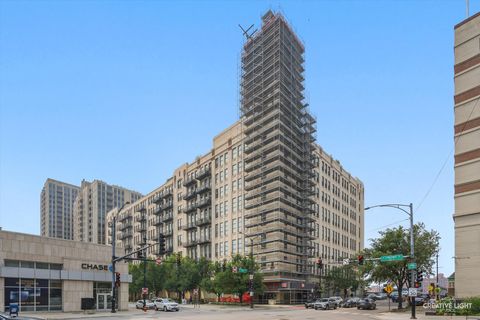
10240 S Indiana Ave, Chicago, IL 60628
$689
Cash flow
34.2%
Cash-on-Cash Return
13.6%
Cap rate
1.7%
Rent to Value Ratio
4,463 out of 5,202 properties for sale in Cook County
Limited Results Shown
Create a free account, or log in to reveal all property listings and enjoy the complete experience.
Active
$688,000
4
bds
|
3
ba
|
2,767
sqft
|
built
2007
5727 S Meade Ave, Chicago, IL 60638
$-1,107
Cash flow
-8.4%
Cash-on-Cash Return
3.7%
Cap rate
0.6%
Rent to Value Ratio
Active
$550,000
2
bds
|
2
ba
|
0
sqft
|
built
1910
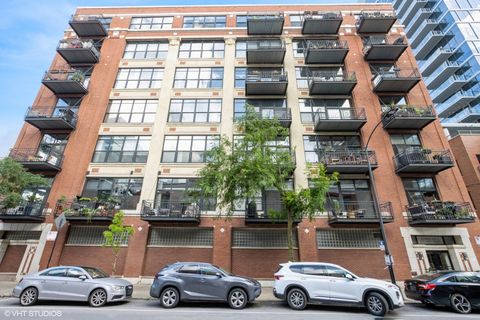
1040 W Adams St, Chicago, IL 60607
$-1,611
Cash flow
-15.3%
Cash-on-Cash Return
2.2%
Cap rate
0.7%
Rent to Value Ratio
Active
$1,250,000
4
bds
|
4
ba
|
3,300
sqft
|
built
1981
500 Auvergne Pl, River Forest, IL 60305
$-2,977
Cash flow
-12.4%
Cash-on-Cash Return
2.8%
Cap rate
0.6%
Rent to Value Ratio
Active
$164,900
2
bds
|
1
ba
|
1,694
sqft
|
built
1894
1636 Euclid Ave, Chicago Heights, IL 60411
$575
Cash flow
18.2%
Cash-on-Cash Return
9.9%
Cap rate
1.2%
Rent to Value Ratio
Active
$690,000
4
bds
|
4
ba
|
2,700
sqft
|
built
1893
4752 S Champlain Ave, Chicago, IL 60615
$-1,802
Cash flow
-13.6%
Cash-on-Cash Return
2.5%
Cap rate
0.4%
Rent to Value Ratio
Active
$350,000
5
bds
|
3
ba
|
0
sqft
|
built
1914
14412 Martin Luther King Jr Dr, Dolton, IL 60419
$-741
Cash flow
-11.0%
Cash-on-Cash Return
3.1%
Cap rate
0.6%
Rent to Value Ratio
Active
$375,000
3
bds
|
3
ba
|
1,356
sqft
|
built
1957
10610 Essex St, Westchester, IL 60154
$13
Cash flow
0.2%
Cash-on-Cash Return
5.7%
Cap rate
0.7%
Rent to Value Ratio
Active
$339,000
4
bds
|
2
ba
|
1,938
sqft
|
built
1957
9242 S Constance Ave, Chicago, IL 60617
$-191
Cash flow
-2.9%
Cash-on-Cash Return
5.0%
Cap rate
0.7%
Rent to Value Ratio
Active
$390,000
3
bds
|
3
ba
|
2,100
sqft
|
built
1920
9547 S Longwood Dr, Chicago, IL 60643
$-48
Cash flow
-0.6%
Cash-on-Cash Return
5.5%
Cap rate
0.9%
Rent to Value Ratio
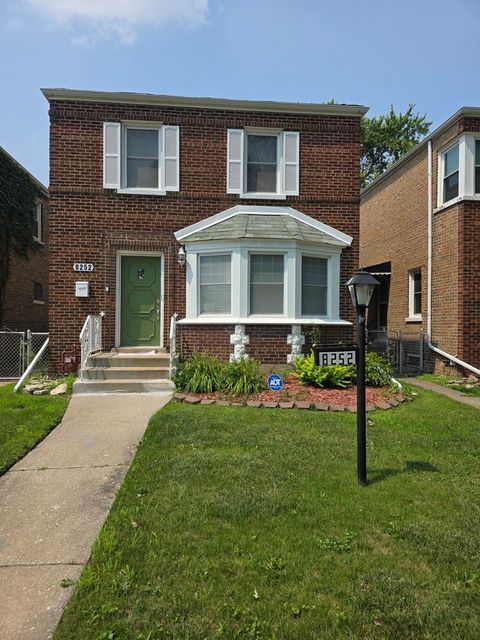
Active
$305,000
3
bds
|
2
ba
|
1,200
sqft
|
built
1952
8252 S Calumet Ave, Chicago, IL 60619
$123
Cash flow
2.1%
Cash-on-Cash Return
6.2%
Cap rate
0.8%
Rent to Value Ratio
Active
$349,900
3
bds
|
2
ba
|
966
sqft
|
built
1925
4314 W Henderson St, Chicago, IL 60641
$-148
Cash flow
-2.2%
Cash-on-Cash Return
5.2%
Cap rate
0.8%
Rent to Value Ratio
Active
$299,000
1
bds
|
1
ba
|
877
sqft
|
built
2005
330 W Grand Ave, Chicago, IL 60654
$-782
Cash flow
-13.6%
Cash-on-Cash Return
2.5%
Cap rate
0.8%
Rent to Value Ratio
Active
$395,000
2
bds
|
2
ba
|
1,375
sqft
|
built
2003
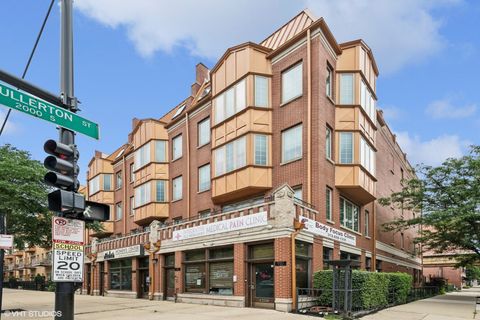
1935 S State St, Chicago, IL 60616
$-804
Cash flow
-10.6%
Cash-on-Cash Return
3.2%
Cap rate
0.7%
Rent to Value Ratio
Active
$379,900
3
bds
|
2
ba
|
1,614
sqft
|
built
1923
3141 S 54th Ct, Cicero, IL 60804
$-681
Cash flow
-9.4%
Cash-on-Cash Return
3.5%
Cap rate
0.6%
Rent to Value Ratio
Active
$359,900
3
bds
|
2
ba
|
1,000
sqft
|
built
1953
1516 Atwood Ave, Berkeley, IL 60163
$84
Cash flow
1.2%
Cash-on-Cash Return
6.0%
Cap rate
0.8%
Rent to Value Ratio
Active
$599,000
5
bds
|
4
ba
|
4,000
sqft
|
built
1951
12811 S 82nd Ct, Palos Park, IL 60464
$-904
Cash flow
-7.9%
Cash-on-Cash Return
3.9%
Cap rate
0.7%
Rent to Value Ratio
Active
$434,900
1
bds
|
1
ba
|
0
sqft
|
built
1970
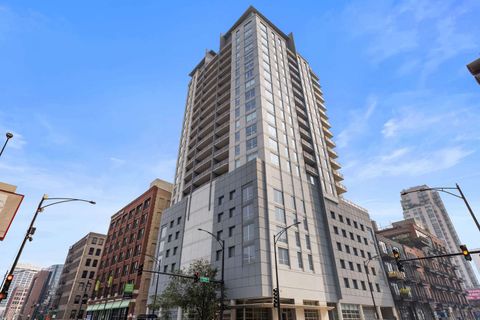
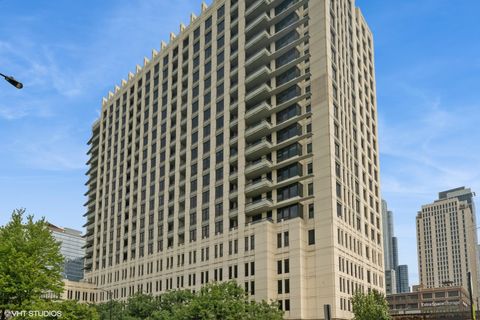
1030 N State St, Chicago, IL 60610
$-1,585
Cash flow
-19.0%
Cash-on-Cash Return
1.3%
Cap rate
0.6%
Rent to Value Ratio
Active
$849,900
2
bds
|
2
ba
|
1,586
sqft
|
built
2007
420 E Waterside Dr, Chicago, IL 60601
$-3,031
Cash flow
-18.6%
Cash-on-Cash Return
1.4%
Cap rate
0.6%
Rent to Value Ratio
Active
$329,000
3
bds
|
2
ba
|
1,753
sqft
|
built
1967
6501 Forestview Dr, Oak Forest, IL 60452
$-176
Cash flow
-2.8%
Cash-on-Cash Return
5.0%
Cap rate
0.9%
Rent to Value Ratio
Active
$274,999
6
bds
|
4
ba
|
0
sqft
|
built
1914
7111 S Emerald Ave, Chicago, IL 60621
$220
Cash flow
4.2%
Cash-on-Cash Return
6.6%
Cap rate
0.9%
Rent to Value Ratio
Active
$555,000
4
bds
|
2
ba
|
0
sqft
|
built
1910
2521 N Springfield Ave, Chicago, IL 60647
$-1,608
Cash flow
-15.1%
Cash-on-Cash Return
2.2%
Cap rate
0.5%
Rent to Value Ratio
Active
$420,000
8
bds
|
4
ba
|
0
sqft
|
built
1890
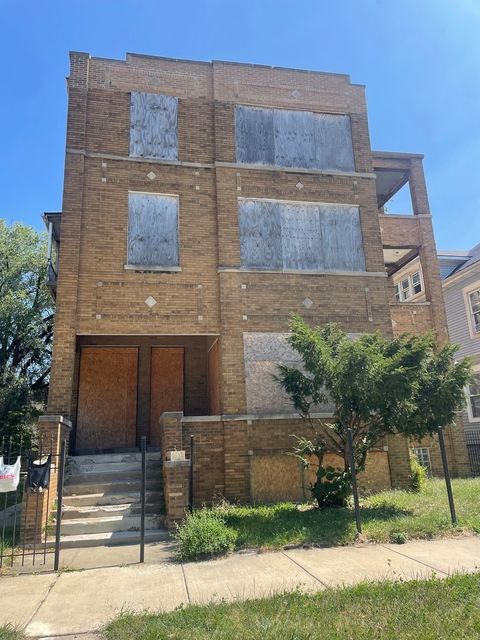
9116 S South Chicago Ave, Chicago, IL 60617
$-993
Cash flow
-12.3%
Cash-on-Cash Return
2.8%
Cap rate
0.4%
Rent to Value Ratio
Active
$430,000
3
bds
|
2
ba
|
1,074
sqft
|
built
1955
9421 Sayre Ave, Morton Grove, IL 60053
$-571
Cash flow
-6.9%
Cash-on-Cash Return
4.1%
Cap rate
0.7%
Rent to Value Ratio
Active
$380,000
4
bds
|
3
ba
|
1,272
sqft
|
built
1952
2209 Douglas Ave, Des Plaines, IL 60018
$-320
Cash flow
-4.4%
Cash-on-Cash Return
4.7%
Cap rate
0.7%
Rent to Value Ratio
Active
$99,900
0
bds
|
1
ba
|
500
sqft
|
built
1968
2941 S Michigan Ave, Chicago, IL 60616
$-55
Cash flow
-2.9%
Cash-on-Cash Return
5.0%
Cap rate
1.2%
Rent to Value Ratio
Active
$325,000
1
bds
|
1
ba
|
860
sqft
|
built
1906
843 W Adams St, Chicago, IL 60607
$-671
Cash flow
-10.8%
Cash-on-Cash Return
3.2%
Cap rate
0.9%
Rent to Value Ratio
Active
$220,000
3
bds
|
1
ba
|
1,000
sqft
|
built
1905
6127 S Bishop St, Chicago, IL 60636
$-41
Cash flow
-1.0%
Cash-on-Cash Return
5.5%
Cap rate
0.7%
Rent to Value Ratio
Active
$380,000
2
bds
|
2
ba
|
1,068
sqft
|
built
2006
1255 S State St, Chicago, IL 60605
$-1,324
Cash flow
-18.2%
Cash-on-Cash Return
1.5%
Cap rate
0.8%
Rent to Value Ratio
Active
$100,000
bds
|
0
ba
|
0
sqft
|
built
1928
7115 S Yale Ave, Chicago, IL 60621
$334
Cash flow
17.4%
Cash-on-Cash Return
9.7%
Cap rate
1.6%
Rent to Value Ratio
Active
$190,000
3
bds
|
1
ba
|
1,185
sqft
|
built
1950
580 Hirsch Ave, Calumet City, IL 60409
$212
Cash flow
5.8%
Cash-on-Cash Return
7.0%
Cap rate
1.1%
Rent to Value Ratio
Active
$114,900
2
bds
|
2
ba
|
1,284
sqft
|
built
1924
13346 Irving Ave, Blue Island, IL 60406
$634
Cash flow
28.8%
Cash-on-Cash Return
12.3%
Cap rate
1.9%
Rent to Value Ratio
Active
$269,900
3
bds
|
2
ba
|
1,678
sqft
|
built
1955
15501 Rose Dr, South Holland, IL 60473
$485
Cash flow
9.4%
Cash-on-Cash Return
7.8%
Cap rate
1.1%
Rent to Value Ratio
Active
$224,900
3
bds
|
2
ba
|
1,046
sqft
|
built
1956
8909 S Greenwood Ave, Chicago, IL 60619
$-68
Cash flow
-1.6%
Cash-on-Cash Return
5.3%
Cap rate
0.8%
Rent to Value Ratio
Active
$399,999
3
bds
|
2
ba
|
1,500
sqft
|
built
1927
3213 S Keeler Ave, Chicago, IL 60623
$-986
Cash flow
-12.9%
Cash-on-Cash Return
2.7%
Cap rate
0.5%
Rent to Value Ratio
Active
$595,000
3
bds
|
2
ba
|
0
sqft
|
built
1920
758 N Larrabee St, Chicago, IL 60654
$-2,407
Cash flow
-21.1%
Cash-on-Cash Return
0.8%
Cap rate
0.5%
Rent to Value Ratio
Active
$279,000
3
bds
|
3
ba
|
1,667
sqft
|
built
1963
18745 Queens Rd, Homewood, IL 60430
$-9
Cash flow
-0.2%
Cash-on-Cash Return
5.6%
Cap rate
1.0%
Rent to Value Ratio
Active
$489,900
4
bds
|
4
ba
|
2,500
sqft
|
built
1977
7332 Beloit Ave, Bridgeview, IL 60455
$-813
Cash flow
-8.7%
Cash-on-Cash Return
3.7%
Cap rate
0.6%
Rent to Value Ratio
Active
$1,639,000
4
bds
|
6
ba
|
5,892
sqft
|
built
2006
901 Pontiac Rd, Wilmette, IL 60091
$-4,981
Cash flow
-15.9%
Cash-on-Cash Return
2.0%
Cap rate
0.4%
Rent to Value Ratio