Cook County Investment Properties for Sale
Browse homes for sale and investment properties in Cook County. Refine your search by price, property type, or more.
Best cash flowing properties in Cook County
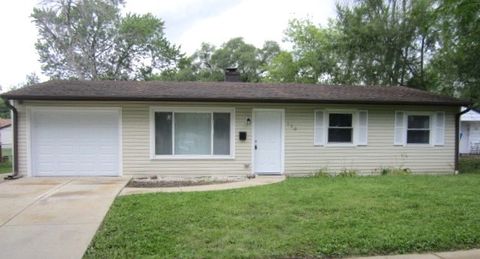
Active
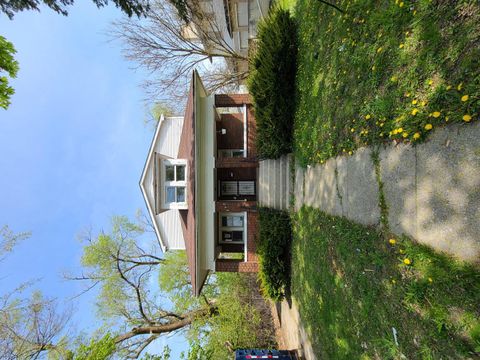
$62,000
4
bds
|
3
ba
|
2,000
sqft
|
built
1925
147 W 150th St, Harvey, IL 60426
$1,122
Cash flow
21.1%
Cash-on-Cash Return
21.7%
Cap rate
4.0%
Rent to Value Ratio
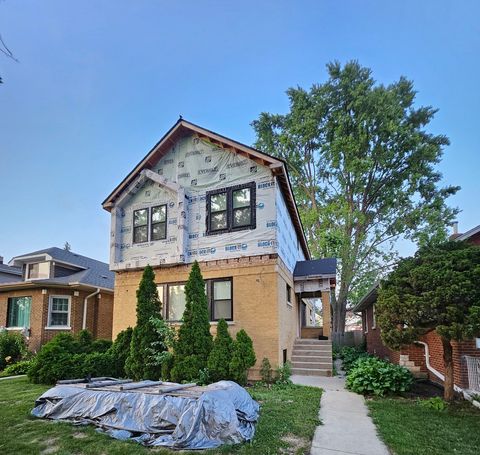
Active
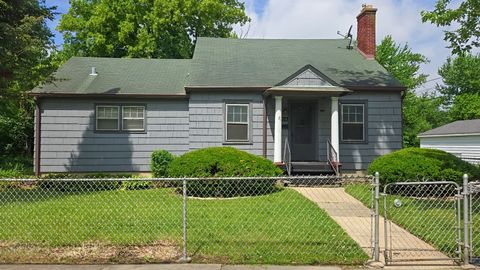
$104,900
3
bds
|
2
ba
|
1,818
sqft
|
built
1934
14924 Riverside Dr, South Holland, IL 60473
$1,040
Cash flow
51.7%
Cash-on-Cash Return
17.6%
Cap rate
2.4%
Rent to Value Ratio
5,381 out of 6,237 properties for sale in Cook County
Limited Results Shown
Create a free account, or log in to reveal all property listings and enjoy the complete experience.
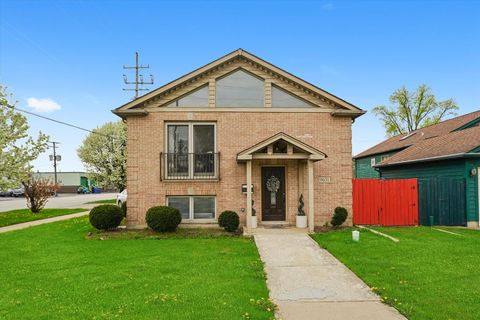
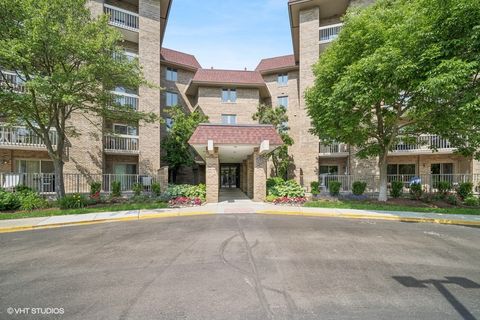
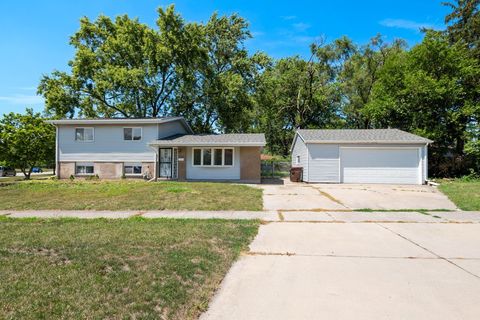
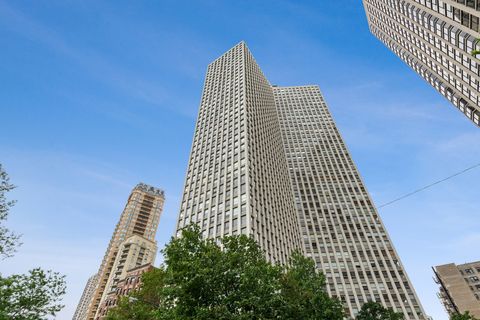
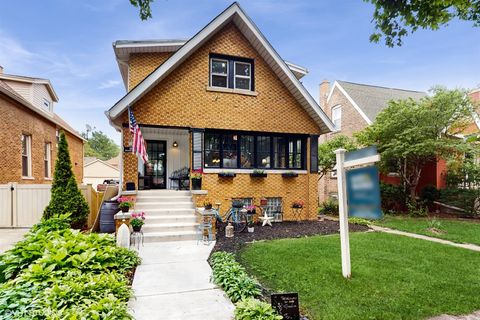
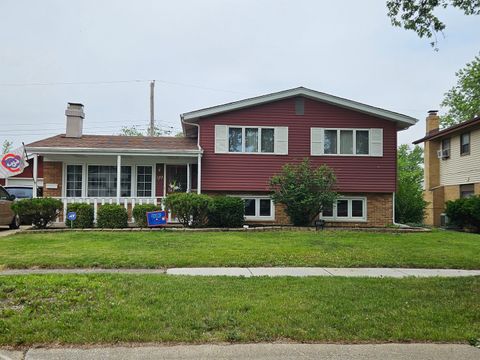
Active
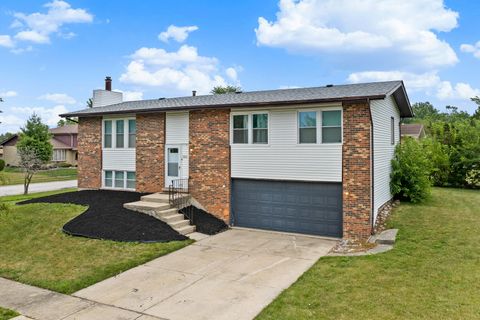
$269,000
3
bds
|
2
ba
|
1,983
sqft
|
built
1975
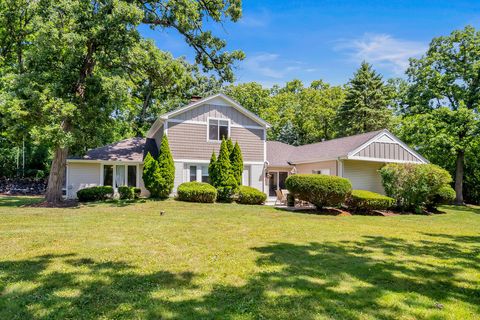
3111 Smoke Tree Ct, Hazel Crest, IL 60429
$-445
Cash flow
-8.6%
Cash-on-Cash Return
3.7%
Cap rate
0.9%
Rent to Value Ratio
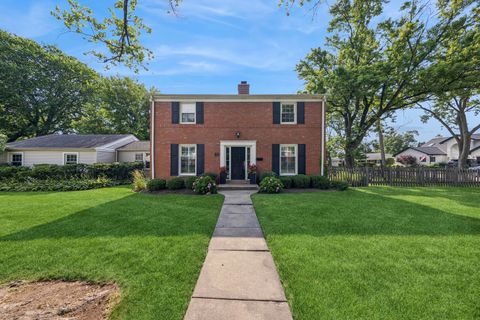
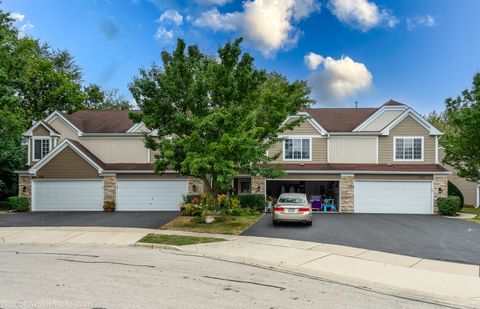
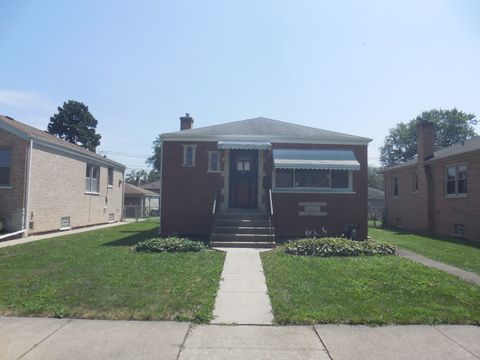
Active
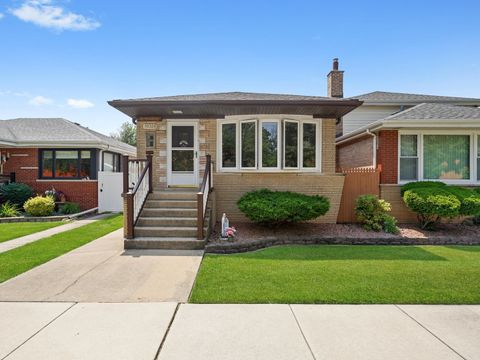
$284,500
3
bds
|
2
ba
|
1,040
sqft
|
built
1962
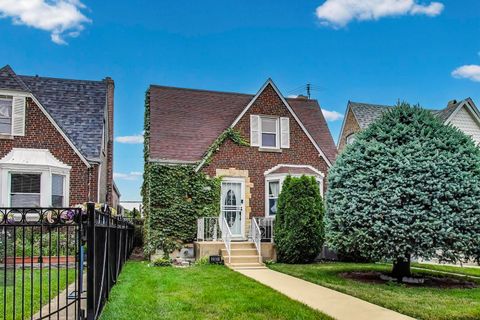
10324 S Sacramento Ave, Chicago, IL 60655
$152
Cash flow
2.8%
Cash-on-Cash Return
6.3%
Cap rate
0.9%
Rent to Value Ratio
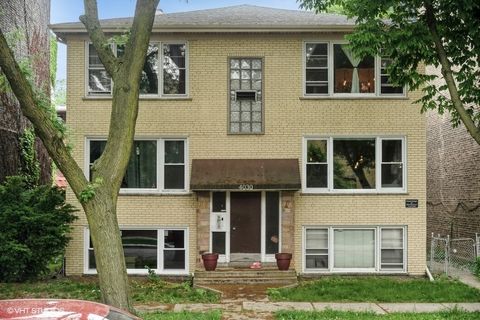
Active
$309,500
4
bds
|
3
ba
|
2,718
sqft
|
built
1898
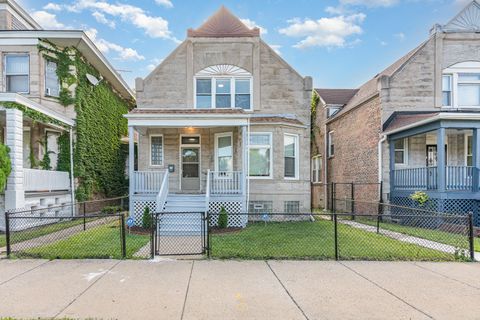
11431 S Indiana Ave, Chicago, IL 60628
$-482
Cash flow
-8.1%
Cash-on-Cash Return
3.8%
Cap rate
0.5%
Rent to Value Ratio
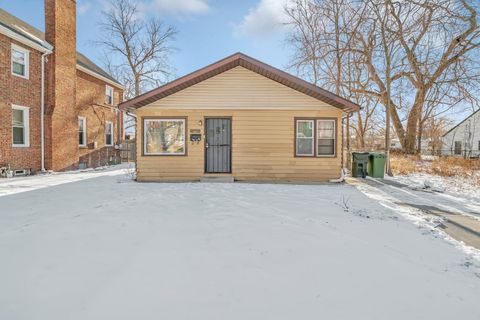
Active
$469,900
3
bds
|
3
ba
|
2,400
sqft
|
built
1938
2921 N Mobile Ave, Chicago, IL 60634
$-209
Cash flow
-2.3%
Cash-on-Cash Return
5.1%
Cap rate
0.8%
Rent to Value Ratio
Active
$71,500
4
bds
|
2
ba
|
0
sqft
|
built
1911
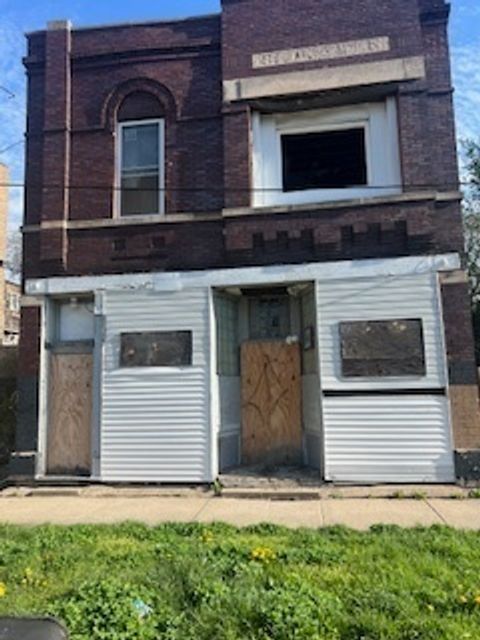
2658 E 78th St, Chicago, IL 60649
$807
Cash flow
13.1%
Cash-on-Cash Return
13.5%
Cap rate
2.0%
Rent to Value Ratio
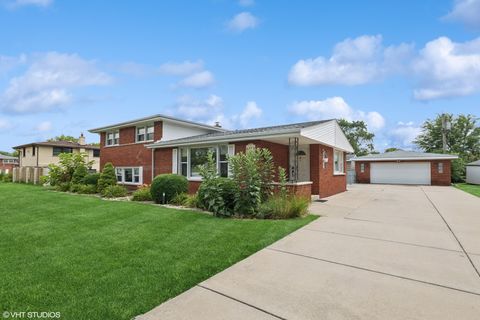
Active
$620,000
4
bds
|
3
ba
|
2,200
sqft
|
built
1946
7900 W 127th St, Palos Park, IL 60464
$-1,291
Cash flow
-10.9%
Cash-on-Cash Return
3.2%
Cap rate
0.5%
Rent to Value Ratio
Active
$429,999
5
bds
|
2
ba
|
1,100
sqft
|
built
1999
9631 Fullerton Ave, Franklin Park, IL 60131
$-642
Cash flow
-7.8%
Cash-on-Cash Return
3.9%
Cap rate
0.7%
Rent to Value Ratio
Active
$1,450,000
4
bds
|
5
ba
|
5,000
sqft
|
built
2002
11735 Orchard Rd, Willow Springs, IL 60480
$-5,179
Cash flow
-18.6%
Cash-on-Cash Return
1.4%
Cap rate
0.4%
Rent to Value Ratio
Active
$450,000
6
bds
|
3
ba
|
0
sqft
|
built
1922
4028 W Crystal St, Chicago, IL 60651
$-964
Cash flow
-11.2%
Cash-on-Cash Return
3.1%
Cap rate
0.6%
Rent to Value Ratio
Active
$160,000
3
bds
|
3
ba
|
3,200
sqft
|
built
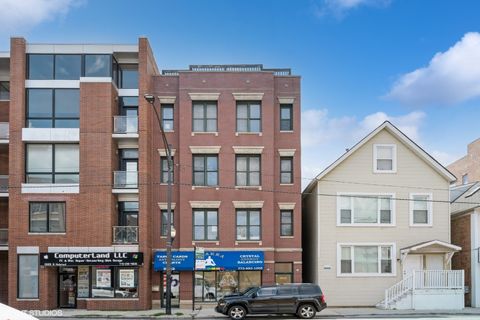
6901 S Oglesby Ave, Chicago, IL 60649
$-1,164
Cash flow
-38.0%
Cash-on-Cash Return
-3.1%
Cap rate
0.9%
Rent to Value Ratio
Active
$1,130,000
5
bds
|
3
ba
|
3,300
sqft
|
built
1887
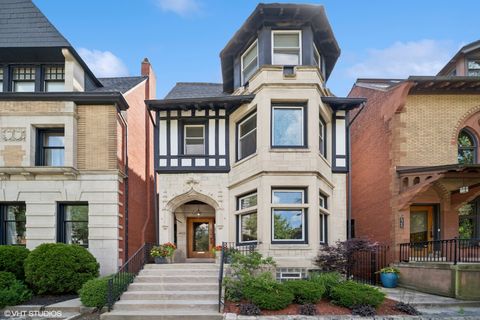
4923 S Blackstone Ave, Chicago, IL 60615
$-2,080
Cash flow
-9.6%
Cash-on-Cash Return
3.5%
Cap rate
0.6%
Rent to Value Ratio
Active
$365,000
2
bds
|
2
ba
|
1,672
sqft
|
built
1980
1280 Rudolph Rd, Northbrook, IL 60062
$-1,330
Cash flow
-19.0%
Cash-on-Cash Return
1.3%
Cap rate
0.7%
Rent to Value Ratio
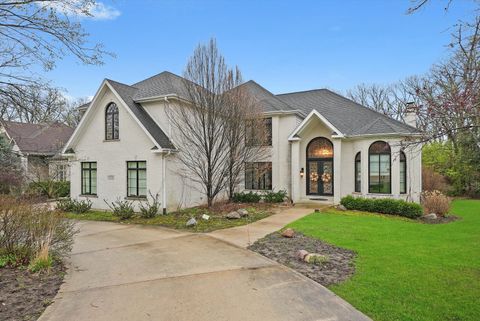
Active
$699,900
3
bds
|
2
ba
|
2,100
sqft
|
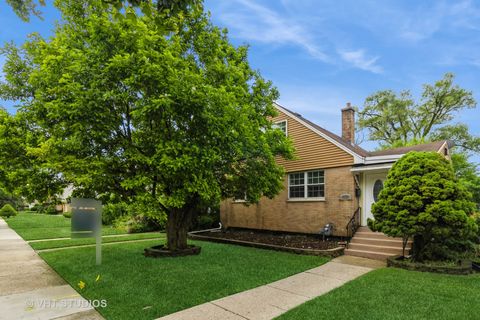
built
1957
2430 Covert Rd, Glenview, IL 60025
$-1,088
Cash flow
-8.1%
Cash-on-Cash Return
3.8%
Cap rate
0.6%
Rent to Value Ratio
Active
$165,000
3
bds
|
2
ba
|
1,209
sqft
|
built
1966
300 Indiana St, Park Forest, IL 60466
$-6
Cash flow
-0.2%
Cash-on-Cash Return
5.6%
Cap rate
1.4%
Rent to Value Ratio
Active
$2,199,000
5
bds
|
4
ba
|
5,112
sqft
|
built
1891
69 E Cedar St, Chicago, IL 60611
$-6,498
Cash flow
-15.4%
Cash-on-Cash Return
2.1%
Cap rate
0.5%
Rent to Value Ratio
Active
$250,000
1
bds
|
1
ba
|
750
sqft
|
built
1971
1636 N Wells St, Chicago, IL 60614
$-685
Cash flow
-14.3%
Cash-on-Cash Return
2.4%
Cap rate
1.0%
Rent to Value Ratio
Active
$199,900
2
bds
|
2
ba
|
1,250
sqft
|
built
1980
9132 S Pulaski Rd, Oak Lawn, IL 60453
$-121
Cash flow
-3.2%
Cash-on-Cash Return
5.0%
Cap rate
1.0%
Rent to Value Ratio
Active
$247,000
2
bds
|
1
ba
|
0
sqft
|
built
1937
14612 Kolmar Ave, Midlothian, IL 60445
$-357
Cash flow
-7.5%
Cash-on-Cash Return
3.9%
Cap rate
0.8%
Rent to Value Ratio
Active
$299,000
3
bds
|
1
ba
|
1,018
sqft
|
built
1962
120 S Chestnut Dr, Streamwood, IL 60107
$-262
Cash flow
-4.6%
Cash-on-Cash Return
4.6%
Cap rate
0.8%
Rent to Value Ratio
Active
$415,000
4
bds
|
3
ba
|
2,493
sqft
|
built
1926
2035 S 11th Ave, Maywood, IL 60153
$318
Cash flow
4.0%
Cash-on-Cash Return
6.6%
Cap rate
1.1%
Rent to Value Ratio
Active
$550,000
3
bds
|
3
ba
|
1,490
sqft
|
built
1968
2626 N Lakeview Ave, Chicago, IL 60614
$-2,677
Cash flow
-25.4%
Cash-on-Cash Return
-0.2%
Cap rate
0.7%
Rent to Value Ratio
Active
$329,900
2
bds
|
3
ba
|
1,547
sqft
|
built
1995
434 Locksley Dr, Streamwood, IL 60107
$-707
Cash flow
-11.2%
Cash-on-Cash Return
3.1%
Cap rate
0.8%
Rent to Value Ratio
Active
$459,000
5
bds
|
2
ba
|
2,352
sqft
|
built
1901
10829 S Maplewood Ave, Chicago, IL 60655
$-471
Cash flow
-5.4%
Cash-on-Cash Return
4.4%
Cap rate
0.6%
Rent to Value Ratio
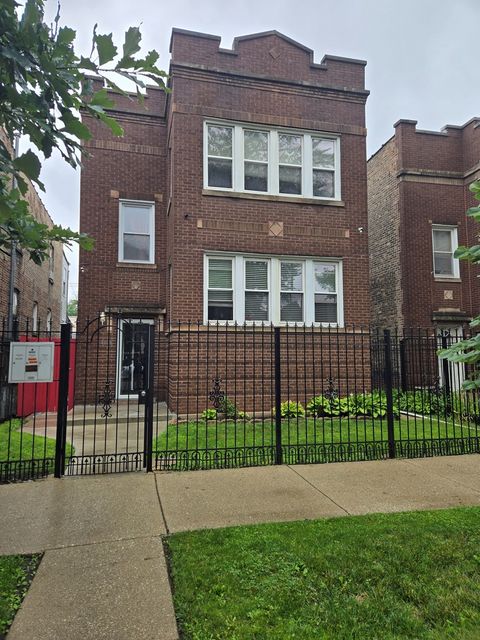
Active
$231,500
2
bds
|
1
ba
|
1,100
sqft
|
built
1961
4030 N Mozart St, Chicago, IL 60618
$-590
Cash flow
-13.3%
Cash-on-Cash Return
2.6%
Cap rate
0.7%
Rent to Value Ratio
Active
$135,000
3
bds
|
1
ba
|
1,000
sqft
|
built
1956
14745 Princeton Ave, Dolton, IL 60419
$395
Cash flow
15.3%
Cash-on-Cash Return
9.2%
Cap rate
1.9%
Rent to Value Ratio
Active
$375,000
3
bds
|
2
ba
|
1,244
sqft
|
built
1960
6313 W 89th Pl, Oak Lawn, IL 60453
$-323
Cash flow
-4.5%
Cash-on-Cash Return
4.6%
Cap rate
0.8%
Rent to Value Ratio
Active
$749,000
3
bds
|
2
ba
|
2,000
sqft
|
built
1997
2632 N Halsted St, Chicago, IL 60614
$-1,498
Cash flow
-10.4%
Cash-on-Cash Return
3.3%
Cap rate
0.6%
Rent to Value Ratio
Active
$439,000
3
bds
|
2
ba
|
1,500
sqft
|
built
1952
5037 Fargo Ave, Skokie, IL 60077
$-365
Cash flow
-4.3%
Cash-on-Cash Return
4.7%
Cap rate
0.8%
Rent to Value Ratio
Active
$1,100,000
8
bds
|
3
ba
|
0
sqft
|
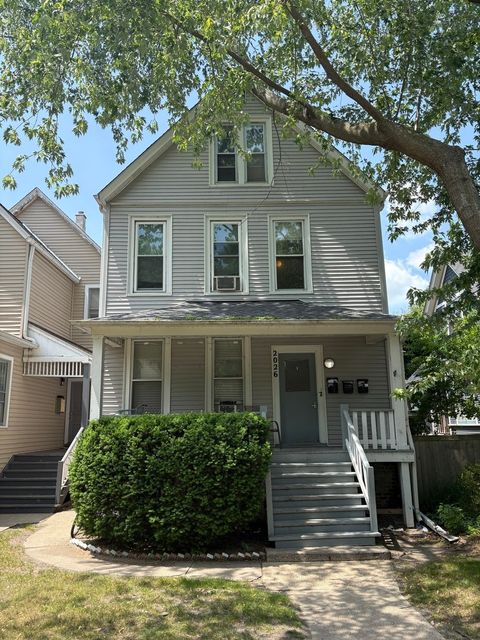
built
1881
2026 Maple Ave, Evanston, IL 60201
$-3,462
Cash flow
-16.4%
Cash-on-Cash Return
1.9%
Cap rate
0.4%
Rent to Value Ratio
Active
$349,900
3
bds
|
2
ba
|
1,485
sqft
|
built
1948
439 Morris Ave, Bellwood, IL 60104
$-672
Cash flow
-10.0%
Cash-on-Cash Return
3.4%
Cap rate
0.7%
Rent to Value Ratio
Active
$210,000
3
bds
|
2
ba
|
1,324
sqft
|
built
1962
172 N Floyd Ln, Chicago Heights, IL 60411
$9
Cash flow
0.2%
Cash-on-Cash Return
5.7%
Cap rate
1.1%
Rent to Value Ratio
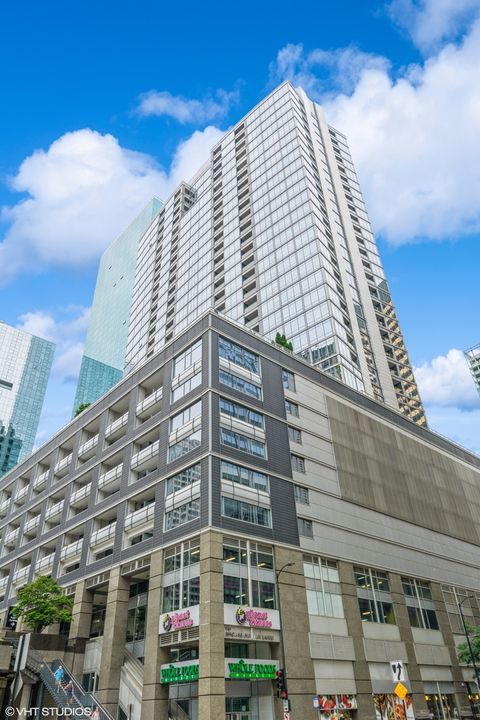
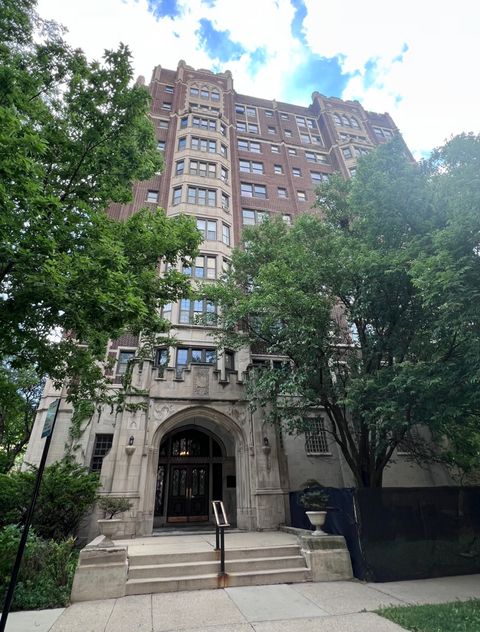
Active
$425,000
1
bds
|
1
ba
|
933
sqft
|
built
2006
240 E Illinois St, Chicago, IL 60611
$-1,343
Cash flow
-16.5%
Cash-on-Cash Return
1.9%
Cap rate
0.8%
Rent to Value Ratio
Active
$172,500
2
bds
|
2
ba
|
846
sqft
|
built
1950
3416 Monroe St, Bellwood, IL 60104
$112
Cash flow
3.4%
Cash-on-Cash Return
6.5%
Cap rate
1.3%
Rent to Value Ratio
Active
$245,000
3
bds
|
2
ba
|
0
sqft
|
built
1966
15120 Hamlin Ave, Midlothian, IL 60445
$71
Cash flow
1.5%
Cash-on-Cash Return
6.0%
Cap rate
1.0%
Rent to Value Ratio
Active
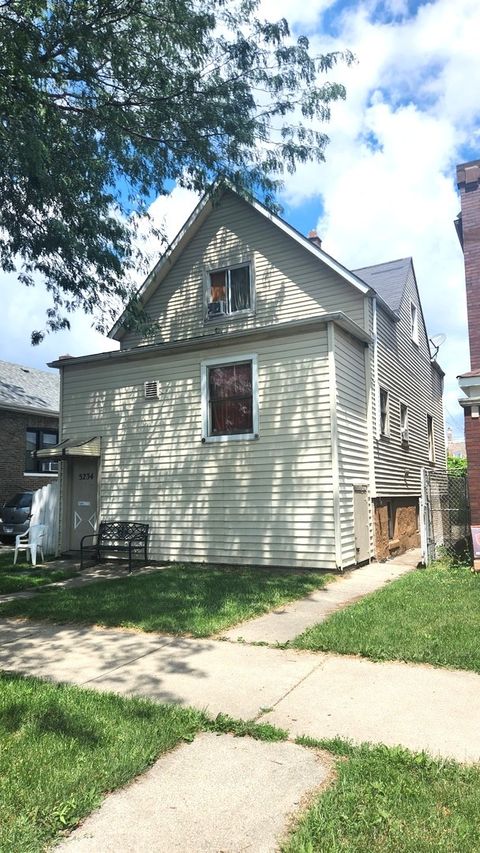
$199,000
3
bds
|
4
ba
|
1,353
sqft
|
built
1911
5234 W 25th Pl, Cicero, IL 60804
$576
Cash flow
15.1%
Cash-on-Cash Return
9.2%
Cap rate
1.1%
Rent to Value Ratio
Active
$449,900
3
bds
|
2
ba
|
1,744
sqft
|
built
1958
8226 Kenton Ave, Skokie, IL 60076
$-892
Cash flow
-10.3%
Cash-on-Cash Return
3.3%
Cap rate
0.7%
Rent to Value Ratio
Active
$318,990
4
bds
|
2
ba
|
1,016
sqft
|
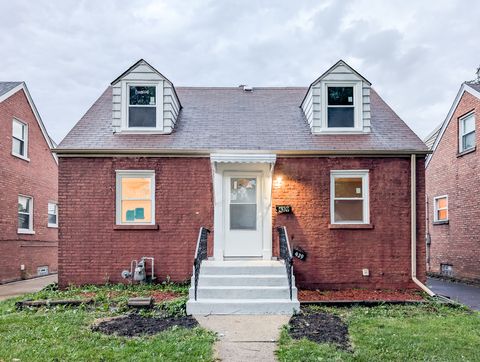
built
1926
7240 S Oakley Ave, Chicago, IL 60636
$-548
Cash flow
-9.0%
Cash-on-Cash Return
3.6%
Cap rate
0.5%
Rent to Value Ratio
Active
$575,000
4
bds
|
3
ba
|
0
sqft
|
built
1916
7223 N Damen Ave, Chicago, IL 60645
$-1,574
Cash flow
-14.3%
Cash-on-Cash Return
2.4%
Cap rate
0.4%
Rent to Value Ratio