Cook County Investment Properties for Sale
Browse homes for sale and investment properties in Cook County. Refine your search by price, property type, or more.
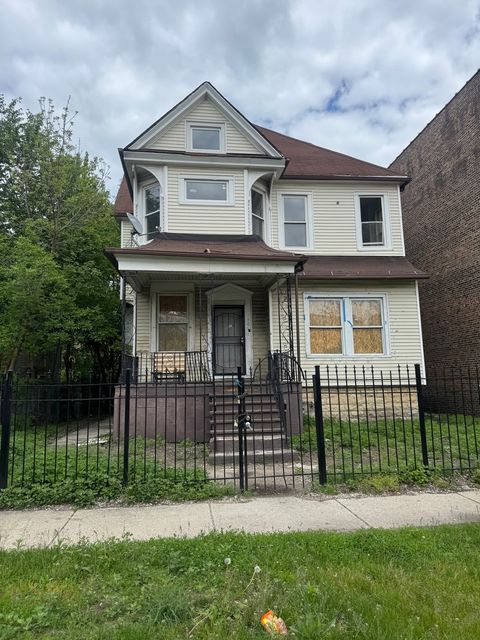
Best cash flowing properties in Cook County
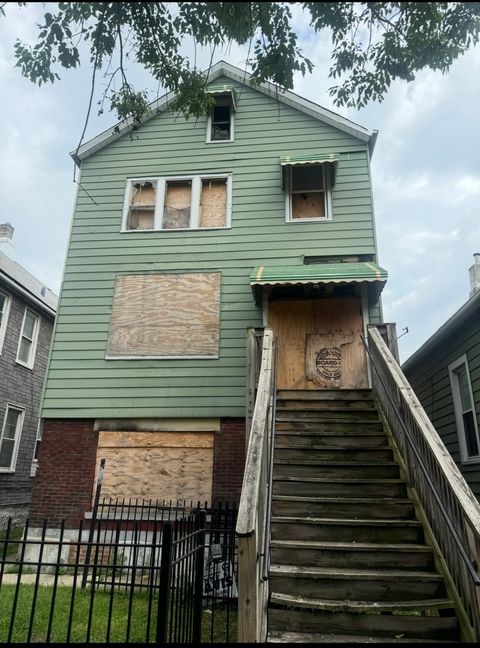
Active
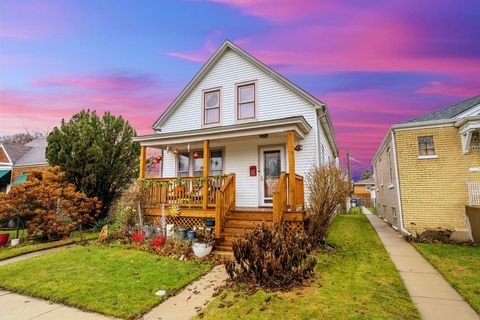
$100,000
9
bds
|
3
ba
|
0
sqft
|
built
1888
5427 S Princeton Ave, Chicago, IL 60609
$1,353
Cash flow
70.6%
Cash-on-Cash Return
21.9%
Cap rate
2.8%
Rent to Value Ratio
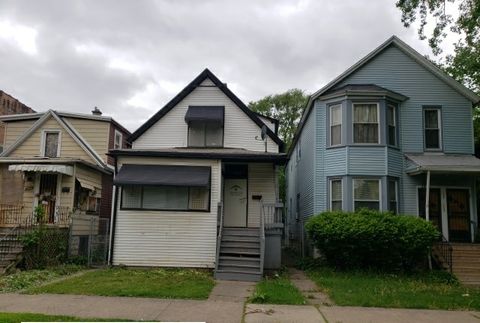
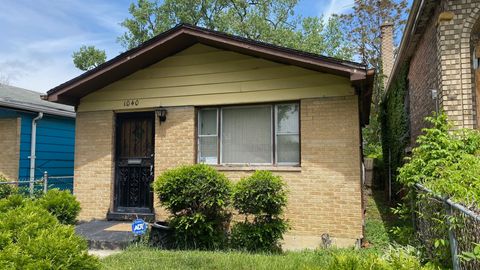
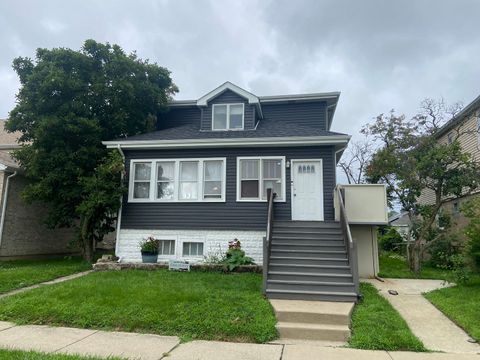
Active
$66,900
4
bds
|
2
ba
|
1,248
sqft
|
built
1898
11842 S State St, Chicago, IL 60628
$1,336
Cash flow
23.3%
Cash-on-Cash Return
24.0%
Cap rate
3.0%
Rent to Value Ratio
4,506 out of 5,249 properties for sale in Cook County
Limited Results Shown
Create a free account, or log in to reveal all property listings and enjoy the complete experience.
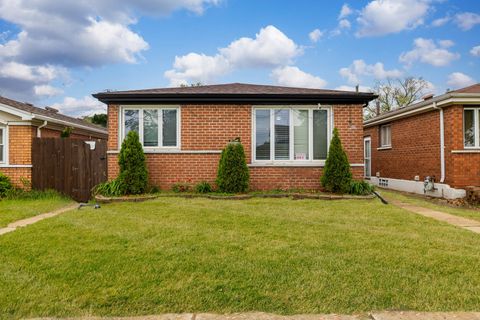
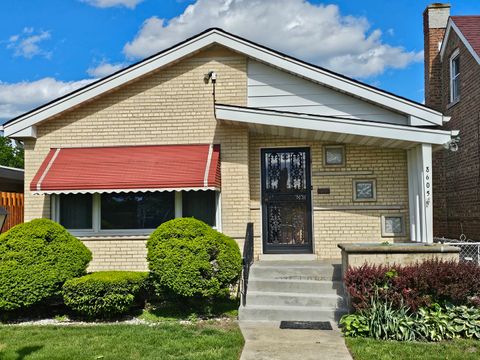
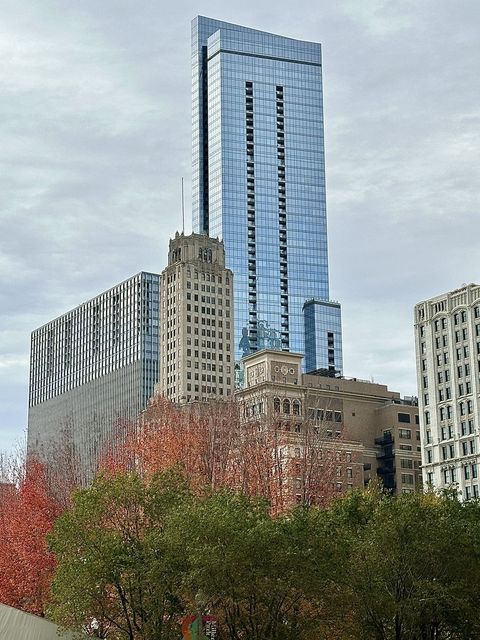
Active
$240,000
3
bds
|
1
ba
|
1,066
sqft
|
built
1963
2816 E 127th St, Chicago, IL 60633
$56
Cash flow
1.2%
Cash-on-Cash Return
6.0%
Cap rate
0.8%
Rent to Value Ratio
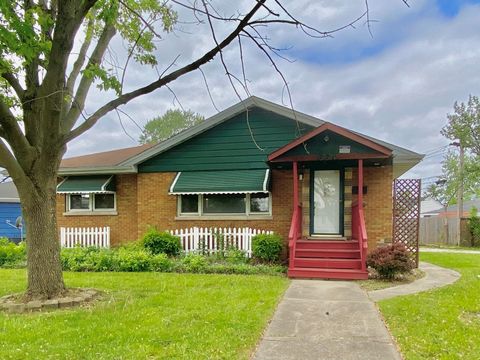
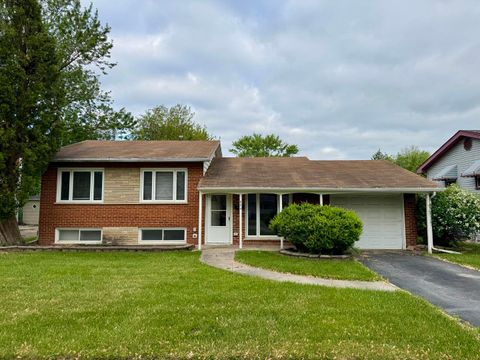
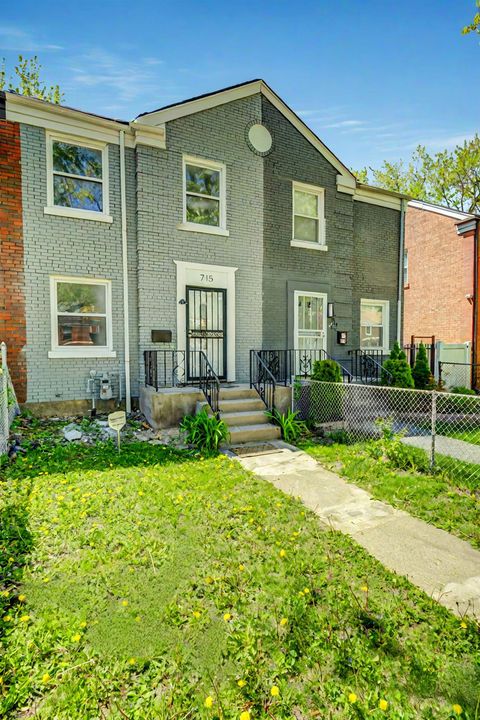
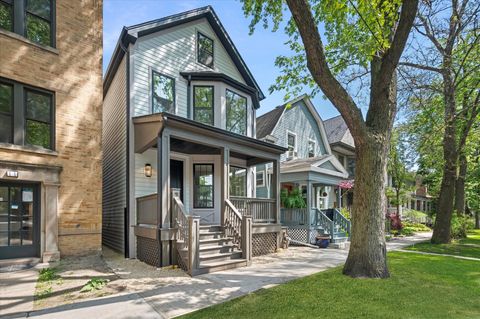
Active
$198,000
3
bds
|
2
ba
|
1,170
sqft
|
built
1957
664 E 163rd St, South Holland, IL 60473
$195
Cash flow
5.1%
Cash-on-Cash Return
6.9%
Cap rate
1.3%
Rent to Value Ratio
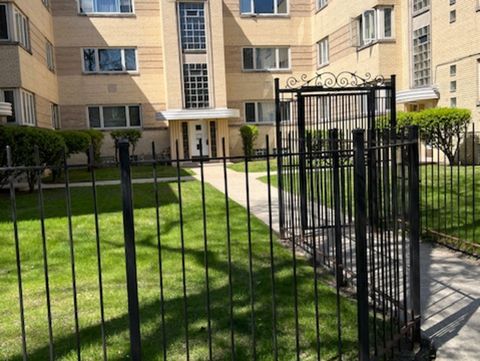
Active
$220,000
1
bds
|
1
ba
|
790
sqft
|
built
1960
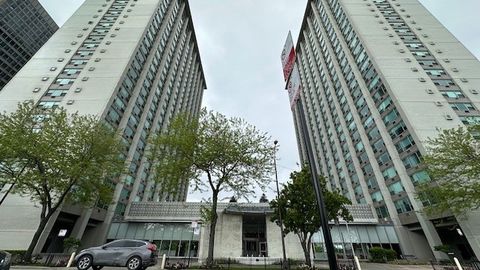
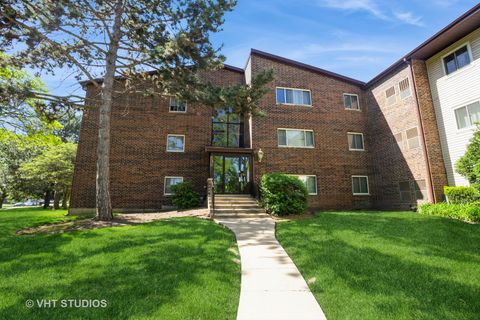
3600 N Lake Shore Dr, Chicago, IL 60613
$-630
Cash flow
-14.9%
Cash-on-Cash Return
2.2%
Cap rate
0.9%
Rent to Value Ratio
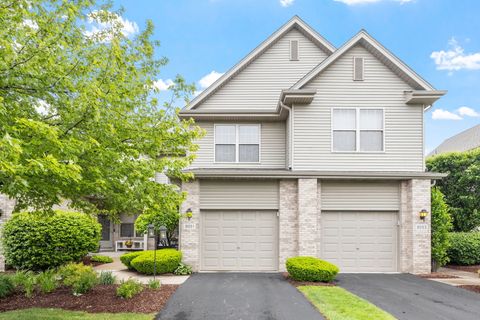
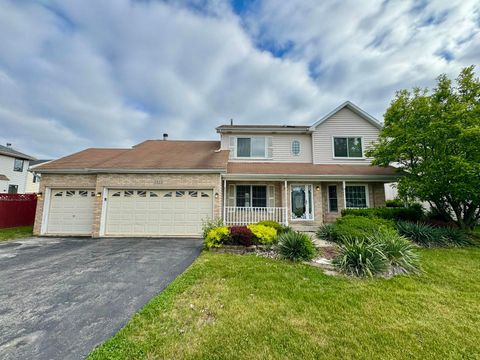
Active
$329,900
3
bds
|
4
ba
|
1,695
sqft
|
built
1998
9051 Mansfield Dr, Tinley Park, IL 60487
$-252
Cash flow
-4.0%
Cash-on-Cash Return
4.8%
Cap rate
0.8%
Rent to Value Ratio
Active
$150,000
7
bds
|
2
ba
|
2,800
sqft
|
built
1896
7051 S Princeton Ave, Chicago, IL 60621
$1,113
Cash flow
38.7%
Cash-on-Cash Return
14.6%
Cap rate
1.9%
Rent to Value Ratio
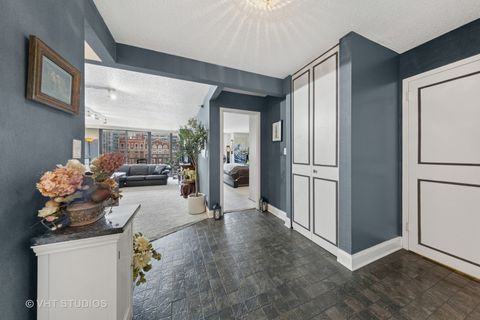
Active
$289,000
1
bds
|
1
ba
|
845
sqft
|
built
1981
10 E Ontario St, Chicago, IL 60611
$-1,107
Cash flow
-20.0%
Cash-on-Cash Return
1.1%
Cap rate
0.8%
Rent to Value Ratio
Active
$318,000
3
bds
|
3
ba
|
1,972
sqft
|
built
1994
5522 Mallard Dr, Matteson, IL 60443
$-506
Cash flow
-8.3%
Cash-on-Cash Return
3.8%
Cap rate
0.9%
Rent to Value Ratio
Active
$175,000
5
bds
|
2
ba
|
2,100
sqft
|
built
1954
17231 Laflin Ave, East Hazel Crest, IL 60429
$152
Cash flow
4.5%
Cash-on-Cash Return
6.7%
Cap rate
1.3%
Rent to Value Ratio
Active
$211,000
3
bds
|
3
ba
|
1,044
sqft
|
built
1961
824 Dartmouth Ave, Matteson, IL 60443
$150
Cash flow
3.7%
Cash-on-Cash Return
6.5%
Cap rate
1.1%
Rent to Value Ratio
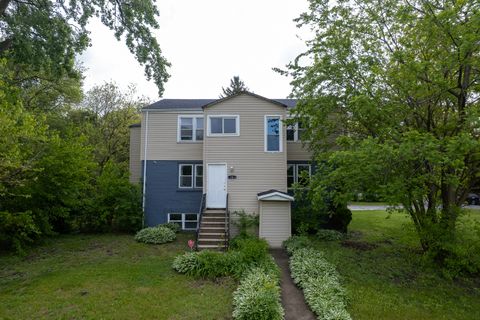
Active
$135,000
3
bds
|
2
ba
|
1,159
sqft
|
built
1972
1040 W 104th St, Chicago, IL 60643
$673
Cash flow
26.0%
Cash-on-Cash Return
11.7%
Cap rate
1.6%
Rent to Value Ratio
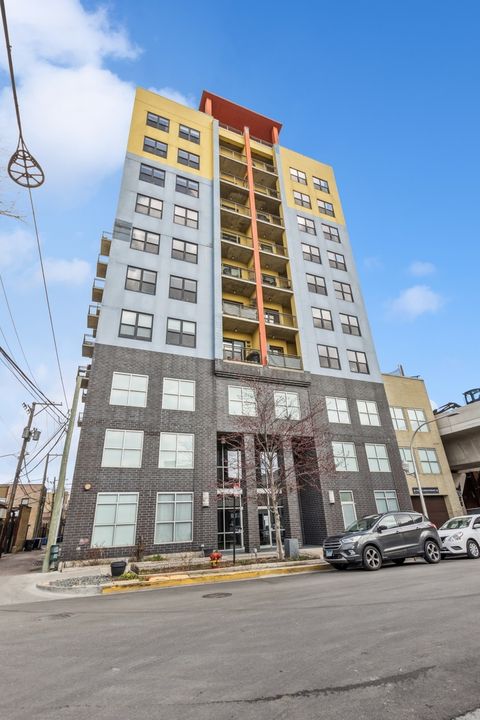
Active
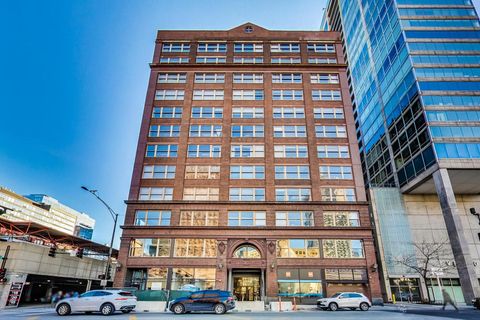
$379,000
2
bds
|
2
ba
|
1,450
sqft
|
built
1904
161 W Harrison St, Chicago, IL 60605
$-1,086
Cash flow
-15.0%
Cash-on-Cash Return
2.2%
Cap rate
0.7%
Rent to Value Ratio
Active
$310,000
3
bds
|
2
ba
|
900
sqft
|
built
1962
2311 N Natchez Ave, Chicago, IL 60707
$205
Cash flow
3.5%
Cash-on-Cash Return
6.5%
Cap rate
0.9%
Rent to Value Ratio
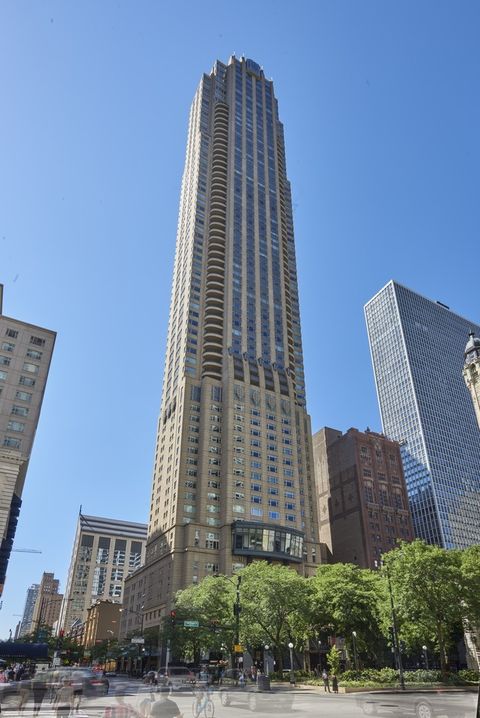
Active
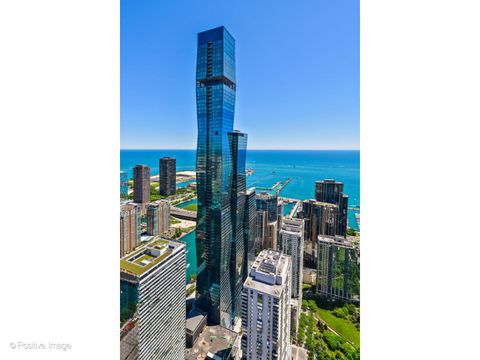
$875,000
2
bds
|
3
ba
|
2,000
sqft
|
built
2000
800 N Michigan Ave, Chicago, IL 60611
$-3,489
Cash flow
-20.8%
Cash-on-Cash Return
0.9%
Cap rate
0.7%
Rent to Value Ratio
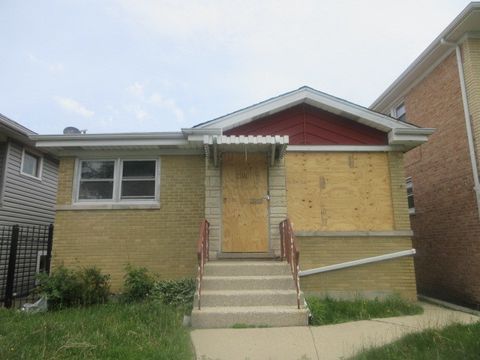
Active
$169,000
2
bds
|
1
ba
|
0
sqft
|
built
1942
715 E 105th Pl, Chicago, IL 60628
$107
Cash flow
3.3%
Cash-on-Cash Return
6.4%
Cap rate
0.8%
Rent to Value Ratio
Active
$1,475,000
4
bds
|
4
ba
|
3,824
sqft
|
built
1950
1343 N Sutton Pl, Chicago, IL 60610
$-4,822
Cash flow
-17.1%
Cash-on-Cash Return
1.8%
Cap rate
0.5%
Rent to Value Ratio
Active
$365,000
3
bds
|
1
ba
|
1,315
sqft
|
built
1962
5108 S Massasoit Ave, Chicago, IL 60638
$-266
Cash flow
-3.8%
Cash-on-Cash Return
4.8%
Cap rate
0.7%
Rent to Value Ratio
Active
$179,000
3
bds
|
2
ba
|
0
sqft
|
built
1962
3724 W 135th St, Robbins, IL 60472
$-561
Cash flow
-16.4%
Cash-on-Cash Return
1.9%
Cap rate
0.8%
Rent to Value Ratio
Active
$405,000
2
bds
|
2
ba
|
1,404
sqft
|
built
2000
5555 N Cumberland Ave, Chicago, IL 60656
$-1,333
Cash flow
-17.2%
Cash-on-Cash Return
1.7%
Cap rate
0.5%
Rent to Value Ratio
Active
$249,900
3
bds
|
2
ba
|
2,739
sqft
|
built
1961
8605 S Calumet Ave, Chicago, IL 60619
$358
Cash flow
7.5%
Cash-on-Cash Return
7.4%
Cap rate
1.0%
Rent to Value Ratio
Active
$109,500
2
bds
|
1
ba
|
900
sqft
|
built
1946
2030 E 72nd Pl, Chicago, IL 60649
$81
Cash flow
3.9%
Cash-on-Cash Return
6.6%
Cap rate
1.4%
Rent to Value Ratio
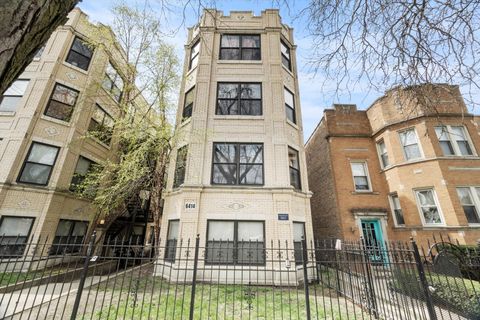
Active
$299,900
3
bds
|
2
ba
|
1,300
sqft
|
built
1920
6414 N Hoyne Ave, Chicago, IL 60645
$-373
Cash flow
-6.5%
Cash-on-Cash Return
4.2%
Cap rate
0.7%
Rent to Value Ratio
Active
$219,999
1
bds
|
1
ba
|
0
sqft
|
built
2007
1122 W Catalpa Ave, Chicago, IL 60640
$-808
Cash flow
-19.2%
Cash-on-Cash Return
1.3%
Cap rate
0.9%
Rent to Value Ratio
Active
$179,900
3
bds
|
1
ba
|
1,321
sqft
|
built
1898
12850 Lincoln St, Blue Island, IL 60406
$570
Cash flow
16.5%
Cash-on-Cash Return
9.5%
Cap rate
1.3%
Rent to Value Ratio
Active
$345,500
4
bds
|
3
ba
|
2,325
sqft
|
built
1927
6432 41st St, Stickney, IL 60402
$-270
Cash flow
-4.1%
Cash-on-Cash Return
4.7%
Cap rate
0.8%
Rent to Value Ratio
Active
$1,199,000
2
bds
|
3
ba
|
1,999
sqft
|
built
2009
60 E Monroe St, Chicago, IL 60603
$-5,928
Cash flow
-25.8%
Cash-on-Cash Return
-0.3%
Cap rate
0.5%
Rent to Value Ratio

Active
$354,900
2
bds
|
2
ba
|
1,350
sqft
|
built
1969
5445 N Sheridan Rd, Chicago, IL 60640
$-1,368
Cash flow
-20.1%
Cash-on-Cash Return
1.1%
Cap rate
0.6%
Rent to Value Ratio
Active
$1,190,000
5
bds
|
4
ba
|
3,392
sqft
|
built
1903
1542 W Highland Ave, Chicago, IL 60660
$-4,990
Cash flow
-21.9%
Cash-on-Cash Return
0.6%
Cap rate
0.2%
Rent to Value Ratio
Active
$109,900
2
bds
|
2
ba
|
1,300
sqft
|
built
1965
914 N Austin Blvd, Oak Park, IL 60302
$72
Cash flow
3.4%
Cash-on-Cash Return
6.5%
Cap rate
1.8%
Rent to Value Ratio
Active
$189,900
3
bds
|
1
ba
|
1,281
sqft
|
built
1956
3225 Otto St, Lansing, IL 60438
$362
Cash flow
9.9%
Cash-on-Cash Return
8.0%
Cap rate
1.2%
Rent to Value Ratio
Active
$1,950,000
6
bds
|
5
ba
|
4,700
sqft
|
built
1890
4801 S Kimbark Ave, Chicago, IL 60615
$-6,535
Cash flow
-17.5%
Cash-on-Cash Return
1.7%
Cap rate
0.3%
Rent to Value Ratio
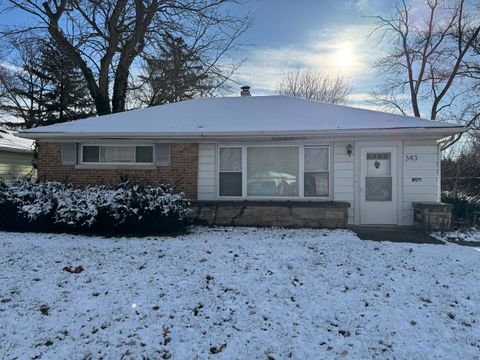
Active
$150,000
2
bds
|
2
ba
|
1,319
sqft
|
built
1951
343 Indianwood Blvd, Park Forest, IL 60466
$-123
Cash flow
-4.3%
Cash-on-Cash Return
4.7%
Cap rate
1.3%
Rent to Value Ratio
Active
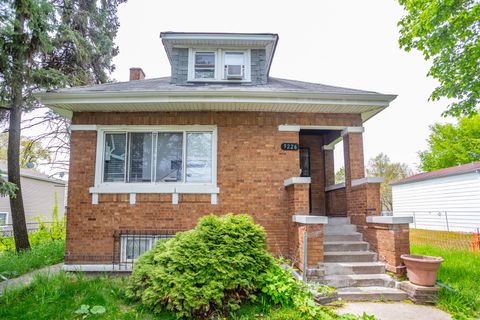
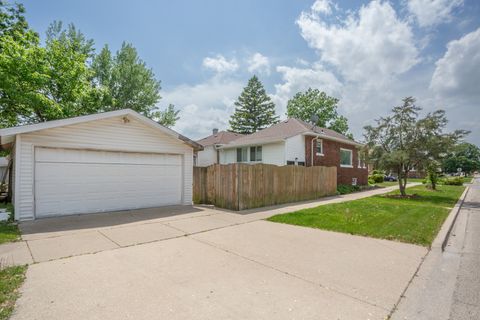
$297,000
4
bds
|
2
ba
|
2,360
sqft
|
built
1927
9226 S Ellis Ave, Chicago, IL 60619
$-180
Cash flow
-3.2%
Cash-on-Cash Return
4.9%
Cap rate
0.7%
Rent to Value Ratio
Active
$255,000
2
bds
|
2
ba
|
1,724
sqft
|
built
1926
2101 S 7th Ave, Maywood, IL 60153
$-325
Cash flow
-6.6%
Cash-on-Cash Return
4.2%
Cap rate
0.9%
Rent to Value Ratio
Active
$360,000
1
bds
|
1
ba
|
933
sqft
|
built
2006
240 E Illinois St, Chicago, IL 60611
$-1,226
Cash flow
-17.8%
Cash-on-Cash Return
1.6%
Cap rate
0.8%
Rent to Value Ratio
Active
$830,000
4
bds
|
2
ba
|
1,613
sqft
|
built
1921
421 Leonard St, Park Ridge, IL 60068
$-2,372
Cash flow
-14.9%
Cash-on-Cash Return
2.2%
Cap rate
0.4%
Rent to Value Ratio
Active
$195,000
2
bds
|
1
ba
|
854
sqft
|
built
1978
630 Perrie Dr, Elk Grove Village, IL 60007
$-412
Cash flow
-11.0%
Cash-on-Cash Return
3.1%
Cap rate
0.8%
Rent to Value Ratio
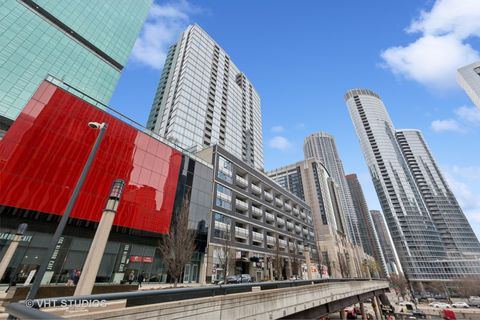
Active
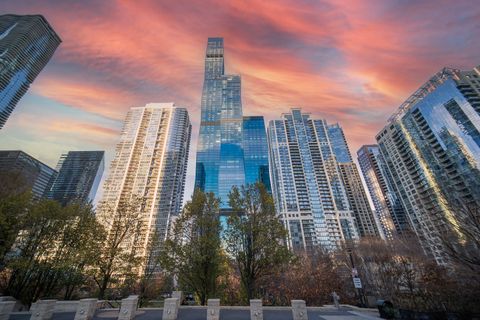
$2,745,000
4
bds
|
5
ba
|
3,500
sqft
|
built
2020
363 E Wacker Dr, Chicago, IL 60601
$-12,934
Cash flow
-24.6%
Cash-on-Cash Return
0.0%
Cap rate
0.4%
Rent to Value Ratio
Active
$1,725,000
3
bds
|
2
ba
|
2,337
sqft
|
built
2021
363 E Wacker Dr, Chicago, IL 60601
$-6,095
Cash flow
-18.4%
Cash-on-Cash Return
1.4%
Cap rate
0.5%
Rent to Value Ratio