Peoria County Investment Properties for Sale
Browse homes for sale and investment properties in Peoria County. Refine your search by price, property type, or more.
Best cash flowing properties in Peoria County
Active
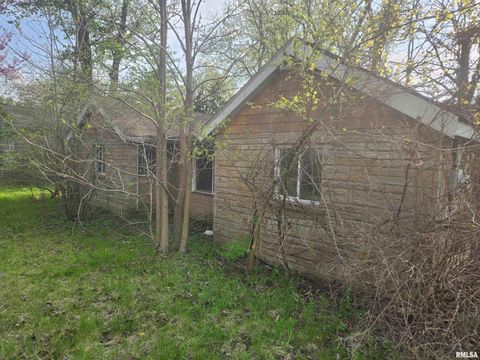
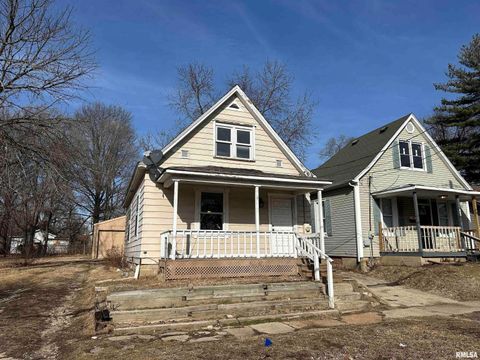
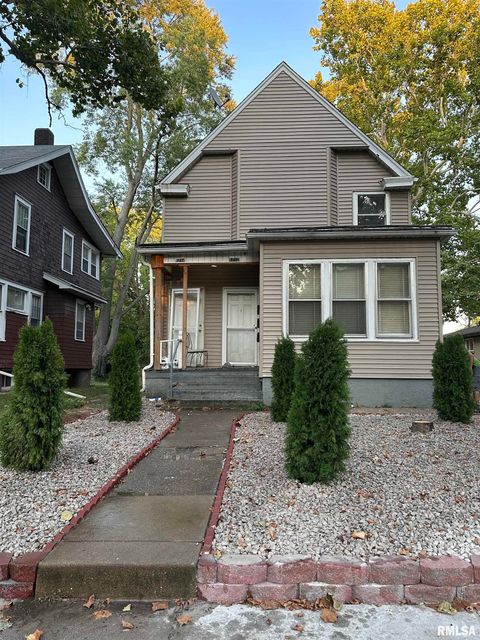
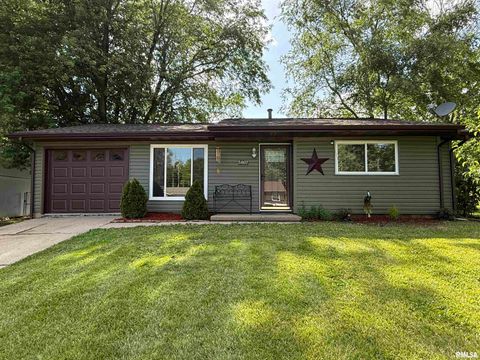
$69,500
3
bds
|
0
ba
|
1,108
sqft
|
built
1949
9915 N Blacksoil Ln, Peoria, IL 61615
$1,033
Cash flow
17.3%
Cash-on-Cash Return
17.8%
Cap rate
2.3%
Rent to Value Ratio
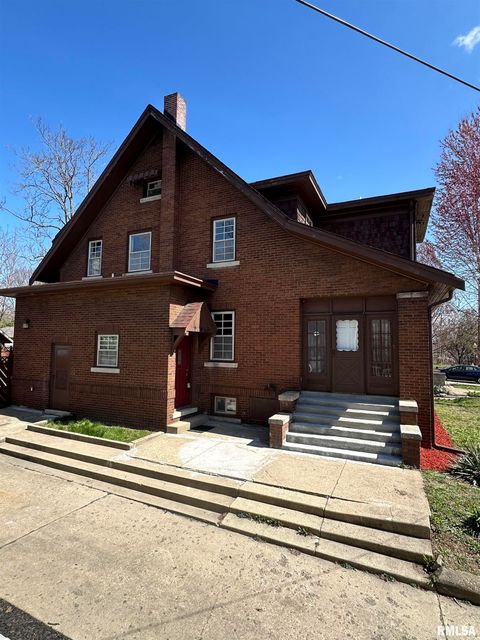
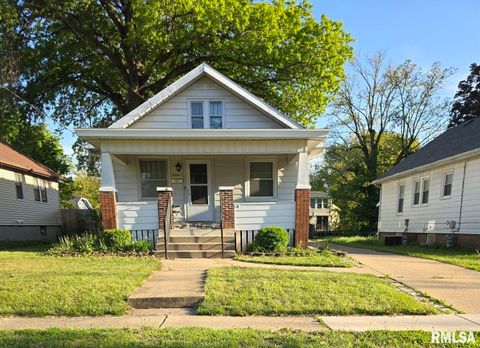
Active
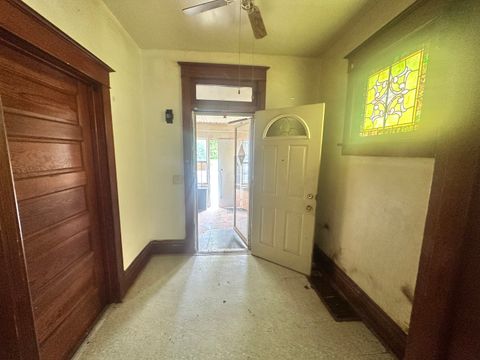
$34,900
2
bds
|
1
ba
|
1,026
sqft
|
built
1906
801 S Warren St, Peoria, IL 61605
$856
Cash flow
28.6%
Cash-on-Cash Return
29.4%
Cap rate
3.7%
Rent to Value Ratio
180 out of 252 properties for sale in Peoria County
Limited Results Shown
Create a free account, or log in to reveal all property listings and enjoy the complete experience.
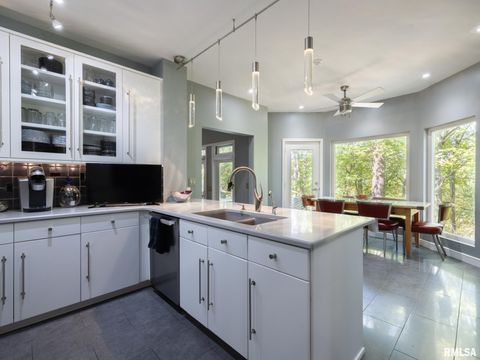
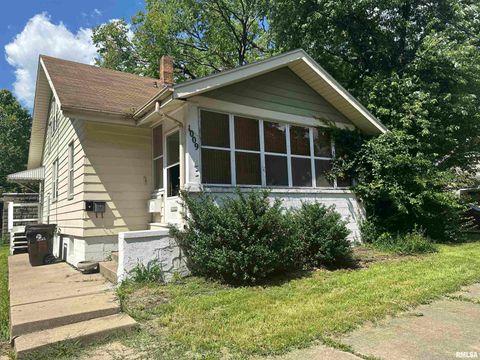
Active
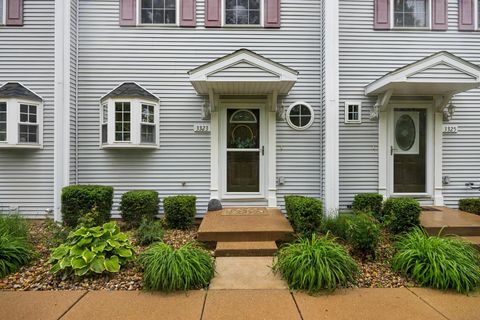
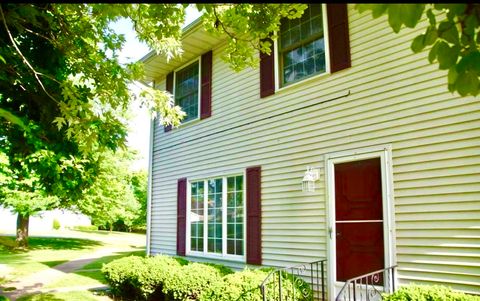
$165,000
2
bds
|
3
ba
|
1,224
sqft
|
built
2005
3323 W King James Rd, Peoria, IL 61615
$-196
Cash flow
-6.2%
Cash-on-Cash Return
4.8%
Cap rate
1.0%
Rent to Value Ratio

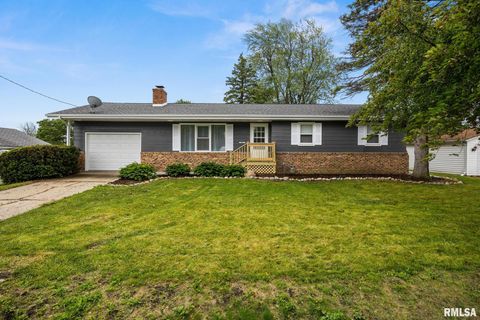
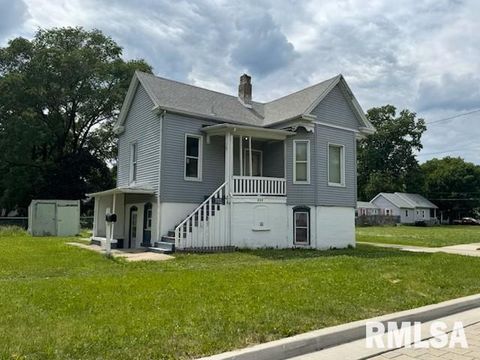
Active
$29,000
3
bds
|
1
ba
|
1,500
sqft
|
built
1906
2324 W Wiswall St, Peoria, IL 61605
$640
Cash flow
25.7%
Cash-on-Cash Return
26.5%
Cap rate
3.4%
Rent to Value Ratio
Active
$164,900
4
bds
|
4
ba
|
2,904
sqft
|
built
1974
4327 W Tara Cir, Peoria, IL 61615
$215
Cash flow
6.8%
Cash-on-Cash Return
7.2%
Cap rate
1.2%
Rent to Value Ratio
Active
$34,900
2
bds
|
1
ba
|
1,026
sqft
|
built
1906
801 S Warren St, Peoria, IL 61605
$856
Cash flow
28.6%
Cash-on-Cash Return
29.4%
Cap rate
3.7%
Rent to Value Ratio

Active
$479,900
4
bds
|
7
ba
|
4,731
sqft
|
built
1978
9825 N Route 91, Peoria, IL 61615
$-1,151
Cash flow
-12.5%
Cash-on-Cash Return
2.8%
Cap rate
0.5%
Rent to Value Ratio

Active
$63,500
2
bds
|
1
ba
|
1,366
sqft
|
built
1920
1216 E Corrington Ave, Peoria, IL 61603
$829
Cash flow
15.2%
Cash-on-Cash Return
15.7%
Cap rate
2.2%
Rent to Value Ratio

Active
$979,900
5
bds
|
6
ba
|
7,544
sqft
|
built
1999
1112 W Cedar Hills Dr, Dunlap, IL 61525
$-4,315
Cash flow
-23.0%
Cash-on-Cash Return
0.4%
Cap rate
0.3%
Rent to Value Ratio

Active
$259,900
2
bds
|
2
ba
|
1,786
sqft
|
built
2005
11525 N Brooklyn Pl, Dunlap, IL 61525
$-322
Cash flow
-6.5%
Cash-on-Cash Return
4.2%
Cap rate
0.8%
Rent to Value Ratio

Active
$45,000
1
bds
|
1
ba
|
440
sqft
|
built
1948
3336 N Sterling Ave, Peoria, IL 61604
$322
Cash flow
8.3%
Cash-on-Cash Return
8.6%
Cap rate
1.3%
Rent to Value Ratio
Active
$69,000
3
bds
|
1
ba
|
1,284
sqft
|
built
1920
1001 W Brons Ave, Peoria, IL 61604
$568
Cash flow
9.6%
Cash-on-Cash Return
9.9%
Cap rate
1.4%
Rent to Value Ratio
Active
$260,000
5
bds
|
4
ba
|
2,741
sqft
|
built
1915
949 NE Glen Oak Ave, Peoria, IL 61603
$-90
Cash flow
-1.8%
Cash-on-Cash Return
5.3%
Cap rate
1.0%
Rent to Value Ratio
Active
$725,000
5
bds
|
5
ba
|
4,929
sqft
|
built
1994
119 W Greystone Ct, Dunlap, IL 61525
$-2,524
Cash flow
-18.2%
Cash-on-Cash Return
1.5%
Cap rate
0.5%
Rent to Value Ratio

Active
$49,000
3
bds
|
1
ba
|
1,476
sqft
|
built
1925
707 E Ravine Ave, Peoria, IL 61603
$829
Cash flow
19.7%
Cash-on-Cash Return
20.3%
Cap rate
2.7%
Rent to Value Ratio
Active
$219,900
4
bds
|
1
ba
|
2,020
sqft
|
built
1966
208 Graze Ave, Dunlap, IL 61525
$-175
Cash flow
-4.2%
Cash-on-Cash Return
4.7%
Cap rate
0.8%
Rent to Value Ratio

Active
$475,000
4
bds
|
4
ba
|
4,512
sqft
|
built
1987
9701 Cherrybark Ct, Peoria, IL 61615
$-1,588
Cash flow
-17.4%
Cash-on-Cash Return
1.7%
Cap rate
0.6%
Rent to Value Ratio

Active
$379,000
4
bds
|
4
ba
|
3,196
sqft
|
built
1956
486 E High Point Dr, Peoria, IL 61614
$-685
Cash flow
-9.4%
Cash-on-Cash Return
3.5%
Cap rate
0.7%
Rent to Value Ratio
Active
$115,000
4
bds
|
3
ba
|
2,178
sqft
|
built
1930
1712 N Bigelow St, Peoria, IL 61604
$294
Cash flow
13.3%
Cash-on-Cash Return
8.7%
Cap rate
1.1%
Rent to Value Ratio
Active
$69,900
2
bds
|
1
ba
|
816
sqft
|
built
1926
718 W Corrington Ave, Peoria, IL 61604
$528
Cash flow
8.8%
Cash-on-Cash Return
9.1%
Cap rate
1.4%
Rent to Value Ratio

Active
$409,900
6
bds
|
4
ba
|
4,122
sqft
|
built
1890
1536 W Moss Ave, Peoria, IL 61606
$-700
Cash flow
-8.9%
Cash-on-Cash Return
3.6%
Cap rate
0.7%
Rent to Value Ratio
Active
$99,900
2
bds
|
0
ba
|
0
sqft
|
built
1920
1009 W Armstrong Ave, Peoria, IL 61606
$238
Cash flow
12.4%
Cash-on-Cash Return
9.1%
Cap rate
1.3%
Rent to Value Ratio
Active
$55,000
2
bds
|
1
ba
|
650
sqft
|
built
1930
511 Laveille St, Peoria, IL 61603
$545
Cash flow
11.5%
Cash-on-Cash Return
11.9%
Cap rate
1.6%
Rent to Value Ratio
Active
$130,000
3
bds
|
1
ba
|
919
sqft
|
built
1972
5807 N Andover Ct, Peoria, IL 61615
$-15
Cash flow
-0.6%
Cash-on-Cash Return
6.1%
Cap rate
1.0%
Rent to Value Ratio
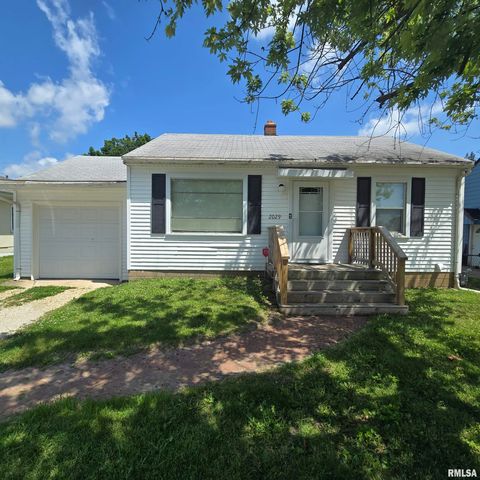
Active
$79,990
2
bds
|
1
ba
|
672
sqft
|
built
1947
2029 W Forrest Hill Ave, Peoria, IL 61604
$129
Cash flow
8.4%
Cash-on-Cash Return
8.2%
Cap rate
1.3%
Rent to Value Ratio

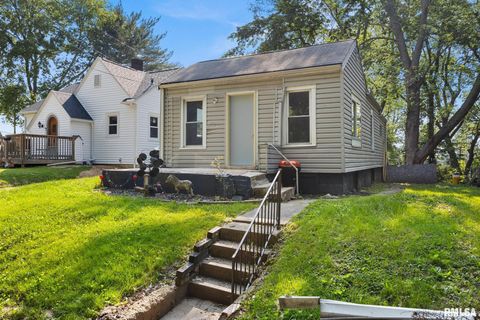
Active
$49,900
2
bds
|
1
ba
|
676
sqft
|
built
1965
3329 N Stanley St, Peoria, IL 61604
$477
Cash flow
11.1%
Cash-on-Cash Return
11.5%
Cap rate
1.8%
Rent to Value Ratio

Active
$124,000
1
bds
|
2
ba
|
1,206
sqft
|
built
1984
123 SW Jefferson Ave, Peoria, IL 61602
$126
Cash flow
5.3%
Cash-on-Cash Return
6.9%
Cap rate
1.3%
Rent to Value Ratio

Active
$237,500
2
bds
|
2
ba
|
1,541
sqft
|
built
1990
5200 N Knoxville Ave, Peoria, IL 61614
$-242
Cash flow
-5.3%
Cash-on-Cash Return
4.5%
Cap rate
0.8%
Rent to Value Ratio

Active
$40,000
2
bds
|
1
ba
|
748
sqft
|
built
1921
910 W Virginia Ave, Peoria, IL 61604
$617
Cash flow
18.0%
Cash-on-Cash Return
18.5%
Cap rate
2.8%
Rent to Value Ratio

Active
$899,000
4
bds
|
5
ba
|
8,577
sqft
|
built
1997
200 W Ravinwoods Rd, Peoria, IL 61615
$-5,449
Cash flow
-31.6%
Cash-on-Cash Return
-1.6%
Cap rate
0.3%
Rent to Value Ratio

Active
$799,000
4
bds
|
7
ba
|
7,667
sqft
|
built
2001
3113 W Summerbend Ct, Peoria, IL 61615
$-3,699
Cash flow
-24.2%
Cash-on-Cash Return
0.1%
Cap rate
0.4%
Rent to Value Ratio

Active
$174,500
4
bds
|
3
ba
|
1,781
sqft
|
built
1977
13014 N Crater Ln, Dunlap, IL 61525
$315
Cash flow
9.4%
Cash-on-Cash Return
7.8%
Cap rate
1.3%
Rent to Value Ratio
Active
$89,900
3
bds
|
1
ba
|
2,153
sqft
|
built
1920
1207 W Mc Clure Ave, Peoria, IL 61604
$312
Cash flow
18.1%
Cash-on-Cash Return
9.8%
Cap rate
1.4%
Rent to Value Ratio
Active
$42,000
2
bds
|
1
ba
|
576
sqft
|
built
1930
3620 NE Brevis St, Peoria, IL 61603
$478
Cash flow
13.3%
Cash-on-Cash Return
13.7%
Cap rate
1.9%
Rent to Value Ratio

Active
$359,900
5
bds
|
3
ba
|
2,501
sqft
|
built
2000
1647 W Geneva Rd, Peoria, IL 61615
$-567
Cash flow
-8.2%
Cash-on-Cash Return
3.8%
Cap rate
0.7%
Rent to Value Ratio
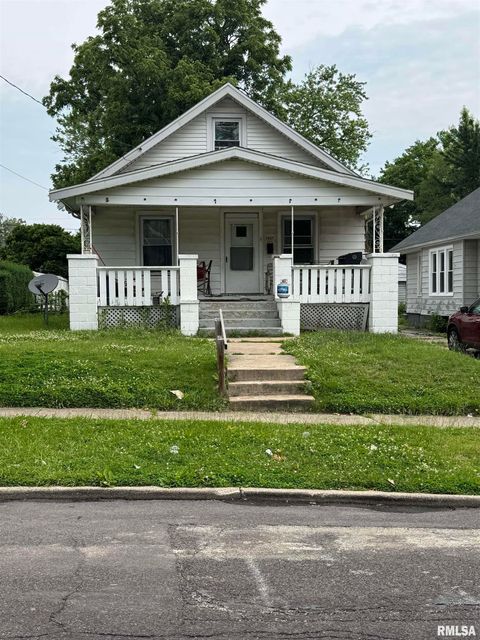
Active
$65,000
4
bds
|
1
ba
|
1,324
sqft
|
built
1915
2005 W Antoinette St, Peoria, IL 61605
$761
Cash flow
13.6%
Cash-on-Cash Return
14.0%
Cap rate
1.8%
Rent to Value Ratio
Active
$69,500
3
bds
|
0
ba
|
1,108
sqft
|
built
1949
9915 N Blacksoil Ln, Peoria, IL 61615
$1,033
Cash flow
17.3%
Cash-on-Cash Return
17.8%
Cap rate
2.3%
Rent to Value Ratio

Active
$14,900
3
bds
|
1
ba
|
864
sqft
|
built
1920
2502 W Malone St, Peoria, IL 61605
$794
Cash flow
62.1%
Cash-on-Cash Return
63.9%
Cap rate
8.1%
Rent to Value Ratio

Active
$129,900
2
bds
|
2
ba
|
1,880
sqft
|
built
1998
3802 W Richwoods Blvd, Peoria, IL 61615
$94
Cash flow
3.8%
Cash-on-Cash Return
6.5%
Cap rate
1.1%
Rent to Value Ratio

Active
$291,300
3
bds
|
2
ba
|
3,600
sqft
|
built
1908
15413 N State Route 91, Dunlap, IL 61525
$-115
Cash flow
-2.1%
Cash-on-Cash Return
5.2%
Cap rate
0.8%
Rent to Value Ratio

Active
$254,900
4
bds
|
2
ba
|
1,945
sqft
|
built
1977
1529 W Richmar Rd, Peoria, IL 61615
$-352
Cash flow
-7.2%
Cash-on-Cash Return
4.0%
Cap rate
0.7%
Rent to Value Ratio

Active
$90,990
2
bds
|
1
ba
|
1,023
sqft
|
built
1973
6831 N Frostwood Pkwy, Peoria, IL 61615
$229
Cash flow
13.1%
Cash-on-Cash Return
8.7%
Cap rate
1.3%
Rent to Value Ratio