Peoria County Investment Properties for Sale
Browse homes for sale and investment properties in Peoria County. Refine your search by price, property type, or more.
Best cash flowing properties in Peoria County

Active
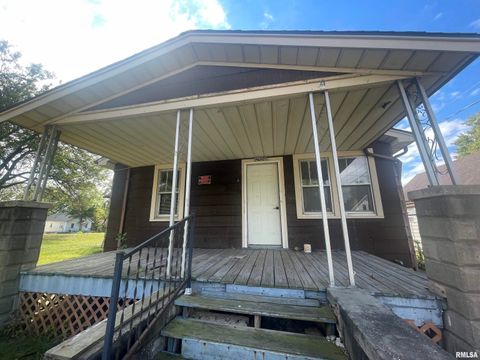
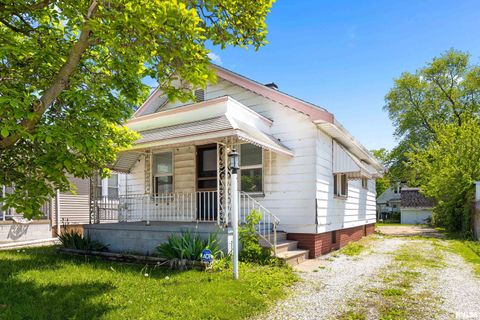
$15,000
2
bds
|
1
ba
|
1,006
sqft
|
built
1900
2126 W Proctor St, Peoria, IL 61605
$910
Cash flow
70.7%
Cash-on-Cash Return
72.8%
Cap rate
9.3%
Rent to Value Ratio

Active
$55,000
3
bds
|
2
ba
|
1,712
sqft
|
built
1915
1812 N Peoria Ave, Peoria, IL 61603
$821
Cash flow
17.4%
Cash-on-Cash Return
17.9%
Cap rate
2.4%
Rent to Value Ratio
180 out of 253 properties for sale in Peoria County
Limited Results Shown
Create a free account, or log in to reveal all property listings and enjoy the complete experience.

Active
$165,000
4
bds
|
0
ba
|
0
sqft
|
built
1920
1624 W Barker Ave, Peoria, IL 61606
$90
Cash flow
2.8%
Cash-on-Cash Return
6.3%
Cap rate
1.0%
Rent to Value Ratio
Active
$55,000
3
bds
|
2
ba
|
1,712
sqft
|
built
1915
1812 N Peoria Ave, Peoria, IL 61603
$821
Cash flow
17.4%
Cash-on-Cash Return
17.9%
Cap rate
2.4%
Rent to Value Ratio
Active
$25,000
3
bds
|
1
ba
|
908
sqft
|
built
1920
2506 W Humboldt St, Peoria, IL 61605
$539
Cash flow
25.1%
Cash-on-Cash Return
25.9%
Cap rate
3.6%
Rent to Value Ratio
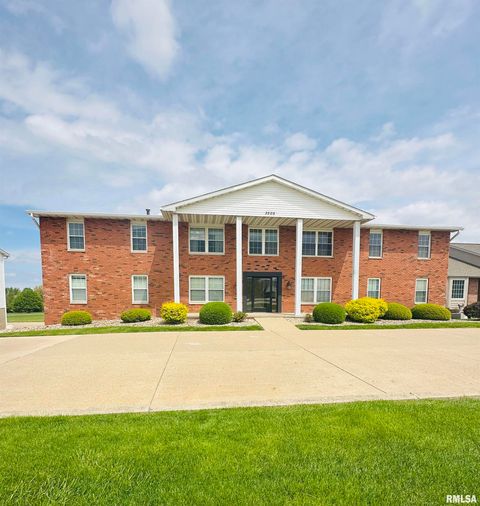
Active
$125,000
2
bds
|
2
ba
|
912
sqft
|
built
1980
3505 W Willow Knolls Dr, Peoria, IL 61614
$122
Cash flow
5.1%
Cash-on-Cash Return
6.9%
Cap rate
1.0%
Rent to Value Ratio

Active
$80,000
2
bds
|
2
ba
|
1,030
sqft
|
built
1976
6831 N Frostwood Pkwy, Peoria, IL 61615
$265
Cash flow
17.3%
Cash-on-Cash Return
9.7%
Cap rate
1.5%
Rent to Value Ratio

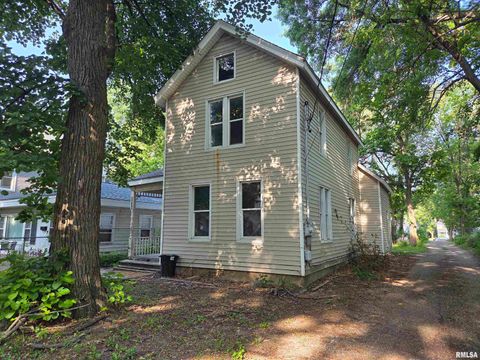
Active
$99,900
2
bds
|
2
ba
|
752
sqft
|
built
1946
2050 W Wilson Ave, Peoria, IL 61604
$124
Cash flow
6.5%
Cash-on-Cash Return
7.2%
Cap rate
1.1%
Rent to Value Ratio

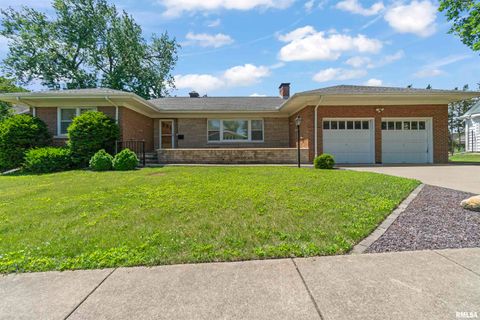
Active
$114,900
4
bds
|
2
ba
|
1,550
sqft
|
built
1972
4124 W Courtland St, Peoria, IL 61615
$195
Cash flow
8.9%
Cash-on-Cash Return
7.7%
Cap rate
1.2%
Rent to Value Ratio
Active
$64,000
3
bds
|
2
ba
|
1,475
sqft
|
built
1910
2011 N Bigelow St, Peoria, IL 61604
$626
Cash flow
11.4%
Cash-on-Cash Return
11.7%
Cap rate
1.7%
Rent to Value Ratio
Active
$239,900
3
bds
|
2
ba
|
1,991
sqft
|
built
1950
502 W Crestwood Dr, Peoria, IL 61614
$-300
Cash flow
-6.5%
Cash-on-Cash Return
4.8%
Cap rate
0.8%
Rent to Value Ratio
Active
$99,900
2
bds
|
1
ba
|
768
sqft
|
built
1950
2113 W Overbrook Dr, Peoria, IL 61604
$121
Cash flow
6.3%
Cash-on-Cash Return
7.7%
Cap rate
1.2%
Rent to Value Ratio

Active
$346,500
5
bds
|
4
ba
|
4,228
sqft
|
built
1900
1635 W Moss Ave, Peoria, IL 61606
$-343
Cash flow
-5.2%
Cash-on-Cash Return
4.5%
Cap rate
0.8%
Rent to Value Ratio

Active
$36,500
4
bds
|
1
ba
|
1,034
sqft
|
built
1900
2217 NE Madison Ave, Peoria, IL 61603
$754
Cash flow
24.1%
Cash-on-Cash Return
24.8%
Cap rate
3.3%
Rent to Value Ratio

Active
$94,900
3
bds
|
1
ba
|
2,014
sqft
|
built
1956
1907 N Sterling Ave, Peoria, IL 61604
$407
Cash flow
22.4%
Cash-on-Cash Return
10.8%
Cap rate
1.8%
Rent to Value Ratio
Active
$110,000
3
bds
|
2
ba
|
1,263
sqft
|
built
1930
1114 E Forrest Hill Ave, Peoria, IL 61603
$190
Cash flow
9.0%
Cash-on-Cash Return
7.8%
Cap rate
1.2%
Rent to Value Ratio
Active
$215,000
3
bds
|
2
ba
|
2,060
sqft
|
built
1935
136 E Oak Park Dr, Peoria, IL 61614
$50
Cash flow
1.2%
Cash-on-Cash Return
6.0%
Cap rate
1.0%
Rent to Value Ratio
Active
$60,000
3
bds
|
1
ba
|
1,069
sqft
|
built
1928
1025 E Behrends Ave, Peoria, IL 61603
$601
Cash flow
11.7%
Cash-on-Cash Return
12.0%
Cap rate
1.7%
Rent to Value Ratio
Active
$56,900
2
bds
|
1
ba
|
660
sqft
|
built
1935
2414 W Lincoln Ave, Peoria, IL 61605
$554
Cash flow
11.3%
Cash-on-Cash Return
11.7%
Cap rate
1.6%
Rent to Value Ratio
Active
$15,000
2
bds
|
1
ba
|
1,006
sqft
|
built
1900
2126 W Proctor St, Peoria, IL 61605
$910
Cash flow
70.7%
Cash-on-Cash Return
72.8%
Cap rate
9.3%
Rent to Value Ratio

Active
$60,000
1
bds
|
1
ba
|
568
sqft
|
built
1976
6831 N Frostwood Pkwy, Peoria, IL 61615
$529
Cash flow
10.3%
Cash-on-Cash Return
10.6%
Cap rate
1.5%
Rent to Value Ratio

Active
$85,000
3
bds
|
1
ba
|
864
sqft
|
built
1951
831 W Bartlett Ct, Peoria, IL 61604
$229
Cash flow
14.1%
Cash-on-Cash Return
8.9%
Cap rate
1.3%
Rent to Value Ratio

Active
$77,500
2
bds
|
2
ba
|
1,156
sqft
|
built
1975
169 E Oak Cliff Ct, Peoria, IL 61614
$460
Cash flow
31.0%
Cash-on-Cash Return
12.8%
Cap rate
1.8%
Rent to Value Ratio

Active
$58,000
3
bds
|
1
ba
|
1,000
sqft
|
built
1880
921 W Brons Ave, Peoria, IL 61604
$571
Cash flow
11.5%
Cash-on-Cash Return
11.8%
Cap rate
1.7%
Rent to Value Ratio

Active
$39,900
2
bds
|
1
ba
|
895
sqft
|
built
1920
305 W Nebraska Ave, Peoria, IL 61604
$556
Cash flow
16.2%
Cash-on-Cash Return
16.7%
Cap rate
2.3%
Rent to Value Ratio

Active
$249,900
3
bds
|
2
ba
|
2,074
sqft
|
built
1958
209 E Northridge Ln, Peoria, IL 61614
$-252
Cash flow
-5.3%
Cash-on-Cash Return
4.5%
Cap rate
0.8%
Rent to Value Ratio

Active
$145,000
6
bds
|
3
ba
|
2,147
sqft
|
built
1916
2016 N Atlantic Ave, Peoria, IL 61603
$600
Cash flow
21.6%
Cash-on-Cash Return
10.6%
Cap rate
1.4%
Rent to Value Ratio

Active
$79,900
2
bds
|
1
ba
|
1,538
sqft
|
built
1900
10103 W Powder Mill Rd, Edwards, IL 61528
$414
Cash flow
27.0%
Cash-on-Cash Return
11.9%
Cap rate
1.5%
Rent to Value Ratio
Active
$225,000
3
bds
|
2
ba
|
1,680
sqft
|
built
1977
106 N 5th St, Dunlap, IL 61525
$-79
Cash flow
-1.8%
Cash-on-Cash Return
5.3%
Cap rate
0.8%
Rent to Value Ratio
Active
$379,900
6
bds
|
4
ba
|
4,020
sqft
|
built
1998
5112 N Rothmere Dr, Peoria, IL 61615
$-1,000
Cash flow
-13.7%
Cash-on-Cash Return
2.5%
Cap rate
0.6%
Rent to Value Ratio
Active
$254,900
4
bds
|
3
ba
|
2,504
sqft
|
built
1966
2010 E Paris Ave, Peoria, IL 61614
$-819
Cash flow
-16.8%
Cash-on-Cash Return
1.8%
Cap rate
0.4%
Rent to Value Ratio
Active
$70,000
1
bds
|
1
ba
|
609
sqft
|
built
1950
5217 W Monroe Rd, Peoria, IL 61607
$429
Cash flow
7.1%
Cash-on-Cash Return
7.4%
Cap rate
1.1%
Rent to Value Ratio
Active
$65,000
3
bds
|
1
ba
|
884
sqft
|
built
1922
209 E Corrington Ave, Peoria, IL 61603
$689
Cash flow
12.3%
Cash-on-Cash Return
12.7%
Cap rate
1.8%
Rent to Value Ratio
Active
$192,000
4
bds
|
3
ba
|
2,434
sqft
|
built
1973
2816 N Kingston Dr, Peoria, IL 61604
$-149
Cash flow
-4.0%
Cash-on-Cash Return
5.3%
Cap rate
0.9%
Rent to Value Ratio
Active
$110,000
2
bds
|
1
ba
|
864
sqft
|
built
2006
1404 E Richwoods Blvd, Peoria, IL 61603
$139
Cash flow
6.6%
Cash-on-Cash Return
7.8%
Cap rate
1.2%
Rent to Value Ratio
Active
$149,900
3
bds
|
3
ba
|
2,400
sqft
|
built
1997
4405 W Crabtree Ct, Peoria, IL 61604
$160
Cash flow
5.6%
Cash-on-Cash Return
7.5%
Cap rate
1.1%
Rent to Value Ratio

Active
$355,000
5
bds
|
4
ba
|
3,124
sqft
|
built
2002
2331 W Molly Ln, Dunlap, IL 61525
$-556
Cash flow
-8.2%
Cash-on-Cash Return
3.8%
Cap rate
0.7%
Rent to Value Ratio

Active
$239,900
bds
|
0
ba
|
0
sqft
|
built
1925
2405 N Sheridan Rd, Peoria, IL 61604
$-207
Cash flow
-4.5%
Cash-on-Cash Return
4.6%
Cap rate
0.7%
Rent to Value Ratio

Active
$150,000
4
bds
|
2
ba
|
1,508
sqft
|
built
1912
1502 W Columbia Ter, Peoria, IL 61606
$149
Cash flow
5.2%
Cash-on-Cash Return
6.9%
Cap rate
1.2%
Rent to Value Ratio
Active
$168,500
3
bds
|
2
ba
|
1,372
sqft
|
built
1949
4126 N Chelsea Pl, Peoria, IL 61614
$-46
Cash flow
-1.4%
Cash-on-Cash Return
5.3%
Cap rate
0.9%
Rent to Value Ratio
Active
$60,000
3
bds
|
1
ba
|
1,322
sqft
|
built
1910
2219 N North St, Peoria, IL 61604
$529
Cash flow
10.3%
Cash-on-Cash Return
10.6%
Cap rate
1.7%
Rent to Value Ratio

Active
$134,990
3
bds
|
1
ba
|
1,124
sqft
|
built
1953
4928 W Farmington Rd, Peoria, IL 61604
$286
Cash flow
11.1%
Cash-on-Cash Return
8.2%
Cap rate
1.2%
Rent to Value Ratio