Will County Investment Properties for Sale
Browse homes for sale and investment properties in Will County. Refine your search by price, property type, or more.
Best cash flowing properties in Will County

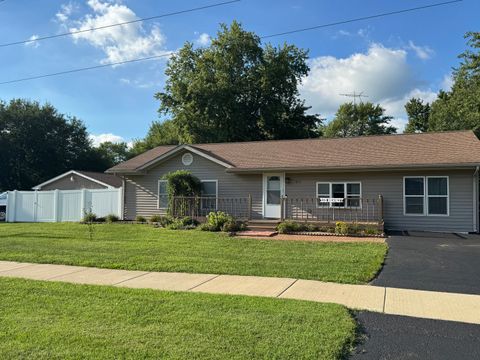
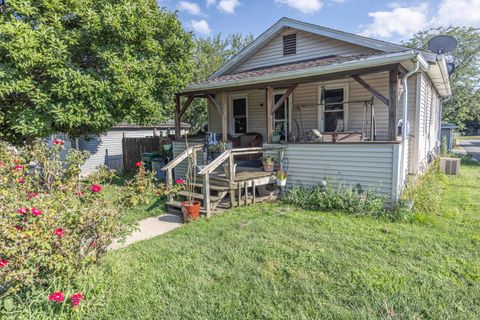
Active
$149,900
4
bds
|
3
ba
|
3,581
sqft
|
built
1958
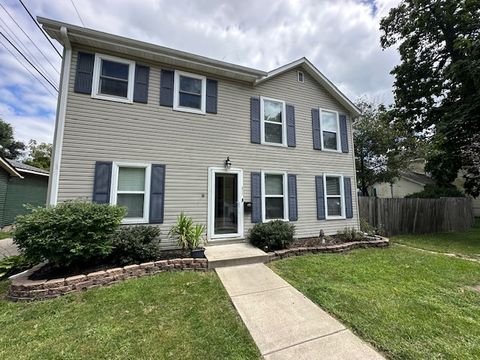
48 Woodland Gln, Park Forest, IL 60466
$555
Cash flow
19.3%
Cash-on-Cash Return
10.1%
Cap rate
2.1%
Rent to Value Ratio
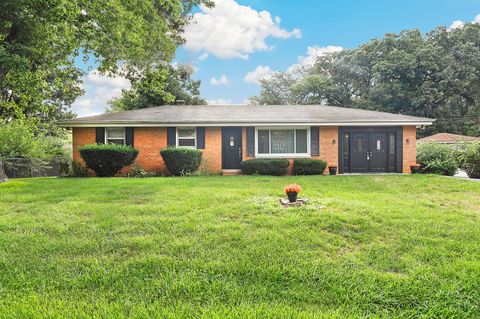
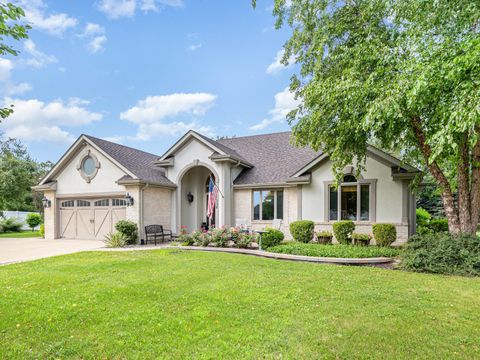
Active
$272,000
3
bds
|
2
ba
|
1,600
sqft
|
built
1973
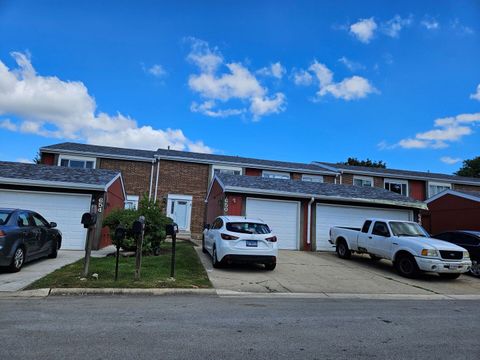
910 W Kennedy Rd, Braidwood, IL 60408
$209
Cash flow
4.0%
Cash-on-Cash Return
6.6%
Cap rate
1.0%
Rent to Value Ratio
509 out of 590 properties for sale in Will County
Limited Results Shown
Create a free account, or log in to reveal all property listings and enjoy the complete experience.
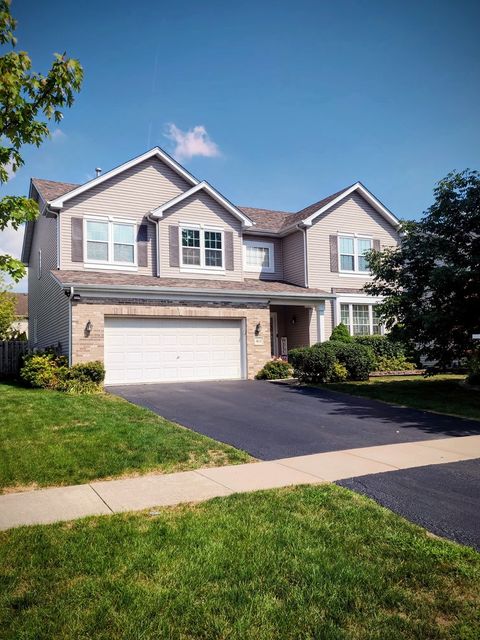
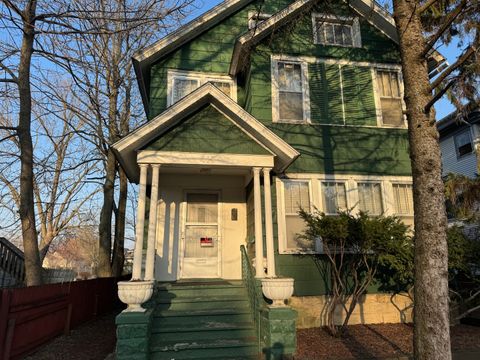
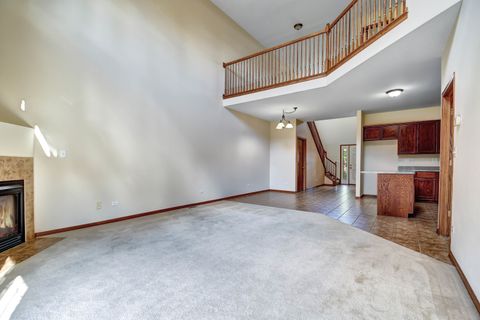
Active
$319,900
3
bds
|
2
ba
|
2,166
sqft
|
built
1962
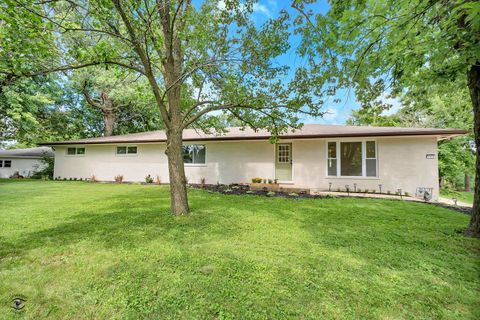
324 Parkshore Dr, Shorewood, IL 60404
$-491
Cash flow
-8.0%
Cash-on-Cash Return
3.8%
Cap rate
0.7%
Rent to Value Ratio
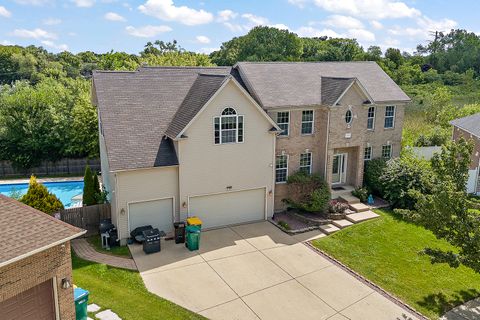
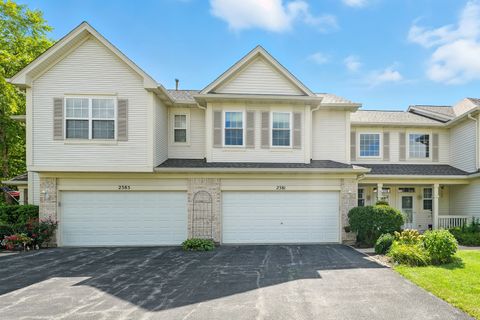
Active
$489,000
4
bds
|
3
ba
|
2,947
sqft
|
built
2006
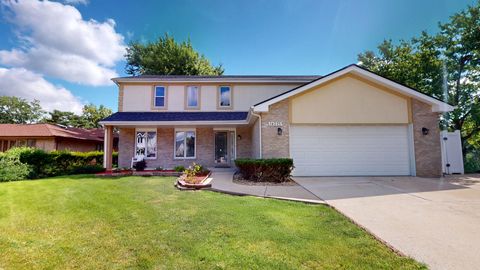
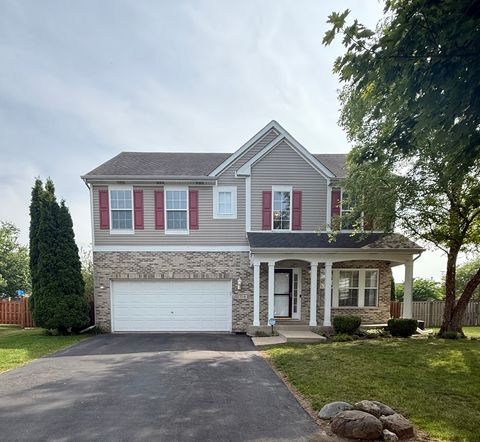
1612 Whisper Glen Dr, Plainfield, IL 60586
$-668
Cash flow
-7.1%
Cash-on-Cash Return
4.0%
Cap rate
0.7%
Rent to Value Ratio
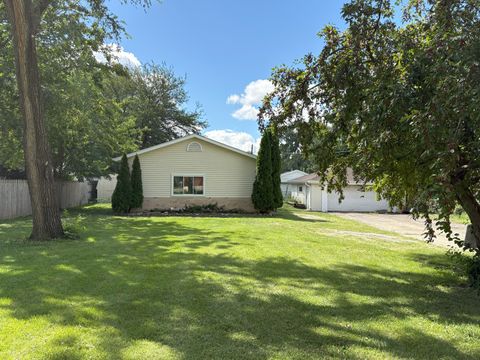
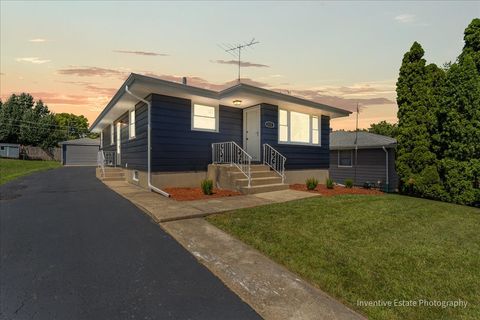
Active
$255,000
3
bds
|
1
ba
|
1,000
sqft
|
built
1954
247 E North St, Lockport, IL 60441
$-181
Cash flow
-3.7%
Cash-on-Cash Return
4.8%
Cap rate
0.9%
Rent to Value Ratio
Active
$399,999
2
bds
|
2
ba
|
1,769
sqft
|
built
2000
21600 W Larch Dr, Plainfield, IL 60544
$-1,120
Cash flow
-14.6%
Cash-on-Cash Return
2.3%
Cap rate
0.7%
Rent to Value Ratio
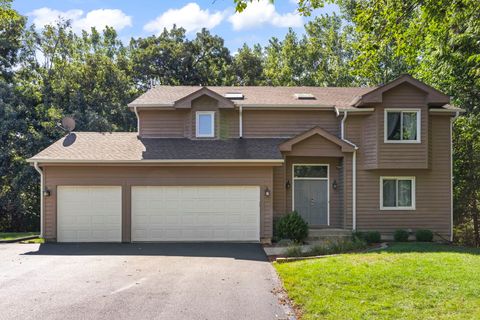
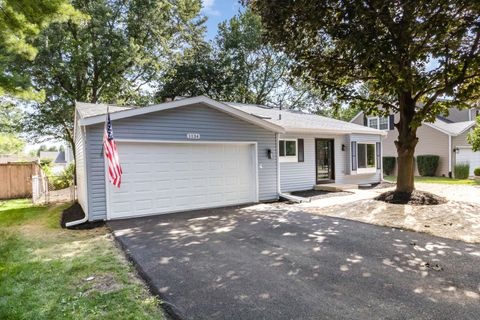
Active
$299,990
3
bds
|
3
ba
|
1,698
sqft
|
built
2003
14 Harmony Ln, Romeoville, IL 60446
$-425
Cash flow
-7.4%
Cash-on-Cash Return
4.0%
Cap rate
0.8%
Rent to Value Ratio
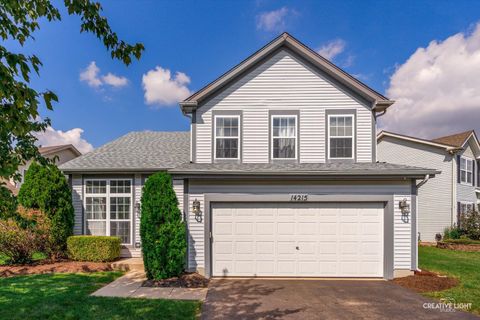
Active
$384,999
3
bds
|
3
ba
|
2,043
sqft
|
built
1997
14215 S Longview Ln, Plainfield, IL 60544
$-422
Cash flow
-5.7%
Cash-on-Cash Return
4.4%
Cap rate
0.8%
Rent to Value Ratio
Active
$340,000
3
bds
|
2
ba
|
1,693
sqft
|
built
1999
21331 W Juniper Ln, Plainfield, IL 60544
$-511
Cash flow
-7.8%
Cash-on-Cash Return
3.9%
Cap rate
0.8%
Rent to Value Ratio
Active
$290,000
4
bds
|
2
ba
|
1,900
sqft
|
built
211 N Washington St, Wilmington, IL 60481
$-232
Cash flow
-4.2%
Cash-on-Cash Return
4.7%
Cap rate
0.8%
Rent to Value Ratio
Active
$275,000
3
bds
|
3
ba
|
1,536
sqft
|
built
1974
650 Sundance Dr, Bolingbrook, IL 60440
$-305
Cash flow
-5.8%
Cash-on-Cash Return
4.3%
Cap rate
0.9%
Rent to Value Ratio
Active
$575,000
4
bds
|
3
ba
|
2,432
sqft
|
built
1960
190 Pottawatomie Ln, New Lenox, IL 60451
$-1,561
Cash flow
-14.2%
Cash-on-Cash Return
2.4%
Cap rate
0.5%
Rent to Value Ratio
Active
$549,900
4
bds
|
3
ba
|
2,673
sqft
|
built
1990
14225 Mallard Dr, Orland Park, IL 60467
$-849
Cash flow
-8.1%
Cash-on-Cash Return
3.8%
Cap rate
0.7%
Rent to Value Ratio
Active
$270,000
2
bds
|
2
ba
|
1,312
sqft
|
built
1993
321 Whispering Ct, Bolingbrook, IL 60440
$-240
Cash flow
-4.6%
Cash-on-Cash Return
4.6%
Cap rate
0.9%
Rent to Value Ratio
Active
$474,900
4
bds
|
3
ba
|
3,844
sqft
|
built
1996
406 Cambridge Ln, Shorewood, IL 60404
$-895
Cash flow
-9.8%
Cash-on-Cash Return
3.4%
Cap rate
0.7%
Rent to Value Ratio
Active
$245,000
3
bds
|
2
ba
|
1,152
sqft
|
built
1959
309 Robson Dr, Lockport, IL 60441
$-354
Cash flow
-7.5%
Cash-on-Cash Return
3.9%
Cap rate
0.7%
Rent to Value Ratio
Active
$360,000
3
bds
|
2
ba
|
1,542
sqft
|
built
2010
15701 Cove Cir, Plainfield, IL 60544
$-777
Cash flow
-11.3%
Cash-on-Cash Return
3.1%
Cap rate
0.7%
Rent to Value Ratio
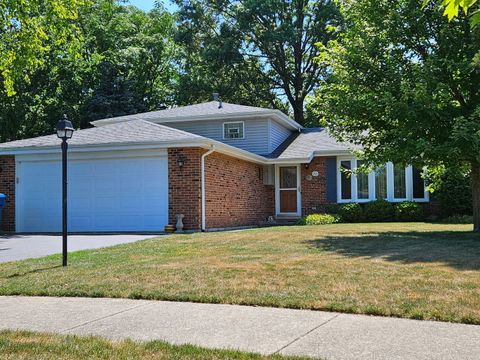
Active
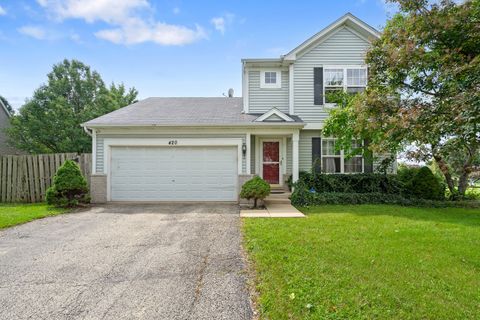
$364,900
3
bds
|
3
ba
|
1,600
sqft
|
built
2003
420 N Maggie Ln, Romeoville, IL 60446
$-347
Cash flow
-5.0%
Cash-on-Cash Return
4.5%
Cap rate
0.8%
Rent to Value Ratio
Active
$293,000
2
bds
|
2
ba
|
1,392
sqft
|
built
2003
17517 S Gilbert Dr, Lockport, IL 60441
$-362
Cash flow
-6.4%
Cash-on-Cash Return
4.2%
Cap rate
0.9%
Rent to Value Ratio
Active
$375,000
3
bds
|
3
ba
|
1,650
sqft
|
built
1956
378 Oakwood Dr, Crete, IL 60417
$-798
Cash flow
-11.1%
Cash-on-Cash Return
3.1%
Cap rate
0.7%
Rent to Value Ratio
Active
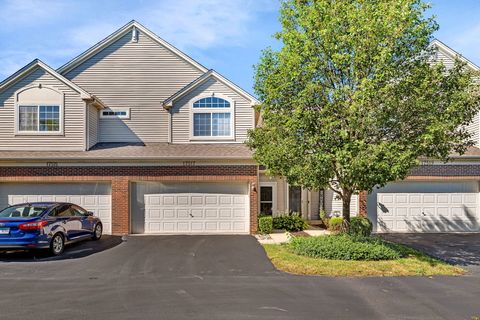
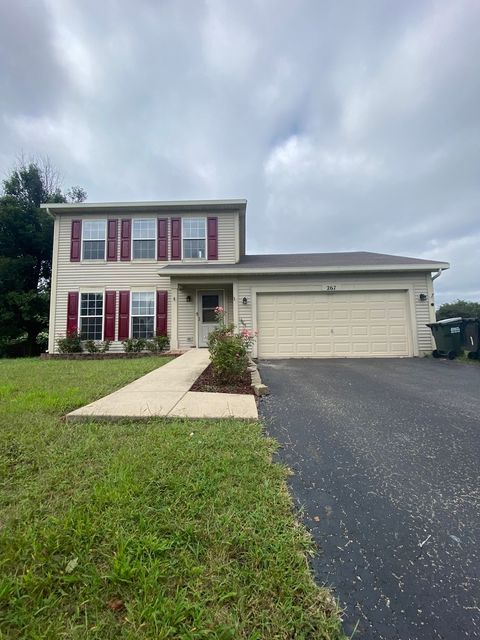
$395,000
3
bds
|
3
ba
|
1,579
sqft
|
built
2003
267 Clarendon Ln, Bolingbrook, IL 60440
$-882
Cash flow
-11.6%
Cash-on-Cash Return
3.0%
Cap rate
0.7%
Rent to Value Ratio
Active
$1,299,900
5
bds
|
5
ba
|
6,449
sqft
|
built
2005
3707 Junebreeze Ln, Naperville, IL 60564
$-5,104
Cash flow
-20.5%
Cash-on-Cash Return
1.0%
Cap rate
0.3%
Rent to Value Ratio
Active
$248,000
4
bds
|
3
ba
|
1,640
sqft
|
built
1890
415 Buell Ave, Joliet, IL 60435
$-125
Cash flow
-2.6%
Cash-on-Cash Return
5.1%
Cap rate
0.7%
Rent to Value Ratio
Active
$279,900
3
bds
|
2
ba
|
1,174
sqft
|
built
1966
223 S Margaret St, Joliet, IL 60436
$-332
Cash flow
-6.2%
Cash-on-Cash Return
4.3%
Cap rate
0.7%
Rent to Value Ratio
Active
$520,000
4
bds
|
4
ba
|
2,593
sqft
|
built
1996
11 Roanoke Ct, Bolingbrook, IL 60440
$-997
Cash flow
-10.0%
Cash-on-Cash Return
3.4%
Cap rate
0.8%
Rent to Value Ratio
Active
$539,000
2
bds
|
2
ba
|
1,800
sqft
|
built
2022
1340 Lacoma Ct, Lockport, IL 60441
$-765
Cash flow
-7.4%
Cash-on-Cash Return
4.0%
Cap rate
0.9%
Rent to Value Ratio
Active
$300,000
3
bds
|
2
ba
|
1,700
sqft
|
built
2004
5110 Fairground Ct, Monee, IL 60449
$-252
Cash flow
-4.4%
Cash-on-Cash Return
4.7%
Cap rate
0.9%
Rent to Value Ratio
Active
$309,000
4
bds
|
2
ba
|
1,725
sqft
|
built
1949
1025 Frederick St, Joliet, IL 60435
$-359
Cash flow
-6.1%
Cash-on-Cash Return
4.3%
Cap rate
0.7%
Rent to Value Ratio
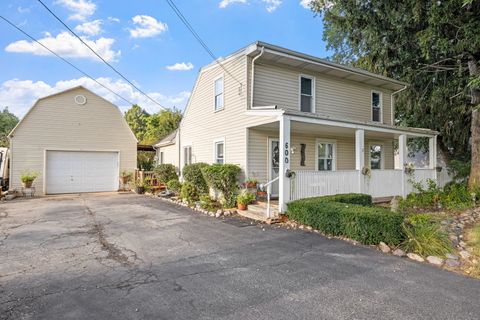
Active
$289,900
4
bds
|
2
ba
|
1,224
sqft
|
built
1945
600 Bruce Rd, Lockport, IL 60441
$-142
Cash flow
-2.6%
Cash-on-Cash Return
5.1%
Cap rate
0.8%
Rent to Value Ratio
Active
$545,000
4
bds
|
4
ba
|
3,563
sqft
|
built
2004
23660 Dayfield Ct, Plainfield, IL 60586
$-1,463
Cash flow
-14.0%
Cash-on-Cash Return
2.5%
Cap rate
0.6%
Rent to Value Ratio
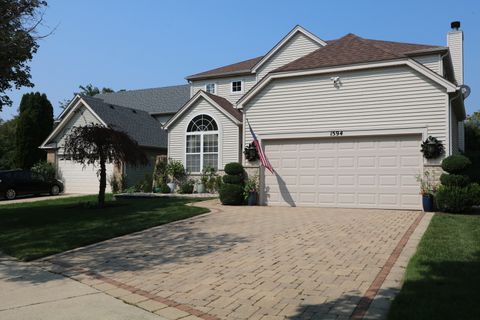
Active
$699,800
3
bds
|
4
ba
|
2,364
sqft
|
built
1999
1594 Baytree Dr, Romeoville, IL 60446
$-2,422
Cash flow
-18.1%
Cash-on-Cash Return
1.5%
Cap rate
0.4%
Rent to Value Ratio
Active
$489,900
4
bds
|
2
ba
|
0
sqft
|
built
1985
1134 Gateshead Dr, Naperville, IL 60564
$-1,163
Cash flow
-12.4%
Cash-on-Cash Return
2.8%
Cap rate
0.5%
Rent to Value Ratio
Active
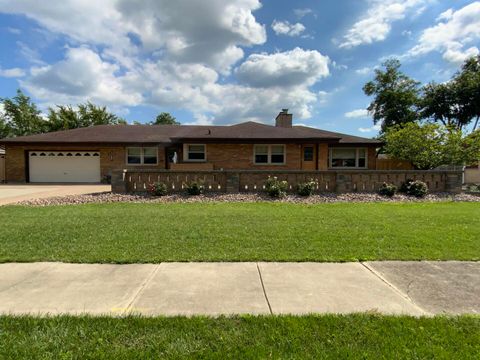
$289,900
3
bds
|
2
ba
|
1,953
sqft
|
built
1979
20 Joe Orr Ct, Crete, IL 60417
$-420
Cash flow
-7.6%
Cash-on-Cash Return
3.9%
Cap rate
0.6%
Rent to Value Ratio
Active
$170,000
2
bds
|
1
ba
|
782
sqft
|
built
1932
806 Woods Ave, Joliet, IL 60436
$132
Cash flow
4.1%
Cash-on-Cash Return
6.6%
Cap rate
1.1%
Rent to Value Ratio
Active
$525,000
3
bds
|
3
ba
|
1,789
sqft
|
built
1992
1228 Conquest Ct, Shorewood, IL 60404
$-1,236
Cash flow
-12.3%
Cash-on-Cash Return
2.9%
Cap rate
0.5%
Rent to Value Ratio
Active
$374,873
3
bds
|
3
ba
|
2,200
sqft
|
built
2006
11151 188th Pl, Mokena, IL 60448
$-680
Cash flow
-9.5%
Cash-on-Cash Return
3.5%
Cap rate
0.8%
Rent to Value Ratio
Active
$305,000
2
bds
|
3
ba
|
1,266
sqft
|
built
2004
2381 Sunshine Ln, Aurora, IL 60503
$-646
Cash flow
-11.1%
Cash-on-Cash Return
3.1%
Cap rate
0.7%
Rent to Value Ratio
Active
$388,900
3
bds
|
3
ba
|
2,285
sqft
|
built
2004
710 Silver Leaf Ct, Joliet, IL 60431
$-609
Cash flow
-8.2%
Cash-on-Cash Return
3.8%
Cap rate
0.7%
Rent to Value Ratio
Active
$559,500
5
bds
|
4
ba
|
2,884
sqft
|
built
2004
24006 Skyler Ln, Plainfield, IL 60586
$-1,119
Cash flow
-10.4%
Cash-on-Cash Return
3.3%
Cap rate
0.6%
Rent to Value Ratio
Active
$299,900
3
bds
|
2
ba
|
0
sqft
|
built
1973
409 Connor Ave, Lockport, IL 60441
$99
Cash flow
1.7%
Cash-on-Cash Return
6.1%
Cap rate
0.7%
Rent to Value Ratio