Illinois Investment Properties for Sale
Browse homes for sale and investment properties in Illinois. Refine your search by price, property type, or more.
Best cash flowing properties in Illinois
Active
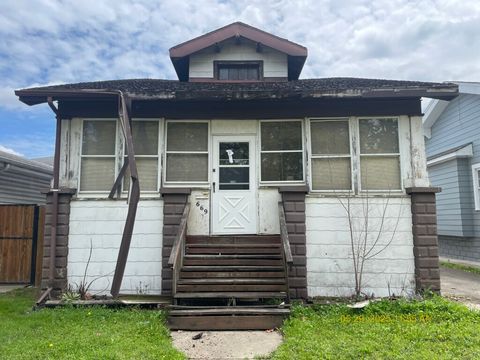
$62,000
2
bds
|
1
ba
|
1,000
sqft
|
built
1913
669 Douglas Ave, Calumet City, IL 60409
$812
Cash flow
15.3%
Cash-on-Cash Return
15.7%
Cap rate
2.9%
Rent to Value Ratio
Active
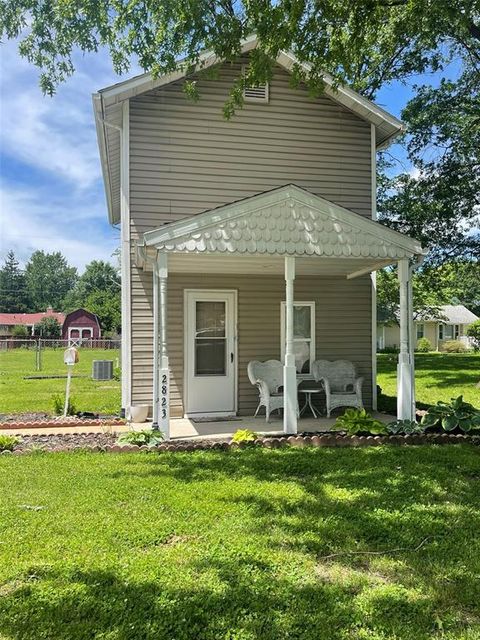
$49,900
2
bds
|
1
ba
|
952
sqft
|
built
1910
2823 Indiana Ave, Granite City, IL 62040
$691
Cash flow
16.1%
Cash-on-Cash Return
16.6%
Cap rate
2.2%
Rent to Value Ratio
7,261 out of 11,246 properties for sale in Illinois
Limited Results Shown
Create a free account, or log in to reveal all property listings and enjoy the complete experience.
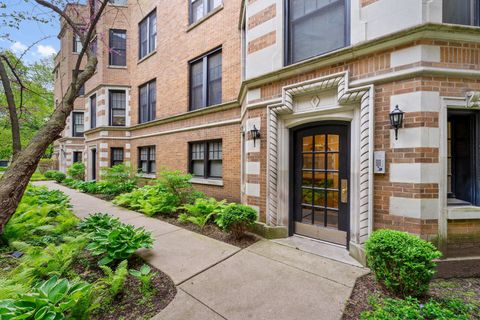
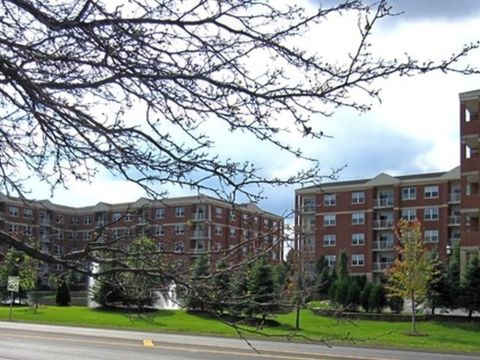
Active
$229,500
1
bds
|
1
ba
|
1,000
sqft
|
built
1927
602 Sheridan Rd, Evanston, IL 60202
$-43
Cash flow
-1.0%
Cash-on-Cash Return
5.5%
Cap rate
1.0%
Rent to Value Ratio
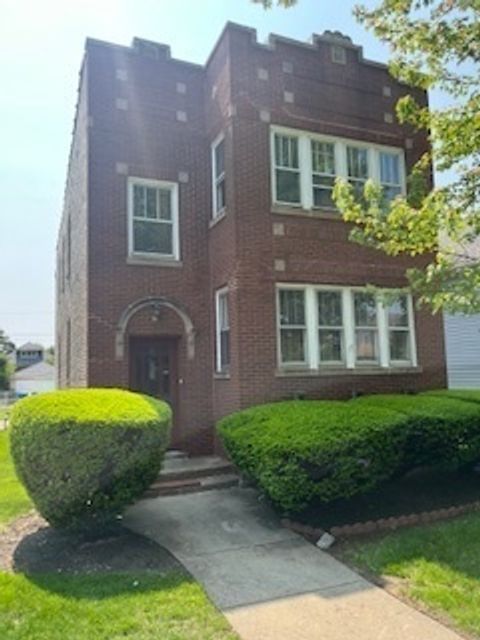
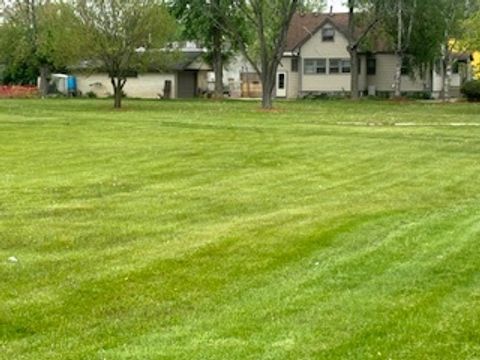
Active
$599,000
6
bds
|
2
ba
|
0
sqft
|
built
1920
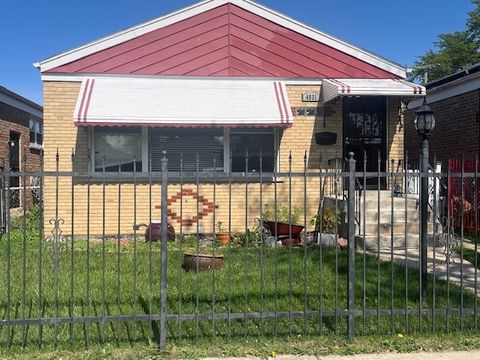
4979 N Kolmar Ave, Chicago, IL 60630
$-2,004
Cash flow
-17.5%
Cash-on-Cash Return
1.7%
Cap rate
0.4%
Rent to Value Ratio
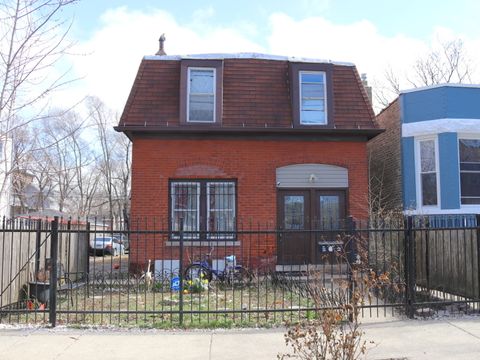
Active
$510,000
2
bds
|
2
ba
|
1,184
sqft
|
built
2008
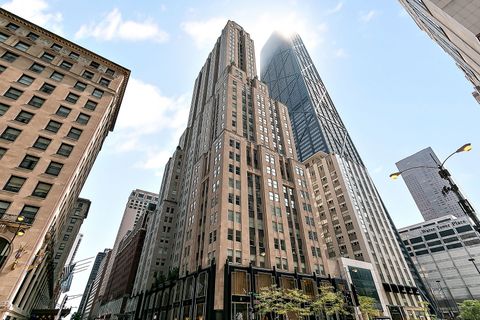
757 N Orleans St, Chicago, IL 60654
$-1,635
Cash flow
-16.7%
Cash-on-Cash Return
1.8%
Cap rate
0.7%
Rent to Value Ratio
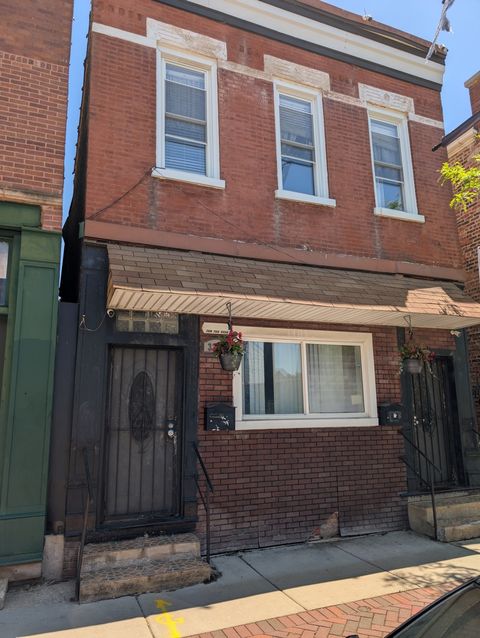
Active
$154,900
5
bds
|
2
ba
|
2,184
sqft
|
built
1923
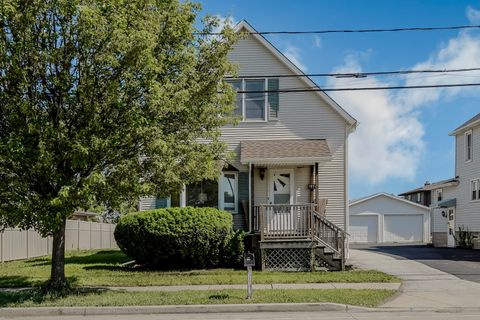
347 156th St, Calumet City, IL 60409
$511
Cash flow
17.2%
Cash-on-Cash Return
9.6%
Cap rate
1.6%
Rent to Value Ratio

Active
$229,000
4
bds
|
2
ba
|
1,872
sqft
|
built
1956
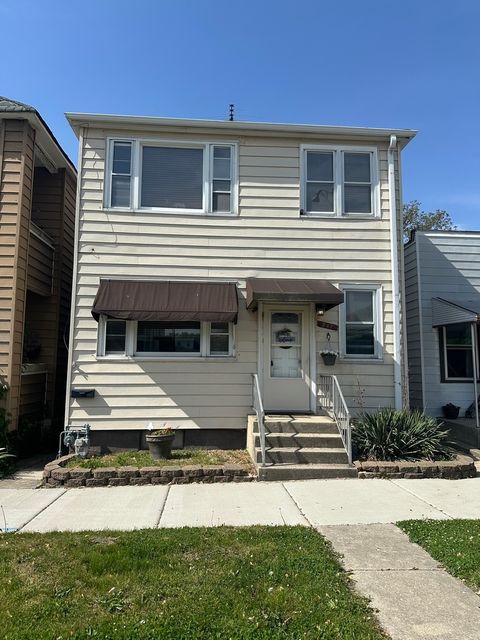
176 Monee Rd, Park Forest, IL 60466
$-65
Cash flow
-1.5%
Cash-on-Cash Return
5.3%
Cap rate
1.1%
Rent to Value Ratio
Active
$3,599,000
6
bds
|
6
ba
|
0
sqft
|
built
1930
111 Oxford Rd, Kenilworth, IL 60043
$-14,313
Cash flow
-20.7%
Cash-on-Cash Return
0.9%
Cap rate
0.2%
Rent to Value Ratio
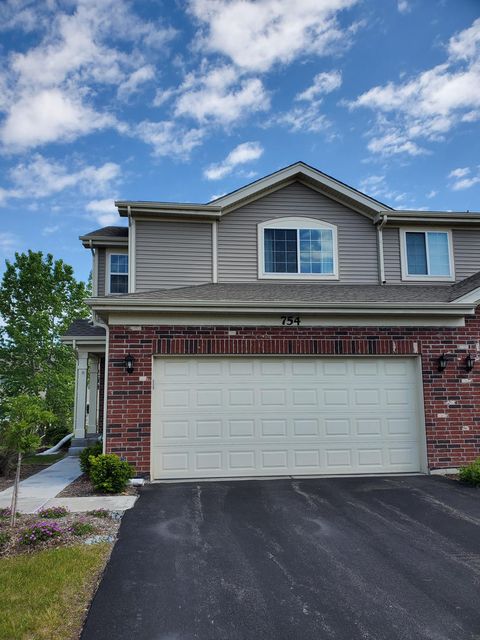
Active
$359,900
3
bds
|
3
ba
|
1,574
sqft
|
built
2023
754 Westbury Dr, Cary, IL 60013
$-612
Cash flow
-8.9%
Cash-on-Cash Return
3.6%
Cap rate
0.8%
Rent to Value Ratio
Active
$264,000
4
bds
|
3
ba
|
2,310
sqft
|
built
1971
22757 Lakeshore Dr, Richton Park, IL 60471
$-64
Cash flow
-1.3%
Cash-on-Cash Return
5.4%
Cap rate
1.0%
Rent to Value Ratio
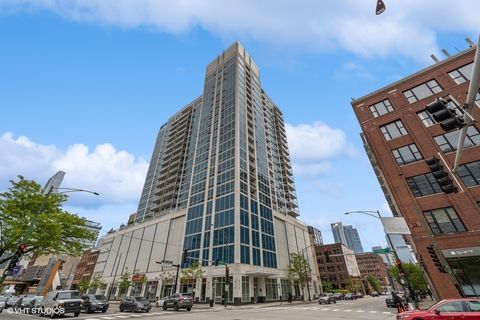
Active
$414,000
2
bds
|
2
ba
|
1,027
sqft
|
built
2007
2025 S Indiana Ave, Chicago, IL 60616
$-1,101
Cash flow
-13.9%
Cash-on-Cash Return
2.5%
Cap rate
0.7%
Rent to Value Ratio
Active
$1,224,000
8
bds
|
4
ba
|
0
sqft
|
built
1879
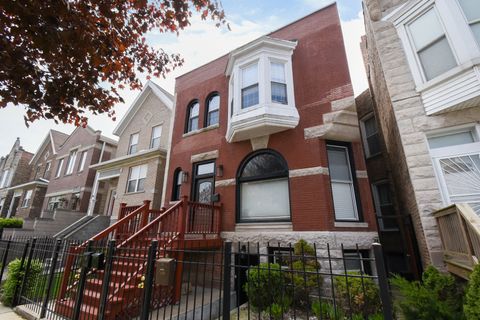
1454 W Ohio St, Chicago, IL 60642
$-5,136
Cash flow
-21.9%
Cash-on-Cash Return
0.6%
Cap rate
0.2%
Rent to Value Ratio
Active
$150,000
3
bds
|
1
ba
|
1,341
sqft
|
built
1954
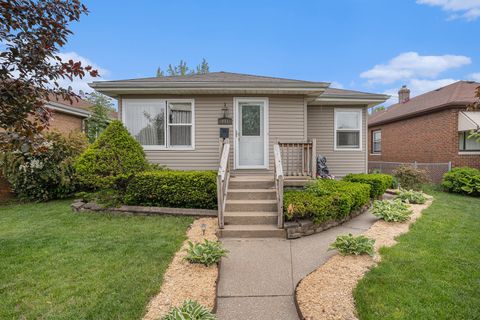
1387 Price Ave, Calumet City, IL 60409
$12
Cash flow
0.4%
Cash-on-Cash Return
5.8%
Cap rate
1.3%
Rent to Value Ratio
Active
$399,900
2
bds
|
2
ba
|
1,700
sqft
|
built
2006
1 Itasca Pl, Itasca, IL 60143
$-980
Cash flow
-12.8%
Cash-on-Cash Return
2.7%
Cap rate
0.7%
Rent to Value Ratio
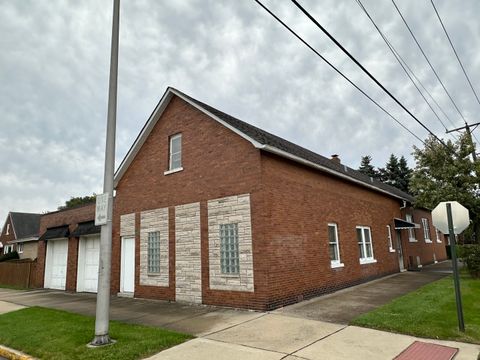
Active
$359,900
3
bds
|
2
ba
|
2,000
sqft
|
built
1923
785 Alice St, Chicago Heights, IL 60411
$-375
Cash flow
-5.4%
Cash-on-Cash Return
4.4%
Cap rate
0.6%
Rent to Value Ratio
Active
$195,000
5
bds
|
2
ba
|
0
sqft
|
built
1885
727 N Springfield Ave, Chicago, IL 60624
$225
Cash flow
6.0%
Cash-on-Cash Return
7.1%
Cap rate
0.9%
Rent to Value Ratio
Active
$499,500
4
bds
|
4
ba
|
0
sqft
|
built
1888
3233 S Morgan St, Chicago, IL 60608
$-1,603
Cash flow
-16.7%
Cash-on-Cash Return
1.8%
Cap rate
0.5%
Rent to Value Ratio
Active
$285,000
6
bds
|
4
ba
|
0
sqft
|
built
1889
2823 W Flournoy St, Chicago, IL 60612
$22
Cash flow
0.4%
Cash-on-Cash Return
5.8%
Cap rate
0.8%
Rent to Value Ratio
Active
$289,000
6
bds
|
2
ba
|
0
sqft
|
built
1893
817 W 54th St, Chicago, IL 60609
$43
Cash flow
0.8%
Cash-on-Cash Return
5.9%
Cap rate
0.8%
Rent to Value Ratio

Active
$275,000
8
bds
|
5
ba
|
0
sqft
|
built
1969
381 Yates Ave, Calumet City, IL 60409
$-1,031
Cash flow
-19.6%
Cash-on-Cash Return
1.2%
Cap rate
0.7%
Rent to Value Ratio
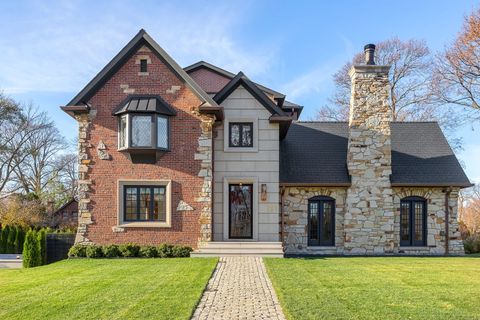
Active
$1,599,999
5
bds
|
6
ba
|
5,819
sqft
|
built
1953
3464 Old Mill Rd, Highland Park, IL 60035
$-6,324
Cash flow
-20.6%
Cash-on-Cash Return
0.9%
Cap rate
0.4%
Rent to Value Ratio
Active
$595,000
9
bds
|
6
ba
|
0
sqft
|
built
1905
741 N Christiana Ave, Chicago, IL 60624
$-1,957
Cash flow
-17.2%
Cash-on-Cash Return
1.7%
Cap rate
0.4%
Rent to Value Ratio
Active
$329,000
3
bds
|
2
ba
|
1,008
sqft
|
built
1957
4531 S Lawler Ave, Chicago, IL 60638
$-73
Cash flow
-1.2%
Cash-on-Cash Return
5.4%
Cap rate
0.8%
Rent to Value Ratio
Active
$185,000
3
bds
|
1
ba
|
1,280
sqft
|
built
1898
1970 E 170th St, South Holland, IL 60473
$362
Cash flow
10.2%
Cash-on-Cash Return
8.0%
Cap rate
1.4%
Rent to Value Ratio

Active
$175,000
2
bds
|
2
ba
|
1,620
sqft
|
built
1968
10048 S Pulaski Rd, Oak Lawn, IL 60453
$206
Cash flow
6.1%
Cash-on-Cash Return
7.1%
Cap rate
1.1%
Rent to Value Ratio
Active
$149,900
4
bds
|
2
ba
|
0
sqft
|
built
1920
247 E 24th St, Chicago Heights, IL 60411
$177
Cash flow
6.2%
Cash-on-Cash Return
7.1%
Cap rate
1.1%
Rent to Value Ratio
Active
$530,000
5
bds
|
3
ba
|
0
sqft
|
built
1890
523 E 41st St, Chicago, IL 60653
$-1,001
Cash flow
-9.9%
Cash-on-Cash Return
3.4%
Cap rate
0.5%
Rent to Value Ratio
Active
$259,900
3
bds
|
2
ba
|
1,164
sqft
|
built
1952
991 Wentworth Ave, Calumet City, IL 60409
$-204
Cash flow
-4.1%
Cash-on-Cash Return
4.7%
Cap rate
0.8%
Rent to Value Ratio
Active
$1,390,000
2
bds
|
3
ba
|
0
sqft
|
built
1929
159 E Walton Pl, Chicago, IL 60611
$-7,119
Cash flow
-26.7%
Cash-on-Cash Return
-0.5%
Cap rate
0.4%
Rent to Value Ratio
Active
$107,000
2
bds
|
1
ba
|
690
sqft
|
built
1970
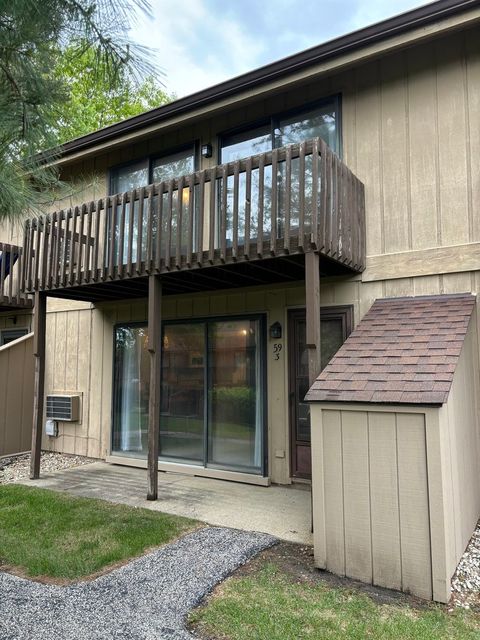
59 Vail Colony, Fox Lake, IL 60020
$-239
Cash flow
-11.7%
Cash-on-Cash Return
3.0%
Cap rate
1.3%
Rent to Value Ratio
Active
$700,000
4
bds
|
2
ba
|
2,211
sqft
|
built
1953
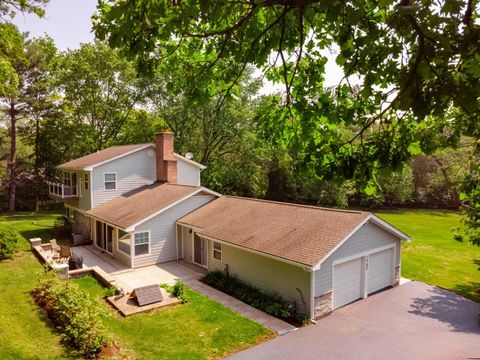
1762 Palatine Rd, Inverness, IL 60067
$-1,759
Cash flow
-13.1%
Cash-on-Cash Return
2.7%
Cap rate
0.5%
Rent to Value Ratio

Active
$250,000
1
bds
|
1
ba
|
0
sqft
|
built
1972
1221 N Dearborn St, Chicago, IL 60610
$-616
Cash flow
-12.9%
Cash-on-Cash Return
2.7%
Cap rate
0.9%
Rent to Value Ratio
Active
$1,400,000
4
bds
|
4
ba
|
6,551
sqft
|
built
2004
20719 Highview Rd, Marengo, IL 60152
$-2,936
Cash flow
-10.9%
Cash-on-Cash Return
3.2%
Cap rate
0.5%
Rent to Value Ratio
Active
$274,900
2
bds
|
2
ba
|
1,200
sqft
|
built
1928
3713 Grand Blvd, Brookfield, IL 60513
$-671
Cash flow
-12.7%
Cash-on-Cash Return
2.8%
Cap rate
0.8%
Rent to Value Ratio
Active
$275,000
6
bds
|
2
ba
|
0
sqft
|
built
1901
801 S Kedvale Ave, Chicago, IL 60624
$-218
Cash flow
-4.1%
Cash-on-Cash Return
4.7%
Cap rate
0.7%
Rent to Value Ratio
Active
$119,900
3
bds
|
1
ba
|
1,336
sqft
|
built
1940
403 W Van Buren St, Belleville, IL 62220
$171
Cash flow
7.4%
Cash-on-Cash Return
7.4%
Cap rate
1.2%
Rent to Value Ratio
Active
$275,000
5
bds
|
2
ba
|
0
sqft
|
built
1888
217 N Kostner Ave, Chicago, IL 60624
$-62
Cash flow
-1.2%
Cash-on-Cash Return
5.4%
Cap rate
0.7%
Rent to Value Ratio
Active
$394,999
5
bds
|
2
ba
|
2,393
sqft
|
built
1907
1100 S 3rd Ave, Maywood, IL 60153
$-859
Cash flow
-11.3%
Cash-on-Cash Return
3.1%
Cap rate
0.6%
Rent to Value Ratio

Active
$1,350,000
6
bds
|
5
ba
|
0
sqft
|
built
1917
2741 Eastwood Ave, Evanston, IL 60201
$-5,640
Cash flow
-21.8%
Cash-on-Cash Return
0.7%
Cap rate
0.3%
Rent to Value Ratio
Active
$315,000
2
bds
|
2
ba
|
1,300
sqft
|
built
1974
5455 N Sheridan Rd, Chicago, IL 60640
$-1,254
Cash flow
-20.8%
Cash-on-Cash Return
0.9%
Cap rate
0.9%
Rent to Value Ratio