Illinois Investment Properties for Sale
Browse homes for sale and investment properties in Illinois. Refine your search by price, property type, or more.
Best cash flowing properties in Illinois
Active
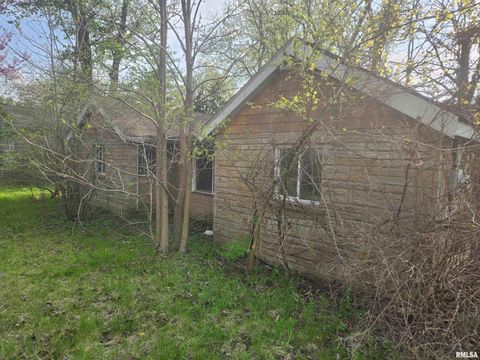
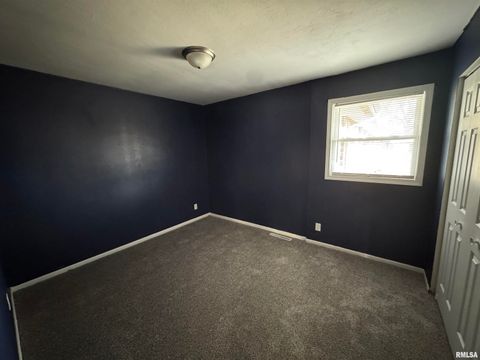
$69,500
3
bds
|
0
ba
|
1,108
sqft
|
built
1949
9915 N Blacksoil Ln, Peoria, IL 61615
$1,033
Cash flow
17.3%
Cash-on-Cash Return
17.8%
Cap rate
2.3%
Rent to Value Ratio

Active
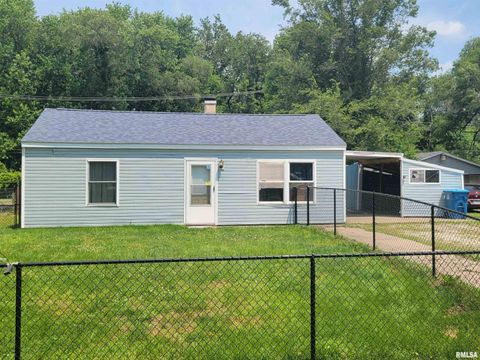
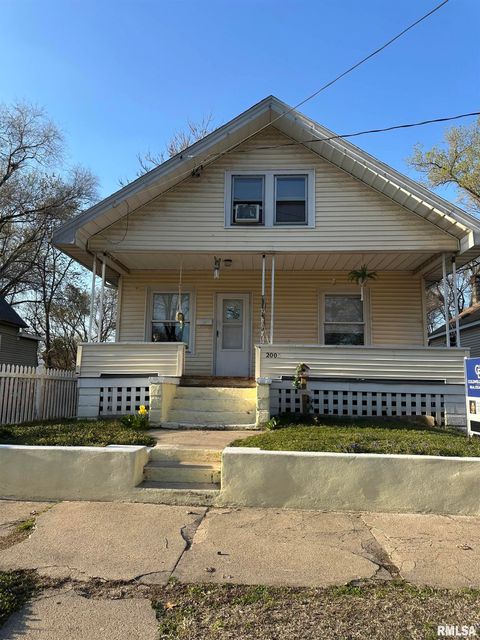
$14,900
3
bds
|
1
ba
|
864
sqft
|
built
1920
2502 W Malone St, Peoria, IL 61605
$794
Cash flow
62.1%
Cash-on-Cash Return
63.9%
Cap rate
8.1%
Rent to Value Ratio
9,442 out of 17,248 properties for sale in Illinois
Limited Results Shown
Create a free account, or log in to reveal all property listings and enjoy the complete experience.

Active
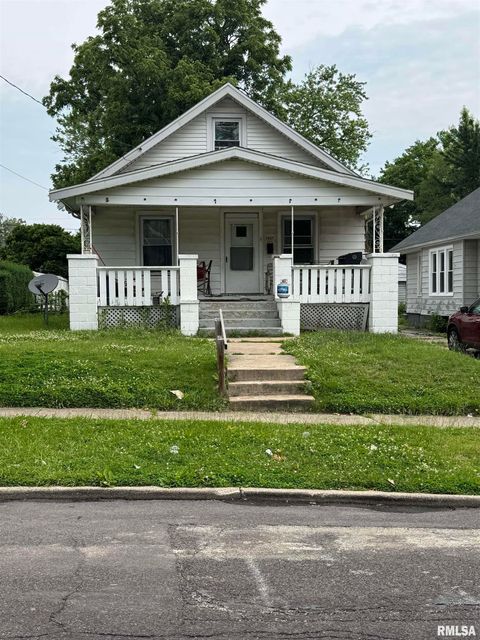
$124,000
1
bds
|
2
ba
|
1,206
sqft
|
built
1984
123 SW Jefferson Ave, Peoria, IL 61602
$126
Cash flow
5.3%
Cash-on-Cash Return
6.9%
Cap rate
1.3%
Rent to Value Ratio

Active
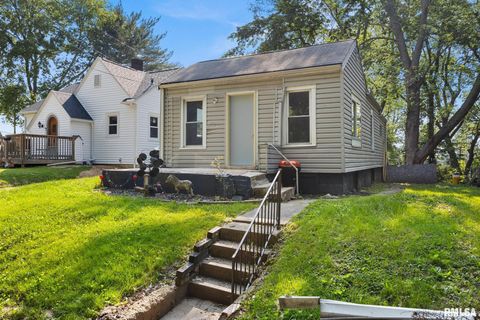
$237,500
2
bds
|
2
ba
|
1,541
sqft
|
built
1990
5200 N Knoxville Ave, Peoria, IL 61614
$-242
Cash flow
-5.3%
Cash-on-Cash Return
4.5%
Cap rate
0.8%
Rent to Value Ratio

Active
$139,900
3
bds
|
1
ba
|
1,008
sqft
|
built
1907
1210 Mechanic St, Pekin, IL 61554
$-108
Cash flow
-4.0%
Cash-on-Cash Return
4.8%
Cap rate
0.6%
Rent to Value Ratio

Active
$177,400
3
bds
|
3
ba
|
1,319
sqft
|
built
1907
2612 7th St, Moline, IL 61265
$152
Cash flow
4.5%
Cash-on-Cash Return
6.7%
Cap rate
1.0%
Rent to Value Ratio

Active
$40,000
2
bds
|
1
ba
|
748
sqft
|
built
1921
910 W Virginia Ave, Peoria, IL 61604
$617
Cash flow
18.0%
Cash-on-Cash Return
18.5%
Cap rate
2.8%
Rent to Value Ratio

Active
$899,000
4
bds
|
5
ba
|
8,577
sqft
|
built
1997
200 W Ravinwoods Rd, Peoria, IL 61615
$-5,449
Cash flow
-31.6%
Cash-on-Cash Return
-1.6%
Cap rate
0.3%
Rent to Value Ratio

Active
$41,500
1
bds
|
1
ba
|
518
sqft
|
built
1920
641 18th Ave, East Moline, IL 61244
$365
Cash flow
10.2%
Cash-on-Cash Return
10.6%
Cap rate
1.7%
Rent to Value Ratio

Active
$480,000
3
bds
|
4
ba
|
2,328
sqft
|
built
2006
1008 S High St, Port Byron, IL 61275
$-1,013
Cash flow
-11.0%
Cash-on-Cash Return
3.1%
Cap rate
0.6%
Rent to Value Ratio
Active
$98,000
2
bds
|
1
ba
|
863
sqft
|
built
1955
17013 10th Ave N, East Moline, IL 61244
$256
Cash flow
13.6%
Cash-on-Cash Return
8.8%
Cap rate
1.2%
Rent to Value Ratio

Active
$799,000
4
bds
|
7
ba
|
7,667
sqft
|
built
2001
3113 W Summerbend Ct, Peoria, IL 61615
$-3,699
Cash flow
-24.2%
Cash-on-Cash Return
0.1%
Cap rate
0.4%
Rent to Value Ratio

Active
$174,500
4
bds
|
3
ba
|
1,781
sqft
|
built
1977
13014 N Crater Ln, Dunlap, IL 61525
$315
Cash flow
9.4%
Cash-on-Cash Return
7.8%
Cap rate
1.3%
Rent to Value Ratio

Active
$125,000
5
bds
|
2
ba
|
2,078
sqft
|
built
1904
837 19th Ave, Moline, IL 61265
$250
Cash flow
10.4%
Cash-on-Cash Return
8.1%
Cap rate
1.3%
Rent to Value Ratio
Active
$89,900
3
bds
|
1
ba
|
2,153
sqft
|
built
1920
1207 W Mc Clure Ave, Peoria, IL 61604
$312
Cash flow
18.1%
Cash-on-Cash Return
9.8%
Cap rate
1.4%
Rent to Value Ratio

Active
$199,900
4
bds
|
2
ba
|
1,641
sqft
|
built
1972
908 16th St, Port Byron, IL 61275
$-137
Cash flow
-3.6%
Cash-on-Cash Return
4.9%
Cap rate
0.9%
Rent to Value Ratio
Active
$42,000
2
bds
|
1
ba
|
576
sqft
|
built
1930
3620 NE Brevis St, Peoria, IL 61603
$478
Cash flow
13.3%
Cash-on-Cash Return
13.7%
Cap rate
1.9%
Rent to Value Ratio
Active
$245,000
bds
|
0
ba
|
0
sqft
|
built
1972
413 Saint Julian St, Pekin, IL 61554
$-225
Cash flow
-4.8%
Cash-on-Cash Return
4.6%
Cap rate
0.8%
Rent to Value Ratio

Active
$145,000
2
bds
|
1
ba
|
903
sqft
|
built
1928
3117 25th Ave, Rock Island, IL 61201
$-54
Cash flow
-1.9%
Cash-on-Cash Return
5.2%
Cap rate
0.9%
Rent to Value Ratio

Active
$359,900
5
bds
|
3
ba
|
2,501
sqft
|
built
2000
1647 W Geneva Rd, Peoria, IL 61615
$-567
Cash flow
-8.2%
Cash-on-Cash Return
3.8%
Cap rate
0.7%
Rent to Value Ratio
Active
$65,000
4
bds
|
1
ba
|
1,324
sqft
|
built
1915
2005 W Antoinette St, Peoria, IL 61605
$761
Cash flow
13.6%
Cash-on-Cash Return
14.0%
Cap rate
1.8%
Rent to Value Ratio

Active
$94,900
3
bds
|
2
ba
|
1,722
sqft
|
built
1878
1007 29th St, Moline, IL 61265
$344
Cash flow
18.9%
Cash-on-Cash Return
10.0%
Cap rate
1.5%
Rent to Value Ratio

Active
$179,500
2
bds
|
1
ba
|
1,040
sqft
|
built
1931
2042 S Douglas Ave, Springfield, IL 62704
$-61
Cash flow
-1.8%
Cash-on-Cash Return
5.3%
Cap rate
0.9%
Rent to Value Ratio
Active
$69,500
3
bds
|
0
ba
|
1,108
sqft
|
built
1949
9915 N Blacksoil Ln, Peoria, IL 61615
$1,033
Cash flow
17.3%
Cash-on-Cash Return
17.8%
Cap rate
2.3%
Rent to Value Ratio

Active
$359,000
3
bds
|
3
ba
|
2,228
sqft
|
built
1968
4414 37th Ave, Rock Island, IL 61201
$-1,087
Cash flow
-15.8%
Cash-on-Cash Return
2.0%
Cap rate
0.4%
Rent to Value Ratio
Active
$14,900
3
bds
|
1
ba
|
864
sqft
|
built
1920
2502 W Malone St, Peoria, IL 61605
$794
Cash flow
62.1%
Cash-on-Cash Return
63.9%
Cap rate
8.1%
Rent to Value Ratio

Active
$129,900
2
bds
|
2
ba
|
1,880
sqft
|
built
1998
3802 W Richwoods Blvd, Peoria, IL 61615
$94
Cash flow
3.8%
Cash-on-Cash Return
6.5%
Cap rate
1.1%
Rent to Value Ratio
Active
$149,900
bds
|
0
ba
|
0
sqft
|
built
1956
500 127th Ave, Milan, IL 61264
$-142
Cash flow
-4.9%
Cash-on-Cash Return
4.5%
Cap rate
0.7%
Rent to Value Ratio

Active
$291,300
3
bds
|
2
ba
|
3,600
sqft
|
built
1908
15413 N State Route 91, Dunlap, IL 61525
$-115
Cash flow
-2.1%
Cash-on-Cash Return
5.2%
Cap rate
0.8%
Rent to Value Ratio

Active
$30,000
2
bds
|
1
ba
|
758
sqft
|
built
1918
1320 Meadow Ave, East Peoria, IL 61611
$520
Cash flow
20.2%
Cash-on-Cash Return
20.8%
Cap rate
2.7%
Rent to Value Ratio

Active
$89,900
bds
|
0
ba
|
0
sqft
|
built
1934
4626 12th St, Rock Island, IL 61201
$190
Cash flow
11.0%
Cash-on-Cash Return
8.2%
Cap rate
1.2%
Rent to Value Ratio
Active
$30,000
2
bds
|
1
ba
|
1,525
sqft
|
built
1927
1400 E Chestnut St, Canton, IL 61520
$750
Cash flow
29.1%
Cash-on-Cash Return
30.0%
Cap rate
4.0%
Rent to Value Ratio
Active
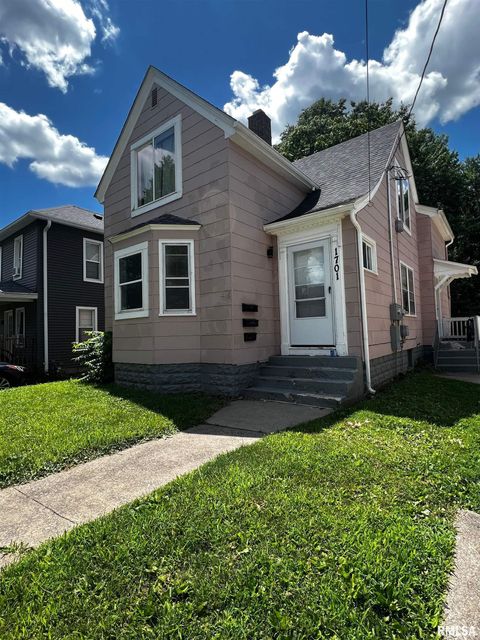
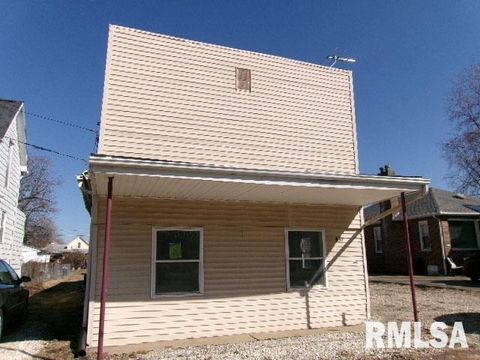
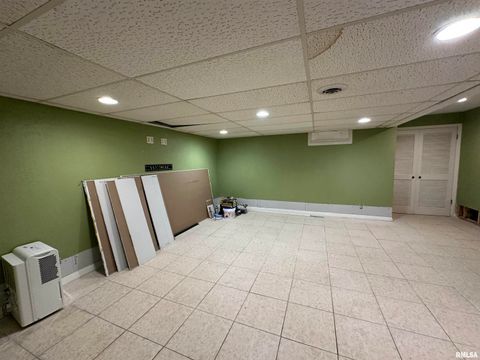
$125,000
3
bds
|
0
ba
|
0
sqft
|
built
1900
1701 2nd St, Moline, IL 61265
$112
Cash flow
4.7%
Cash-on-Cash Return
6.8%
Cap rate
1.1%
Rent to Value Ratio

Active
$254,900
4
bds
|
2
ba
|
1,945
sqft
|
built
1977
1529 W Richmar Rd, Peoria, IL 61615
$-352
Cash flow
-7.2%
Cash-on-Cash Return
4.0%
Cap rate
0.7%
Rent to Value Ratio

Active
$175,000
4
bds
|
2
ba
|
2,766
sqft
|
built
1899
814 W Edwards St, Springfield, IL 62704
$423
Cash flow
12.6%
Cash-on-Cash Return
8.6%
Cap rate
1.3%
Rent to Value Ratio

Active
$90,990
2
bds
|
1
ba
|
1,023
sqft
|
built
1973
6831 N Frostwood Pkwy, Peoria, IL 61615
$229
Cash flow
13.1%
Cash-on-Cash Return
8.7%
Cap rate
1.3%
Rent to Value Ratio

Active
$72,900
2
bds
|
1
ba
|
672
sqft
|
built
1938
129 Pierson St, East Peoria, IL 61611
$525
Cash flow
8.4%
Cash-on-Cash Return
8.6%
Cap rate
1.4%
Rent to Value Ratio
Active
$52,000
2
bds
|
1
ba
|
1,152
sqft
|
built
1890
837 E Chestnut St, Canton, IL 61520
$739
Cash flow
16.6%
Cash-on-Cash Return
17.1%
Cap rate
2.5%
Rent to Value Ratio
Active
$360,000
4
bds
|
3
ba
|
3,541
sqft
|
built
1966
202 W Wolf Rd, Peoria, IL 61614
$-601
Cash flow
-8.7%
Cash-on-Cash Return
3.7%
Cap rate
0.7%
Rent to Value Ratio

Active
$112,500
3
bds
|
1
ba
|
1,211
sqft
|
built
1956
1407 Lincoln St, Pekin, IL 61554
$498
Cash flow
23.1%
Cash-on-Cash Return
11.0%
Cap rate
1.4%
Rent to Value Ratio

Active
$259,900
3
bds
|
2
ba
|
1,433
sqft
|
built
1957
5004 N University St, Peoria, IL 61614
$-404
Cash flow
-8.1%
Cash-on-Cash Return
3.8%
Cap rate
0.7%
Rent to Value Ratio
Active
$340,000
3
bds
|
2
ba
|
2,378
sqft
|
built
1948
8300 Route 150, Coal Valley, IL 61240
$7
Cash flow
0.1%
Cash-on-Cash Return
5.7%
Cap rate
0.7%
Rent to Value Ratio