Illinois Investment Properties for Sale
Browse homes for sale and investment properties in Illinois. Refine your search by price, property type, or more.
Best cash flowing properties in Illinois

Active
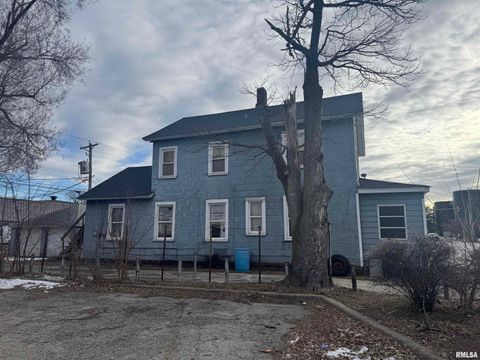
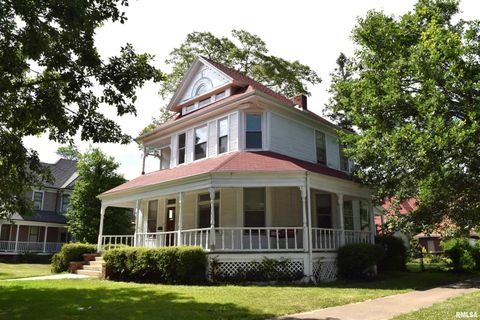
$142,900
bds
|
0
ba
|
0
sqft
|
built
1898
1127 N 6th St, Springfield, IL 62702
$965
Cash flow
35.2%
Cash-on-Cash Return
13.8%
Cap rate
1.7%
Rent to Value Ratio
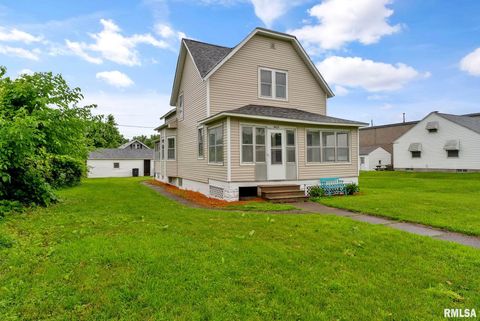
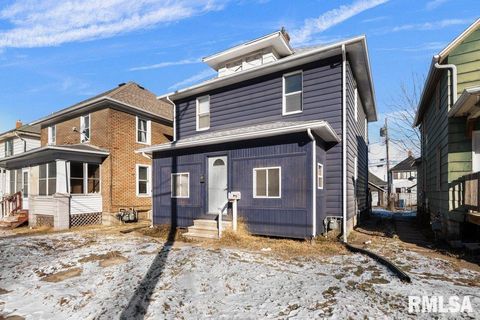
Active
$49,500
bds
|
0
ba
|
0
sqft
|
built
1907
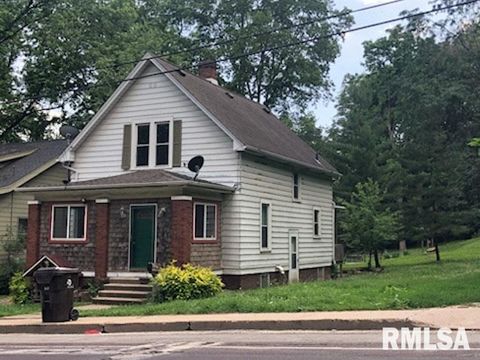
417 Ann Eliza St, Pekin, IL 61554
$904
Cash flow
21.3%
Cash-on-Cash Return
21.9%
Cap rate
3.2%
Rent to Value Ratio
9,306 out of 17,344 properties for sale in Illinois
Limited Results Shown
Create a free account, or log in to reveal all property listings and enjoy the complete experience.

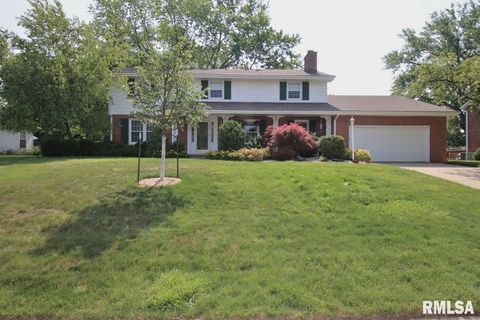
Active
$65,000
1
bds
|
1
ba
|
684
sqft
|
built
1915
926 10th Ave, Rock Island, IL 61201
$536
Cash flow
9.6%
Cash-on-Cash Return
9.9%
Cap rate
1.4%
Rent to Value Ratio
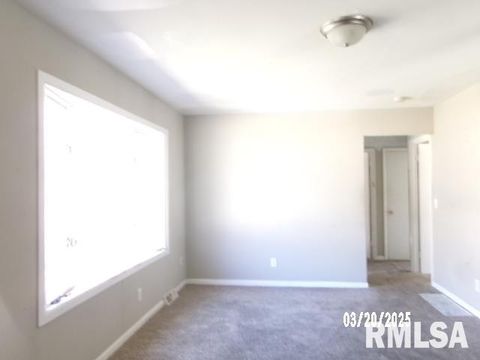
Active
$160,000
3
bds
|
1
ba
|
1,530
sqft
|
built
1900
5423 3rd Ave, Moline, IL 61265
$-21
Cash flow
-0.7%
Cash-on-Cash Return
5.5%
Cap rate
0.9%
Rent to Value Ratio

Active
$124,900
2
bds
|
1
ba
|
1,180
sqft
|
built
1920
4429 16th Ave, Rock Island, IL 61201
$220
Cash flow
9.2%
Cash-on-Cash Return
7.8%
Cap rate
1.1%
Rent to Value Ratio

Active
$69,999
2
bds
|
1
ba
|
912
sqft
|
built
1920
1204 W Virginia Ave, Peoria, IL 61604
$688
Cash flow
11.5%
Cash-on-Cash Return
11.8%
Cap rate
1.7%
Rent to Value Ratio

Active
$46,500
4
bds
|
2
ba
|
2,188
sqft
|
built
1910
1043 19th St, Rock Island, IL 61201
$696
Cash flow
17.4%
Cash-on-Cash Return
18.0%
Cap rate
3.0%
Rent to Value Ratio

Active
$100,000
2
bds
|
1
ba
|
1,045
sqft
|
built
1938
3405 9th St, Rock Island, IL 61201
$32
Cash flow
1.7%
Cash-on-Cash Return
6.1%
Cap rate
1.0%
Rent to Value Ratio

Active
$69,900
2
bds
|
1
ba
|
1,082
sqft
|
built
1945
1816 S Street Ct, Springfield, IL 62703
$652
Cash flow
10.9%
Cash-on-Cash Return
11.2%
Cap rate
1.6%
Rent to Value Ratio

Active
$194,500
4
bds
|
2
ba
|
2,100
sqft
|
built
1940
2226 24 1/2 St, Rock Island, IL 61201
$-276
Cash flow
-7.4%
Cash-on-Cash Return
4.0%
Cap rate
0.7%
Rent to Value Ratio

Active
$238,500
3
bds
|
2
ba
|
1,935
sqft
|
built
1968
12323 Niabi Zoo Rd, Coal Valley, IL 61240
$-232
Cash flow
-5.1%
Cash-on-Cash Return
4.5%
Cap rate
0.7%
Rent to Value Ratio

Active
$163,000
2
bds
|
2
ba
|
1,736
sqft
|
built
1920
2205 N North St, Peoria, IL 61604
$126
Cash flow
4.0%
Cash-on-Cash Return
6.6%
Cap rate
1.0%
Rent to Value Ratio

Active
$239,900
4
bds
|
2
ba
|
2,096
sqft
|
built
1951
245 N 1800th Ave, Coal Valley, IL 61240
$-28
Cash flow
-0.6%
Cash-on-Cash Return
5.5%
Cap rate
1.0%
Rent to Value Ratio
Active
$49,500
bds
|
0
ba
|
0
sqft
|
built
1907
417 Ann Eliza St, Pekin, IL 61554
$904
Cash flow
21.3%
Cash-on-Cash Return
21.9%
Cap rate
3.2%
Rent to Value Ratio

Active
$58,900
2
bds
|
1
ba
|
904
sqft
|
built
1946
3005 W Ann St, Peoria, IL 61605
$617
Cash flow
12.2%
Cash-on-Cash Return
12.6%
Cap rate
1.7%
Rent to Value Ratio

Active
$70,000
2
bds
|
1
ba
|
984
sqft
|
built
1920
1020 N Walnut St, Springfield, IL 62702
$614
Cash flow
10.2%
Cash-on-Cash Return
10.5%
Cap rate
1.6%
Rent to Value Ratio
Active
$315,000
4
bds
|
4
ba
|
3,376
sqft
|
built
1963
5926 N Sherwood Ave, Peoria, IL 61614
$-426
Cash flow
-7.1%
Cash-on-Cash Return
4.1%
Cap rate
0.8%
Rent to Value Ratio

Active
$549,900
5
bds
|
4
ba
|
4,244
sqft
|
built
1989
11417 N State Route 91, Dunlap, IL 61525
$-1,541
Cash flow
-14.6%
Cash-on-Cash Return
2.3%
Cap rate
0.5%
Rent to Value Ratio

Active
$160,000
3
bds
|
2
ba
|
1,372
sqft
|
built
1893
1156 23rd St, Moline, IL 61265
$-49
Cash flow
-1.6%
Cash-on-Cash Return
5.3%
Cap rate
0.8%
Rent to Value Ratio
Active
$110,000
4
bds
|
1
ba
|
1,149
sqft
|
built
1964
2022 Windsor St, Pekin, IL 61554
$424
Cash flow
20.1%
Cash-on-Cash Return
10.3%
Cap rate
1.5%
Rent to Value Ratio

Active
$319,900
4
bds
|
4
ba
|
3,690
sqft
|
built
1986
14098 Aspen Dr, Carlinville, IL 62626
$-901
Cash flow
-14.7%
Cash-on-Cash Return
2.3%
Cap rate
0.5%
Rent to Value Ratio

Active
$64,000
2
bds
|
1
ba
|
836
sqft
|
built
1924
1017 W Brons Ave, Peoria, IL 61604
$511
Cash flow
9.3%
Cash-on-Cash Return
9.6%
Cap rate
1.4%
Rent to Value Ratio
Active
$189,900
4
bds
|
2
ba
|
1,842
sqft
|
built
1900
1503 W Callender Ave, Peoria, IL 61606
$-114
Cash flow
-3.1%
Cash-on-Cash Return
5.0%
Cap rate
0.8%
Rent to Value Ratio

Active
$80,000
2
bds
|
1
ba
|
937
sqft
|
built
1910
1621 14 1/2 St, Rock Island, IL 61201
$241
Cash flow
15.7%
Cash-on-Cash Return
9.3%
Cap rate
1.4%
Rent to Value Ratio

Active
$259,900
3
bds
|
2
ba
|
1,700
sqft
|
built
1977
6403 N Talisman Ter, Peoria, IL 61615
$-514
Cash flow
-10.3%
Cash-on-Cash Return
3.3%
Cap rate
0.7%
Rent to Value Ratio
Active
$142,900
bds
|
0
ba
|
0
sqft
|
built
1898
1127 N 6th St, Springfield, IL 62702
$965
Cash flow
35.2%
Cash-on-Cash Return
13.8%
Cap rate
1.7%
Rent to Value Ratio

Active
$59,000
2
bds
|
1
ba
|
1,000
sqft
|
built
1910
232 N James Ave, Centralia, IL 62801
$690
Cash flow
13.6%
Cash-on-Cash Return
14.0%
Cap rate
1.7%
Rent to Value Ratio

Active
$85,000
3
bds
|
1
ba
|
1,590
sqft
|
built
1950
1908 S 15th St, Springfield, IL 62703
$256
Cash flow
15.7%
Cash-on-Cash Return
9.3%
Cap rate
1.3%
Rent to Value Ratio

Active
$425,000
4
bds
|
4
ba
|
4,114
sqft
|
built
1965
1517 40th Avenue Ct, Rock Island, IL 61201
$-495
Cash flow
-6.1%
Cash-on-Cash Return
4.3%
Cap rate
0.8%
Rent to Value Ratio

Active
$118,900
3
bds
|
2
ba
|
1,022
sqft
|
built
1975
6500 N Allen Rd, Peoria, IL 61614
$219
Cash flow
9.6%
Cash-on-Cash Return
7.9%
Cap rate
1.0%
Rent to Value Ratio
Active
$120,000
bds
|
0
ba
|
0
sqft
|
built
1920
1415 18th Ave, East Moline, IL 61244
$336
Cash flow
14.6%
Cash-on-Cash Return
9.0%
Cap rate
1.3%
Rent to Value Ratio

Active
$64,900
2
bds
|
1
ba
|
816
sqft
|
built
1932
659 Dean Ct, Canton, IL 61520
$529
Cash flow
9.5%
Cash-on-Cash Return
9.8%
Cap rate
1.4%
Rent to Value Ratio

Active
$325,000
3
bds
|
3
ba
|
1,960
sqft
|
built
1990
3513 33rd Street Ct, Moline, IL 61265
$-786
Cash flow
-12.6%
Cash-on-Cash Return
2.8%
Cap rate
0.6%
Rent to Value Ratio
Active
$60,000
1
bds
|
1
ba
|
568
sqft
|
built
1976
6831 N Frostwood Pkwy, Peoria, IL 61615
$801
Cash flow
15.6%
Cash-on-Cash Return
16.0%
Cap rate
2.2%
Rent to Value Ratio
Active
$134,900
2
bds
|
2
ba
|
986
sqft
|
built
1984
123 SW Jefferson Ave, Peoria, IL 61602
$-146
Cash flow
-5.6%
Cash-on-Cash Return
5.0%
Cap rate
1.0%
Rent to Value Ratio
Active
$269,900
5
bds
|
3
ba
|
2,877
sqft
|
built
1937
3307 N Biltmore Ave, Peoria, IL 61604
$-399
Cash flow
-7.7%
Cash-on-Cash Return
4.5%
Cap rate
0.8%
Rent to Value Ratio
Active
$77,500
2
bds
|
1
ba
|
1,360
sqft
|
built
1920
805 Abington St, Peoria, IL 61603
$404
Cash flow
27.2%
Cash-on-Cash Return
12.5%
Cap rate
1.7%
Rent to Value Ratio
Active
$359,900
4
bds
|
4
ba
|
3,094
sqft
|
built
1995
5408 N Rothmere Dr, Peoria, IL 61615
$-805
Cash flow
-11.7%
Cash-on-Cash Return
3.6%
Cap rate
0.7%
Rent to Value Ratio
Active
$135,500
3
bds
|
2
ba
|
1,250
sqft
|
built
1940
3121 N Isabell Ave, Peoria, IL 61604
$167
Cash flow
6.4%
Cash-on-Cash Return
7.7%
Cap rate
1.2%
Rent to Value Ratio
Active
$124,900
3
bds
|
2
ba
|
1,571
sqft
|
built
1965
728 S Pleasant St, Peoria, IL 61604
$255
Cash flow
10.7%
Cash-on-Cash Return
8.7%
Cap rate
1.3%
Rent to Value Ratio
Active
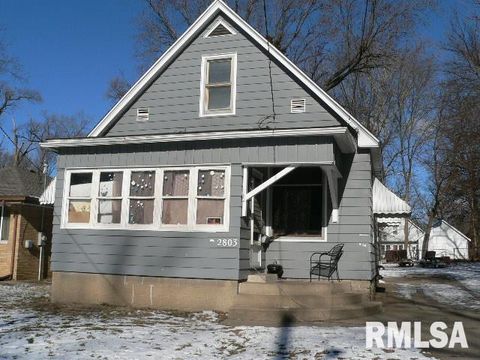
$32,500
2
bds
|
1
ba
|
1,202
sqft
|
built
1920
2803 W Fremont St, Peoria, IL 61605
$786
Cash flow
28.2%
Cash-on-Cash Return
29.0%
Cap rate
4.0%
Rent to Value Ratio
Active
$299,900
3
bds
|
4
ba
|
3,158
sqft
|
built
1985
2524 Greenbriar Rd, Springfield, IL 62704
$-805
Cash flow
-14.0%
Cash-on-Cash Return
3.0%
Cap rate
0.5%
Rent to Value Ratio