Illinois Investment Properties for Sale
Browse homes for sale and investment properties in Illinois. Refine your search by price, property type, or more.
Best cash flowing properties in Illinois

Active
$64,900
bds
|
0
ba
|
0
sqft
|
built
1890
1502 S Pasfield St, Springfield, IL 62704
$1,024
Cash flow
18.4%
Cash-on-Cash Return
18.9%
Cap rate
2.6%
Rent to Value Ratio
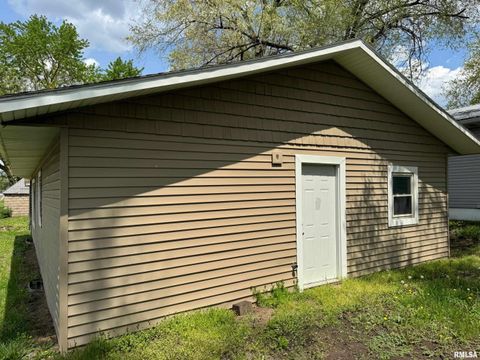
Active
$27,500
3
bds
|
2
ba
|
1,520
sqft
|
built
1907
231 Cooper St, Pekin, IL 61554
$1,002
Cash flow
42.5%
Cash-on-Cash Return
43.7%
Cap rate
5.5%
Rent to Value Ratio
9,292 out of 17,318 properties for sale in Illinois
Limited Results Shown
Create a free account, or log in to reveal all property listings and enjoy the complete experience.

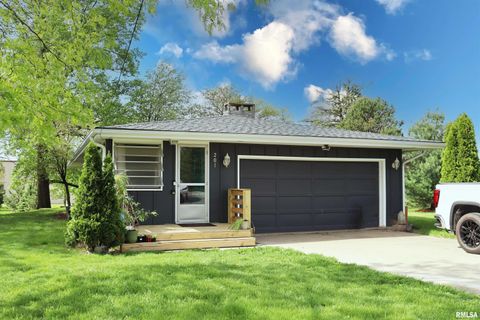
Active
$36,000
1
bds
|
1
ba
|
733
sqft
|
built
1927
2712 47th Ave, Rock Island, IL 61201
$573
Cash flow
18.5%
Cash-on-Cash Return
19.1%
Cap rate
2.8%
Rent to Value Ratio

Active
$39,900
2
bds
|
1
ba
|
944
sqft
|
built
1920
2918 NE Madison Ave, Peoria, IL 61603
$728
Cash flow
21.3%
Cash-on-Cash Return
21.9%
Cap rate
2.8%
Rent to Value Ratio
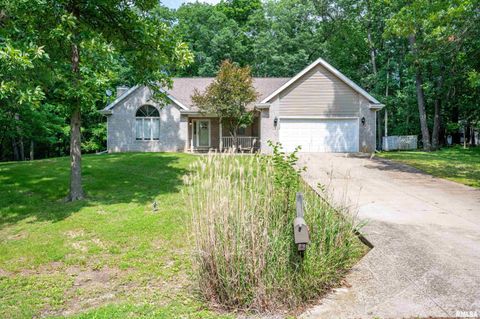
Active
$794,000
3
bds
|
2
ba
|
1,416
sqft
|
built
1960
201 Willa Ln, Washington, IL 61571
$-2,733
Cash flow
-18.0%
Cash-on-Cash Return
1.5%
Cap rate
0.2%
Rent to Value Ratio

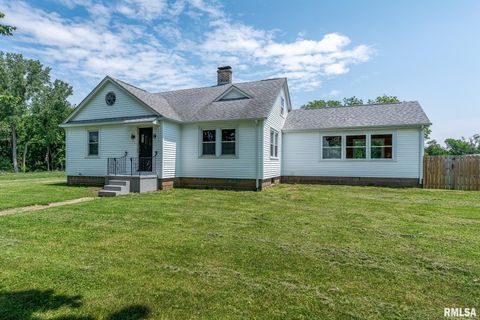
Active
$98,400
3
bds
|
1
ba
|
896
sqft
|
built
1960
109 N 19th St, Pekin, IL 61554
$253
Cash flow
13.4%
Cash-on-Cash Return
8.8%
Cap rate
1.3%
Rent to Value Ratio

Active
$114,000
3
bds
|
1
ba
|
1,282
sqft
|
built
1945
1025 E Corrington Ave, Peoria, IL 61603
$324
Cash flow
14.8%
Cash-on-Cash Return
9.1%
Cap rate
1.4%
Rent to Value Ratio

Active
$179,800
3
bds
|
2
ba
|
2,688
sqft
|
built
1960
6006 N Big Hollow Rd, Peoria, IL 61615
$81
Cash flow
2.4%
Cash-on-Cash Return
6.2%
Cap rate
0.9%
Rent to Value Ratio

Active
$699,000
5
bds
|
4
ba
|
5,679
sqft
|
built
1920
1044 Williams Blvd, Springfield, IL 62704
$-3,690
Cash flow
-27.5%
Cash-on-Cash Return
-0.7%
Cap rate
0.3%
Rent to Value Ratio

Active
$77,000
bds
|
0
ba
|
0
sqft
|
built
1909
2947 13th Ave, Rock Island, IL 61201
$175
Cash flow
11.9%
Cash-on-Cash Return
8.4%
Cap rate
1.4%
Rent to Value Ratio

Active
$439,900
4
bds
|
5
ba
|
3,083
sqft
|
built
1986
7 Marshall Ct, Springfield, IL 62712
$-1,388
Cash flow
-16.5%
Cash-on-Cash Return
1.9%
Cap rate
0.4%
Rent to Value Ratio

Active
$124,900
2
bds
|
1
ba
|
1,020
sqft
|
built
1945
2336 24 1/2 St, Rock Island, IL 61201
$102
Cash flow
4.3%
Cash-on-Cash Return
6.7%
Cap rate
1.1%
Rent to Value Ratio

Active
$76,000
3
bds
|
1
ba
|
1,073
sqft
|
built
1972
1908 N Idaho St, Peoria, IL 61604
$320
Cash flow
22.0%
Cash-on-Cash Return
10.7%
Cap rate
1.7%
Rent to Value Ratio

Active
$65,000
1
bds
|
1
ba
|
800
sqft
|
built
1965
1306 N Milton Ave, Springfield, IL 62702
$726
Cash flow
13.0%
Cash-on-Cash Return
13.4%
Cap rate
1.8%
Rent to Value Ratio

Active
$93,000
1
bds
|
1
ba
|
720
sqft
|
built
1937
600 E Virginia Ave, Peoria, IL 61603
$72
Cash flow
4.0%
Cash-on-Cash Return
6.6%
Cap rate
1.0%
Rent to Value Ratio
Active
$64,900
bds
|
0
ba
|
0
sqft
|
built
1890
1502 S Pasfield St, Springfield, IL 62704
$1,024
Cash flow
18.4%
Cash-on-Cash Return
18.9%
Cap rate
2.6%
Rent to Value Ratio
Active
$274,900
4
bds
|
3
ba
|
2,093
sqft
|
built
1997
1111 Windy Hill Ct, Varna, IL 61375
$-1,009
Cash flow
-19.2%
Cash-on-Cash Return
1.3%
Cap rate
0.4%
Rent to Value Ratio
Active
$269,900
3
bds
|
2
ba
|
1,600
sqft
|
built
1936
4418 11th St, East Moline, IL 61244
$-670
Cash flow
-13.0%
Cash-on-Cash Return
2.7%
Cap rate
0.5%
Rent to Value Ratio

Active
$125,000
2
bds
|
1
ba
|
988
sqft
|
built
1961
1614 E Converse Ave, Springfield, IL 62702
$103
Cash flow
4.3%
Cash-on-Cash Return
6.7%
Cap rate
0.9%
Rent to Value Ratio
Active
$929,900
4
bds
|
6
ba
|
5,428
sqft
|
built
2001
11518 N Nettle Creek Dr, Dunlap, IL 61525
$-3,973
Cash flow
-22.3%
Cash-on-Cash Return
0.6%
Cap rate
0.3%
Rent to Value Ratio

Active
$375,000
4
bds
|
5
ba
|
3,206
sqft
|
built
1895
1703 20th St, Rock Island, IL 61201
$-1,002
Cash flow
-13.9%
Cash-on-Cash Return
2.5%
Cap rate
0.5%
Rent to Value Ratio

Active
$625,000
4
bds
|
4
ba
|
4,100
sqft
|
built
2006
26620 Schuck Rd, Washington, IL 61571
$-2,259
Cash flow
-18.9%
Cash-on-Cash Return
1.3%
Cap rate
0.4%
Rent to Value Ratio

Active
$75,900
3
bds
|
0
ba
|
0
sqft
|
built
1920
903 17th St, Rock Island, IL 61201
$321
Cash flow
22.1%
Cash-on-Cash Return
10.8%
Cap rate
1.6%
Rent to Value Ratio
Active
$135,900
3
bds
|
2
ba
|
1,186
sqft
|
built
1963
530 Island Ave, East Moline, IL 61244
$250
Cash flow
9.6%
Cash-on-Cash Return
7.9%
Cap rate
1.3%
Rent to Value Ratio

Active
$235,000
3
bds
|
2
ba
|
1,731
sqft
|
built
2004
3058 Twin Lakes Dr, Springfield, IL 62707
$-92
Cash flow
-2.0%
Cash-on-Cash Return
5.2%
Cap rate
0.9%
Rent to Value Ratio

Active
$27,700
3
bds
|
1
ba
|
720
sqft
|
built
1906
448 N 3rd Ave, Canton, IL 61520
$602
Cash flow
25.3%
Cash-on-Cash Return
26.1%
Cap rate
3.6%
Rent to Value Ratio

Active
$364,900
3
bds
|
3
ba
|
4,136
sqft
|
built
1991
105 Timberridge Dr, Springfield, IL 62702
$-610
Cash flow
-8.7%
Cash-on-Cash Return
3.7%
Cap rate
0.7%
Rent to Value Ratio
Active
$70,000
3
bds
|
1
ba
|
960
sqft
|
built
1952
6812 33rd St, Moline, IL 61265
$415
Cash flow
6.9%
Cash-on-Cash Return
7.1%
Cap rate
1.6%
Rent to Value Ratio

Active
$110,000
3
bds
|
2
ba
|
1,350
sqft
|
built
1909
2735 5 1/2 Ave, Rock Island, IL 61201
$144
Cash flow
6.8%
Cash-on-Cash Return
7.3%
Cap rate
1.1%
Rent to Value Ratio

Active
$69,900
2
bds
|
1
ba
|
900
sqft
|
built
1919
1200 W Virginia Ave, Peoria, IL 61604
$640
Cash flow
10.7%
Cash-on-Cash Return
11.0%
Cap rate
1.7%
Rent to Value Ratio

Active
$749,000
6
bds
|
4
ba
|
4,507
sqft
|
built
2003
735 Epping Ct, Springfield, IL 62711
$-3,348
Cash flow
-23.3%
Cash-on-Cash Return
0.3%
Cap rate
0.3%
Rent to Value Ratio

Active
$66,000
2
bds
|
1
ba
|
1,128
sqft
|
built
1921
462 Baxter Ct, Canton, IL 61520
$581
Cash flow
10.3%
Cash-on-Cash Return
10.6%
Cap rate
1.7%
Rent to Value Ratio
Active
$125,000
3
bds
|
2
ba
|
1,480
sqft
|
built
1964
920 17th St, Moline, IL 61265
$268
Cash flow
11.2%
Cash-on-Cash Return
8.3%
Cap rate
1.3%
Rent to Value Ratio

Active
$264,500
3
bds
|
3
ba
|
1,926
sqft
|
built
2004
414 11th Avenue A Ct, Silvis, IL 61282
$-332
Cash flow
-6.5%
Cash-on-Cash Return
4.2%
Cap rate
0.7%
Rent to Value Ratio

Active
$217,000
3
bds
|
4
ba
|
3,094
sqft
|
built
1917
943 NE Glen Oak Ave, Peoria, IL 61603
$42
Cash flow
1.0%
Cash-on-Cash Return
5.9%
Cap rate
0.9%
Rent to Value Ratio

Active
$49,000
2
bds
|
1
ba
|
972
sqft
|
built
1889
1107 E Republic St, Peoria, IL 61603
$656
Cash flow
15.6%
Cash-on-Cash Return
16.1%
Cap rate
2.2%
Rent to Value Ratio

Active
$99,900
3
bds
|
1
ba
|
1,577
sqft
|
built
1931
4403 12th St, Rock Island, IL 61201
$289
Cash flow
15.1%
Cash-on-Cash Return
9.2%
Cap rate
1.5%
Rent to Value Ratio

Active
$153,900
3
bds
|
2
ba
|
1,268
sqft
|
built
1912
1602 37th St, Rock Island, IL 61201
$-33
Cash flow
-1.1%
Cash-on-Cash Return
5.4%
Cap rate
0.9%
Rent to Value Ratio
Active
$27,500
3
bds
|
2
ba
|
1,520
sqft
|
built
1907
231 Cooper St, Pekin, IL 61554
$1,002
Cash flow
42.5%
Cash-on-Cash Return
43.7%
Cap rate
5.5%
Rent to Value Ratio
Active
$59,900
2
bds
|
1
ba
|
720
sqft
|
built
1953
2217 W Marquette St, Peoria, IL 61605
$537
Cash flow
10.4%
Cash-on-Cash Return
10.8%
Cap rate
1.3%
Rent to Value Ratio

Active
$65,000
2
bds
|
1
ba
|
952
sqft
|
built
1959
817 S 25th St, Springfield, IL 62703
$621
Cash flow
11.1%
Cash-on-Cash Return
11.5%
Cap rate
1.5%
Rent to Value Ratio

Active
$354,000
4
bds
|
2
ba
|
2,150
sqft
|
built
1978
11816 Route 84 N, Port Byron, IL 61275
$-951
Cash flow
-14.0%
Cash-on-Cash Return
2.5%
Cap rate
0.8%
Rent to Value Ratio