Hamilton County Investment Properties for Sale
Browse homes for sale and investment properties in Hamilton County. Refine your search by price, property type, or more.
Best cash flowing properties in Hamilton County
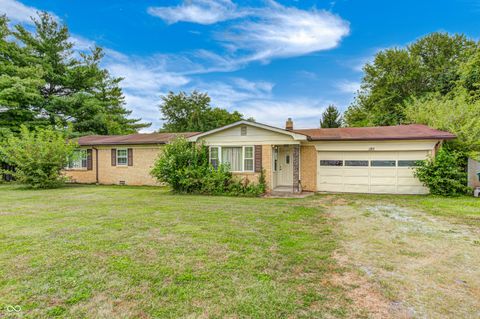
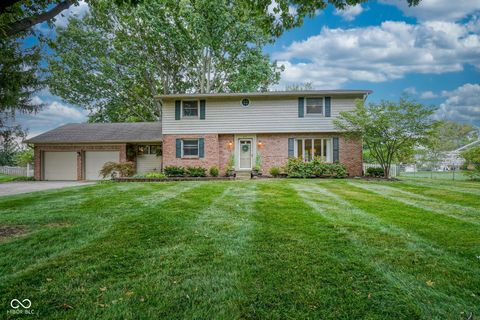
Active
$300,000
4
bds
|
2
ba
|
1,719
sqft
|
built
1974
189 David Brown Dr, Westfield, IN 46074
$-19
Cash flow
-0.3%
Cash-on-Cash Return
6.1%
Cap rate
0.7%
Rent to Value Ratio
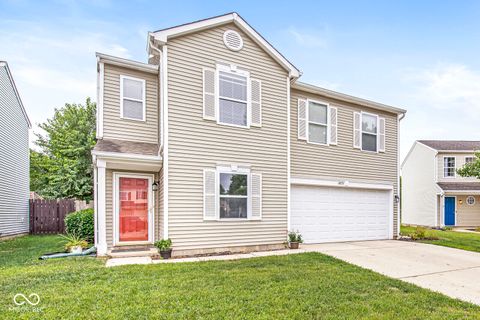
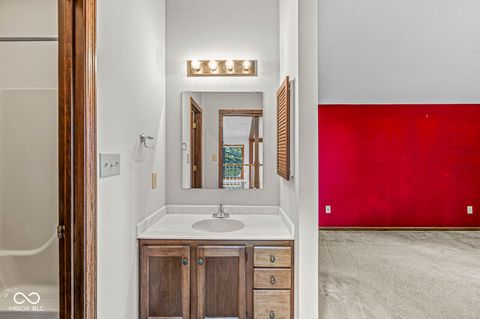
Active
$300,000
3
bds
|
3
ba
|
2,238
sqft
|
built
1999
11835 Buck Creek Cir, Noblesville, IN 46060
$-178
Cash flow
-3.1%
Cash-on-Cash Return
5.4%
Cap rate
0.7%
Rent to Value Ratio
508 out of 569 properties for sale in Hamilton County
Limited Results Shown
Create a free account, or log in to reveal all property listings and enjoy the complete experience.
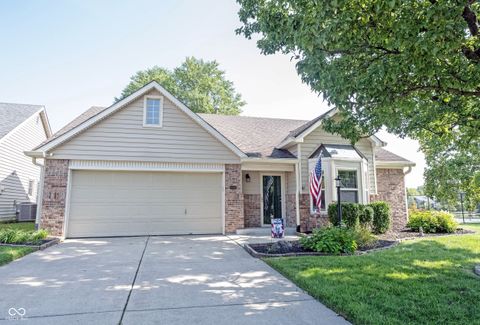
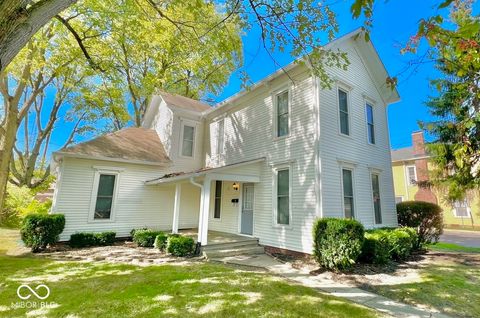
Active
$385,000
3
bds
|
2
ba
|
1,389
sqft
|
built
1990
10700 Pimlico Cir, Carmel, IN 46280
$-532
Cash flow
-7.2%
Cash-on-Cash Return
4.5%
Cap rate
0.6%
Rent to Value Ratio
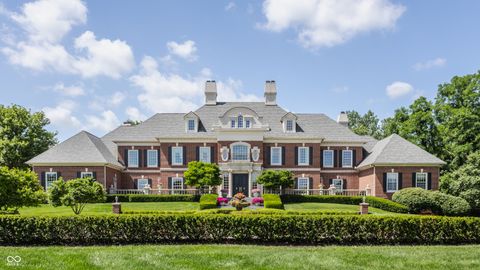
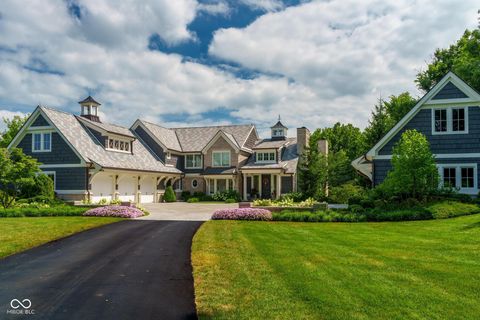
Active
$11,900,000
5
bds
|
8
ba
|
13,904
sqft
|
built
2003
4141 W 116th St, Zionsville, IN 46077
$-57,163
Cash flow
-25.1%
Cash-on-Cash Return
0.4%
Cap rate
0.0%
Rent to Value Ratio
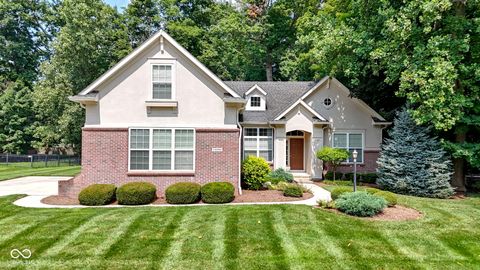
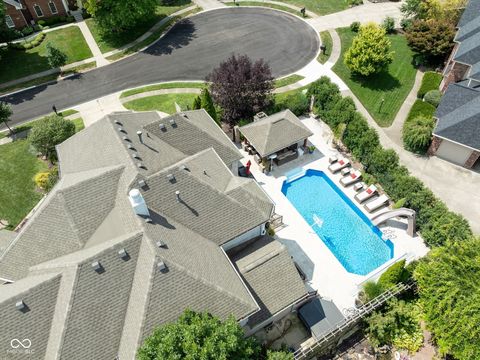
Active
$850,000
3
bds
|
3
ba
|
2,552
sqft
|
built
1988
20678 Hinkle Rd, Noblesville, IN 46062
$-2,146
Cash flow
-13.2%
Cash-on-Cash Return
3.1%
Cap rate
0.4%
Rent to Value Ratio
Active
$594,900
6
bds
|
5
ba
|
4,290
sqft
|
built
2005
11581 Ludlow Dr, Fishers, IN 46037
$-674
Cash flow
-5.9%
Cash-on-Cash Return
4.8%
Cap rate
0.6%
Rent to Value Ratio

Active
$449,900
5
bds
|
3
ba
|
2,736
sqft
|
built
1995
8400 Harrison Pkwy, Fishers, IN 46038
$-596
Cash flow
-6.9%
Cash-on-Cash Return
4.6%
Cap rate
0.6%
Rent to Value Ratio
Active
$515,000
4
bds
|
4
ba
|
3,655
sqft
|
built
1997
8363 Bighorn Ct, Fishers, IN 46038
$-658
Cash flow
-6.7%
Cash-on-Cash Return
4.6%
Cap rate
0.6%
Rent to Value Ratio
Active
$1,189,000
6
bds
|
6
ba
|
5,522
sqft
|
built
2012
15896 N Gray Rd, Noblesville, IN 46062
$-3,055
Cash flow
-13.4%
Cash-on-Cash Return
3.1%
Cap rate
0.4%
Rent to Value Ratio
Active
$818,010
4
bds
|
3
ba
|
3,385
sqft
|
built
1969
12 Maplecrest Dr, Carmel, IN 46033
$-2,189
Cash flow
-14.0%
Cash-on-Cash Return
2.9%
Cap rate
0.4%
Rent to Value Ratio
Active
$585,000
4
bds
|
2
ba
|
3,642
sqft
|
built
1960
9797 Ditch Rd, Carmel, IN 46032
$-1,065
Cash flow
-9.5%
Cash-on-Cash Return
4.0%
Cap rate
0.5%
Rent to Value Ratio
Active
$915,000
4
bds
|
5
ba
|
4,818
sqft
|
built
2013
3832 Pelham Rd, Carmel, IN 46074
$-1,709
Cash flow
-9.7%
Cash-on-Cash Return
3.9%
Cap rate
0.5%
Rent to Value Ratio
Active
$514,900
4
bds
|
3
ba
|
2,402
sqft
|
built
1970
2559 Pleasant Way W, Carmel, IN 46280
$-913
Cash flow
-9.3%
Cash-on-Cash Return
4.0%
Cap rate
0.5%
Rent to Value Ratio
Active
$599,000
5
bds
|
3
ba
|
2,480
sqft
|
built
1965
817 Alwyne Rd, Carmel, IN 46032
$-653
Cash flow
-5.7%
Cash-on-Cash Return
4.8%
Cap rate
0.6%
Rent to Value Ratio
Active
$899,900
4
bds
|
5
ba
|
3,656
sqft
|
built
1982
1628 W Port Ct, Cicero, IN 46034
$-2,469
Cash flow
-14.3%
Cash-on-Cash Return
2.9%
Cap rate
0.4%
Rent to Value Ratio
Active
$399,000
3
bds
|
0
ba
|
0
sqft
|
built
1900
297 N 9th St, Noblesville, IN 46060
$-802
Cash flow
-10.5%
Cash-on-Cash Return
3.7%
Cap rate
0.5%
Rent to Value Ratio
Active
$700,000
4
bds
|
4
ba
|
4,478
sqft
|
built
2005
14094 Plantation Wood Ln, Carmel, IN 46033
$-1,218
Cash flow
-9.1%
Cash-on-Cash Return
4.1%
Cap rate
0.5%
Rent to Value Ratio
Active
$5,900,000
4
bds
|
6
ba
|
10,614
sqft
|
built
1980
13665 E 114th St, Fishers, IN 46037
$-26,126
Cash flow
-23.1%
Cash-on-Cash Return
0.8%
Cap rate
0.1%
Rent to Value Ratio
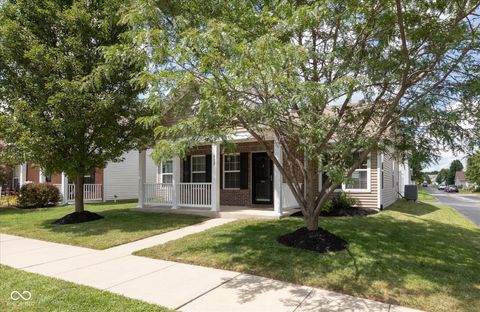
Active
$309,900
3
bds
|
2
ba
|
1,223
sqft
|
built
2012
902 Helston Ave, Westfield, IN 46074
$-304
Cash flow
-5.1%
Cash-on-Cash Return
5.0%
Cap rate
0.6%
Rent to Value Ratio
Active
$1,290,000
6
bds
|
5
ba
|
5,429
sqft
|
built
1993
434 Sheffield Ct, Carmel, IN 46032
$-3,196
Cash flow
-12.9%
Cash-on-Cash Return
3.2%
Cap rate
0.4%
Rent to Value Ratio
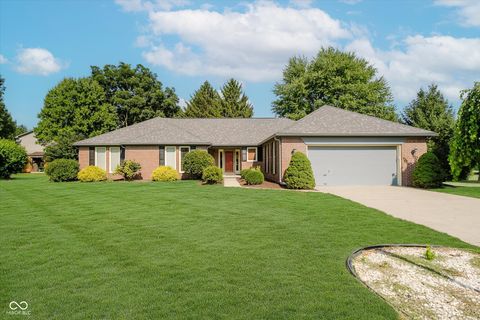
Active
$389,900
3
bds
|
3
ba
|
1,991
sqft
|
built
1965
103 Chesterfield Dr, Noblesville, IN 46060
$-452
Cash flow
-6.0%
Cash-on-Cash Return
4.8%
Cap rate
0.6%
Rent to Value Ratio
Active
$300,000
3
bds
|
3
ba
|
2,150
sqft
|
built
2004
6247 Eller Creek Way, Fishers, IN 46038
$-306
Cash flow
-5.3%
Cash-on-Cash Return
4.9%
Cap rate
0.7%
Rent to Value Ratio
Active
$575,000
3
bds
|
2
ba
|
1,542
sqft
|
built
2021
18751 Deshane Ave, Noblesville, IN 46060
$-1,565
Cash flow
-14.2%
Cash-on-Cash Return
2.9%
Cap rate
0.3%
Rent to Value Ratio
Active
$975,000
3
bds
|
2
ba
|
1,350
sqft
|
built
2019
19855 Freemont Moore Rd, Sheridan, IN 46069
$-3,131
Cash flow
-16.8%
Cash-on-Cash Return
2.3%
Cap rate
0.3%
Rent to Value Ratio
Active
$400,000
2
bds
|
3
ba
|
2,171
sqft
|
built
1990
5059 Morton Pl, Carmel, IN 46033
$-338
Cash flow
-4.4%
Cash-on-Cash Return
5.1%
Cap rate
0.7%
Rent to Value Ratio
Active
$524,900
4
bds
|
3
ba
|
2,704
sqft
|
built
1985
10535 Breckenridge Dr, Carmel, IN 46033
$-343
Cash flow
-3.4%
Cash-on-Cash Return
5.4%
Cap rate
0.6%
Rent to Value Ratio
Active
$989,000
5
bds
|
5
ba
|
5,021
sqft
|
built
1989
12899 Brighton Ave, Carmel, IN 46032
$-1,586
Cash flow
-8.4%
Cash-on-Cash Return
4.2%
Cap rate
0.5%
Rent to Value Ratio
Active
$339,000
3
bds
|
3
ba
|
1,536
sqft
|
built
1996
8913 Glass Chimney Ln, Fishers, IN 46037
$-452
Cash flow
-7.0%
Cash-on-Cash Return
4.5%
Cap rate
0.6%
Rent to Value Ratio
Active
$400,000
4
bds
|
3
ba
|
2,370
sqft
|
built
2011
11581 Beardsley Way, Fishers, IN 46038
$-351
Cash flow
-4.6%
Cash-on-Cash Return
5.1%
Cap rate
0.6%
Rent to Value Ratio
Active
$399,000
0
bds
|
0
ba
|
0
sqft
|
built
1900
1102 Cherry St, Noblesville, IN 46060
$-457
Cash flow
-6.0%
Cash-on-Cash Return
4.8%
Cap rate
0.6%
Rent to Value Ratio
Active
$574,900
5
bds
|
4
ba
|
3,954
sqft
|
built
2006
11761 Boothbay Ln, Fishers, IN 46037
$-771
Cash flow
-7.0%
Cash-on-Cash Return
4.5%
Cap rate
0.6%
Rent to Value Ratio
Active
$800,000
4
bds
|
4
ba
|
4,191
sqft
|
built
2003
13218 Beckwith Dr, Carmel, IN 46074
$-1,758
Cash flow
-11.5%
Cash-on-Cash Return
3.5%
Cap rate
0.4%
Rent to Value Ratio
Active
$845,000
5
bds
|
4
ba
|
4,598
sqft
|
built
1995
12214 Ridgeside Rd, Indianapolis, IN 46256
$-1,433
Cash flow
-8.8%
Cash-on-Cash Return
4.1%
Cap rate
0.5%
Rent to Value Ratio
Active
$479,900
4
bds
|
3
ba
|
3,424
sqft
|
built
2018
11840 Crossbill Ct, Noblesville, IN 46060
$-505
Cash flow
-5.5%
Cash-on-Cash Return
4.9%
Cap rate
0.6%
Rent to Value Ratio
Active
$550,000
3
bds
|
3
ba
|
3,043
sqft
|
built
2014
548 Gosford Ct, Westfield, IN 46074
$-761
Cash flow
-7.2%
Cash-on-Cash Return
4.5%
Cap rate
0.6%
Rent to Value Ratio
Active
$2,350,000
5
bds
|
5
ba
|
7,705
sqft
|
built
1988
11715 Landings Dr, Indianapolis, IN 46256
$-7,804
Cash flow
-17.3%
Cash-on-Cash Return
2.2%
Cap rate
0.3%
Rent to Value Ratio
Active
$250,000
2
bds
|
2
ba
|
1,815
sqft
|
built
1974
162 Carmelaire Dr, Carmel, IN 46032
$-241
Cash flow
-5.0%
Cash-on-Cash Return
5.0%
Cap rate
0.8%
Rent to Value Ratio
Active
$799,900
5
bds
|
4
ba
|
4,305
sqft
|
built
1991
9838 Gulfstream Ct, Fishers, IN 46037
$-1,657
Cash flow
-10.8%
Cash-on-Cash Return
3.7%
Cap rate
0.5%
Rent to Value Ratio
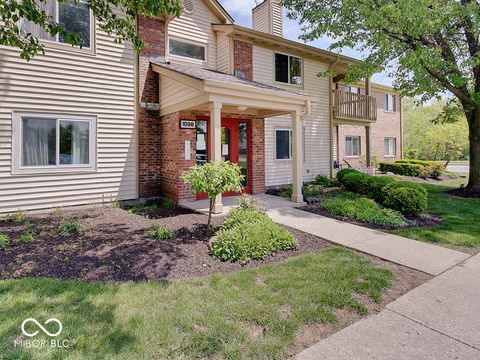
Active
$220,000
2
bds
|
2
ba
|
1,072
sqft
|
built
1989
1098 Timber Creek Dr, Carmel, IN 46032
$-267
Cash flow
-6.3%
Cash-on-Cash Return
4.7%
Cap rate
0.7%
Rent to Value Ratio
Active
$359,900
3
bds
|
4
ba
|
2,328
sqft
|
built
2020
17364 Graley Pl, Westfield, IN 46074
$-200
Cash flow
-2.9%
Cash-on-Cash Return
5.5%
Cap rate
0.7%
Rent to Value Ratio