Madison County Investment Properties for Sale
Browse homes for sale and investment properties in Madison County. Refine your search by price, property type, or more.
Best cash flowing properties in Madison County
Active
$60,000
2
bds
|
1
ba
|
1,280
sqft
|
built
1910
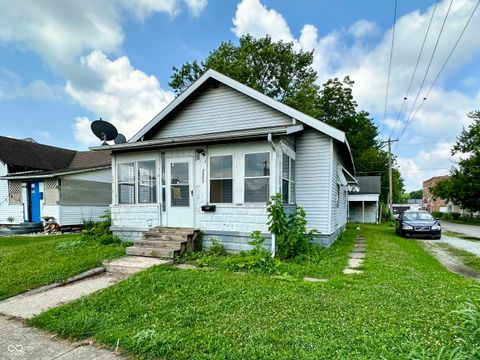
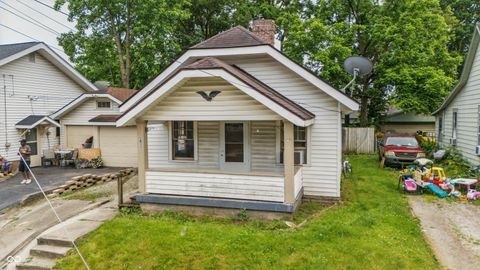
2503 Central Ave, Anderson, IN 46016
$828
Cash flow
16.1%
Cash-on-Cash Return
16.6%
Cap rate
2.0%
Rent to Value Ratio
Active
$69,900
2
bds
|
1
ba
|
840
sqft
|
built
1951
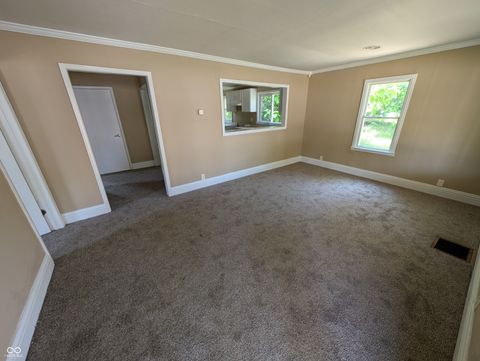
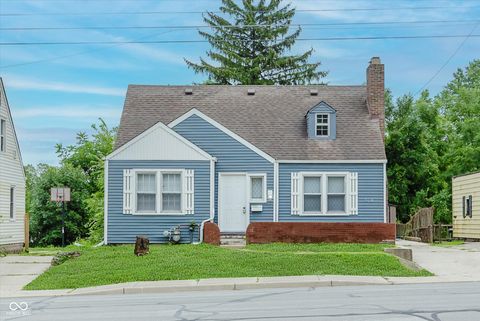
603 W 33rd St, Anderson, IN 46013
$759
Cash flow
12.7%
Cash-on-Cash Return
13.0%
Cap rate
1.6%
Rent to Value Ratio
150 out of 168 properties for sale in Madison County
Limited Results Shown
Create a free account, or log in to reveal all property listings and enjoy the complete experience.

Active
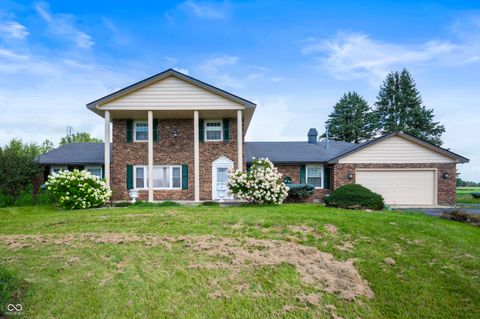
$239,900
3
bds
|
2
ba
|
1,560
sqft
|
built
1958
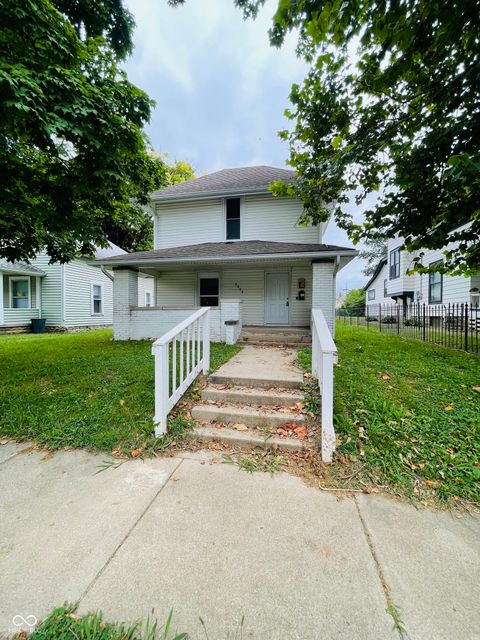
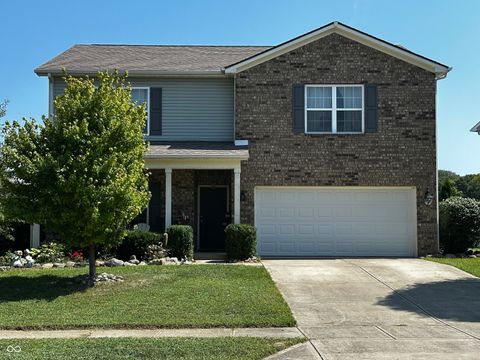
196 E 600 N, Alexandria, IN 46001
$-125
Cash flow
-2.7%
Cash-on-Cash Return
5.5%
Cap rate
0.7%
Rent to Value Ratio
Active
$100,000
3
bds
|
0
ba
|
0
sqft
|
built
1890
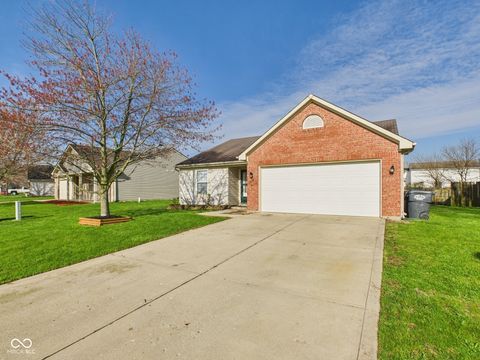
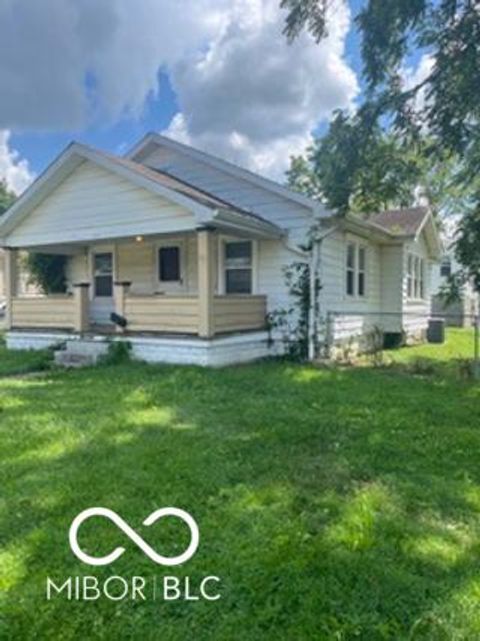
1820 Central Ave, Anderson, IN 46016
$-29
Cash flow
-1.5%
Cash-on-Cash Return
5.8%
Cap rate
0.7%
Rent to Value Ratio
Active
$224,900
4
bds
|
2
ba
|
1,329
sqft
|
built
2000
6233 Boulder Dr, Anderson, IN 46013
$-59
Cash flow
-1.4%
Cash-on-Cash Return
5.8%
Cap rate
0.7%
Rent to Value Ratio
Active
$795,000
3
bds
|
3
ba
|
2,916
sqft
|
built
1976
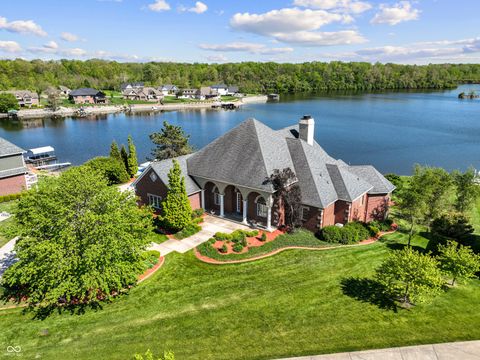
4832 E 200 N, Anderson, IN 46012
$-1,588
Cash flow
-10.4%
Cash-on-Cash Return
3.7%
Cap rate
0.5%
Rent to Value Ratio
Active
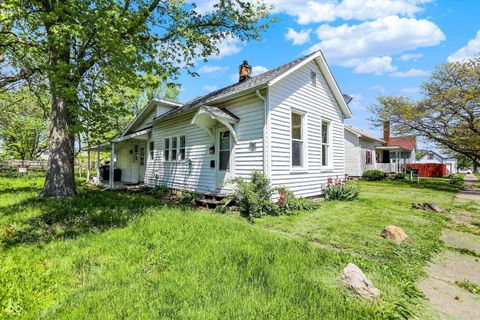
$55,000
1
bds
|
1
ba
|
668
sqft
|
built
1952
2233 W 28th St, Anderson, IN 46016
$483
Cash flow
10.2%
Cash-on-Cash Return
10.5%
Cap rate
1.3%
Rent to Value Ratio
Active
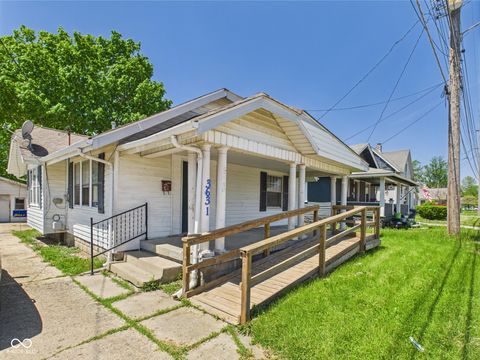
$96,900
2
bds
|
1
ba
|
1,028
sqft
|
built
1930
3631 Columbus Ave, Anderson, IN 46013
$332
Cash flow
17.9%
Cash-on-Cash Return
10.3%
Cap rate
1.2%
Rent to Value Ratio
Active
$126,500
3
bds
|
1
ba
|
1,036
sqft
|
built
1899
2018 Poplar St, Anderson, IN 46012
$249
Cash flow
10.3%
Cash-on-Cash Return
8.5%
Cap rate
1.0%
Rent to Value Ratio
Active
$80,000
2
bds
|
1
ba
|
984
sqft
|
built
1890
1011 W 7th St, Anderson, IN 46016
$556
Cash flow
36.3%
Cash-on-Cash Return
14.5%
Cap rate
1.8%
Rent to Value Ratio
Active
$144,900
3
bds
|
1
ba
|
2,140
sqft
|
built
1939
910 Raible Ave, Anderson, IN 46011
$224
Cash flow
8.1%
Cash-on-Cash Return
8.0%
Cap rate
1.0%
Rent to Value Ratio
Active
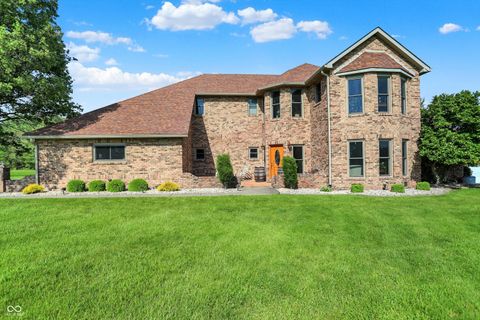
$344,995
4
bds
|
3
ba
|
2,242
sqft
|
built
2015
1685 Fair Weather Dr, Pendleton, IN 46064
$-198
Cash flow
-3.0%
Cash-on-Cash Return
5.5%
Cap rate
0.7%
Rent to Value Ratio
Active
$159,000
3
bds
|
1
ba
|
1,144
sqft
|
built
1935
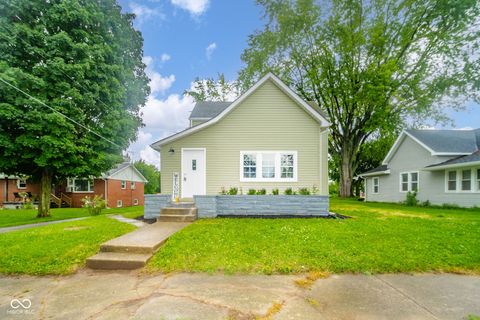
703 E 31st St, Anderson, IN 46016
$152
Cash flow
5.0%
Cash-on-Cash Return
7.3%
Cap rate
0.9%
Rent to Value Ratio
Active
$265,000
4
bds
|
3
ba
|
1,664
sqft
|
built
1930
115 Northshore Blvd, Anderson, IN 46011
$23
Cash flow
0.5%
Cash-on-Cash Return
6.2%
Cap rate
0.8%
Rent to Value Ratio
Active
$289,900
3
bds
|
3
ba
|
2,072
sqft
|
built
1905
825 Main St, Elwood, IN 46036
$-381
Cash flow
-6.9%
Cash-on-Cash Return
4.6%
Cap rate
0.6%
Rent to Value Ratio
Active
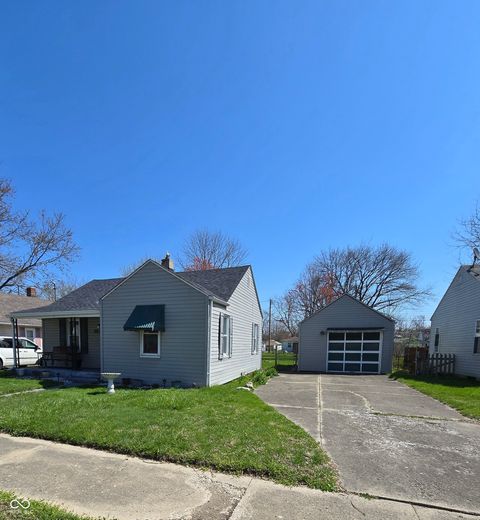
$152,000
3
bds
|
1
ba
|
768
sqft
|
built
1950
1611 S L St, Elwood, IN 46036
$118
Cash flow
4.1%
Cash-on-Cash Return
7.1%
Cap rate
0.9%
Rent to Value Ratio
Active
$159,900
2
bds
|
2
ba
|
877
sqft
|
built
1915
321 S Washington St, Chesterfield, IN 46017
$147
Cash flow
4.8%
Cash-on-Cash Return
7.2%
Cap rate
0.9%
Rent to Value Ratio
Active
$189,900
4
bds
|
3
ba
|
2,140
sqft
|
built
1963
308 N Edgeway Dr, Alexandria, IN 46001
$131
Cash flow
3.6%
Cash-on-Cash Return
7.0%
Cap rate
0.8%
Rent to Value Ratio
Active
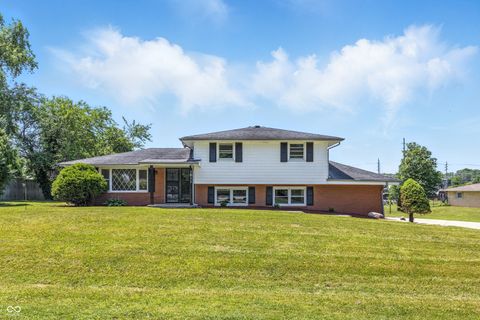
$209,900
3
bds
|
2
ba
|
1,917
sqft
|
built
1958
1325 Northcrest Dr, Anderson, IN 46012
$167
Cash flow
4.2%
Cash-on-Cash Return
7.1%
Cap rate
0.9%
Rent to Value Ratio
Active
$92,000
1
bds
|
1
ba
|
496
sqft
|
built
1939
304 Andover Rd, Anderson, IN 46013
$12
Cash flow
0.7%
Cash-on-Cash Return
6.3%
Cap rate
0.8%
Rent to Value Ratio
Active
$264,900
3
bds
|
2
ba
|
2,146
sqft
|
built
1993
724 Iroquois Dr, Anderson, IN 46012
$23
Cash flow
0.5%
Cash-on-Cash Return
6.3%
Cap rate
0.8%
Rent to Value Ratio
Active
$750,000
3
bds
|
3
ba
|
4,876
sqft
|
built
1994
186 W 600 N, Alexandria, IN 46001
$-1,358
Cash flow
-9.4%
Cash-on-Cash Return
4.0%
Cap rate
0.5%
Rent to Value Ratio
Active
$209,900
4
bds
|
0
ba
|
0
sqft
|
built
1966
1309 E 47th St, Anderson, IN 46013
$29
Cash flow
0.7%
Cash-on-Cash Return
6.3%
Cap rate
0.8%
Rent to Value Ratio
Active
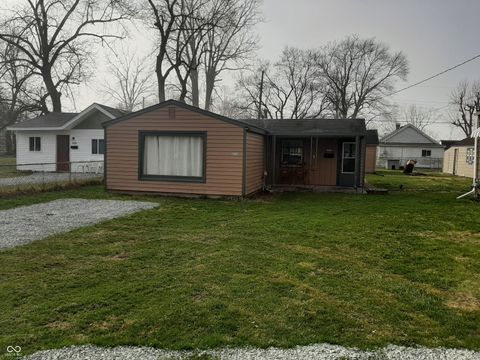
$120,000
3
bds
|
1
ba
|
1,044
sqft
|
built
1940
1610 S F St, Elwood, IN 46036
$75
Cash flow
3.3%
Cash-on-Cash Return
6.9%
Cap rate
0.8%
Rent to Value Ratio
Active
$239,900
3
bds
|
2
ba
|
1,681
sqft
|
built
1964
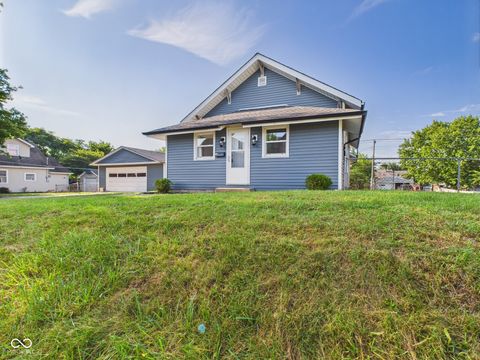
1011 Robin Dr, Anderson, IN 46013
$-125
Cash flow
-2.7%
Cash-on-Cash Return
5.5%
Cap rate
0.7%
Rent to Value Ratio
Active
$950,000
3
bds
|
5
ba
|
6,484
sqft
|
built
1994
3107 Waterfront Cir, Anderson, IN 46012
$-2,432
Cash flow
-13.4%
Cash-on-Cash Return
3.1%
Cap rate
0.4%
Rent to Value Ratio
Active
$275,000
3
bds
|
2
ba
|
1,572
sqft
|
built
1964
6807 Fairview St, Anderson, IN 46013
$-236
Cash flow
-4.5%
Cash-on-Cash Return
5.1%
Cap rate
0.6%
Rent to Value Ratio
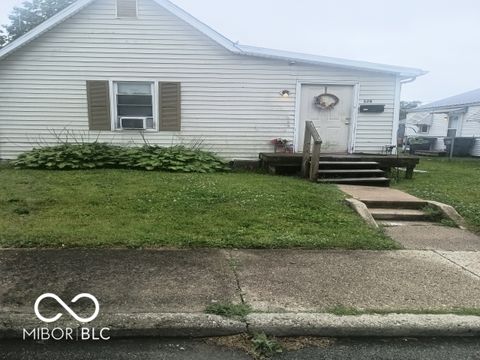
Active
$78,900
3
bds
|
1
ba
|
1,149
sqft
|
built
1915
529 W 21st St, Anderson, IN 46016
$355
Cash flow
23.5%
Cash-on-Cash Return
11.5%
Cap rate
1.4%
Rent to Value Ratio
Active
$429,900
3
bds
|
3
ba
|
3,568
sqft
|
built
2018
6420 Colt Ln, Anderson, IN 46013
$-822
Cash flow
-10.0%
Cash-on-Cash Return
3.9%
Cap rate
0.5%
Rent to Value Ratio
Active
$147,000
4
bds
|
3
ba
|
2,048
sqft
|
built
1885
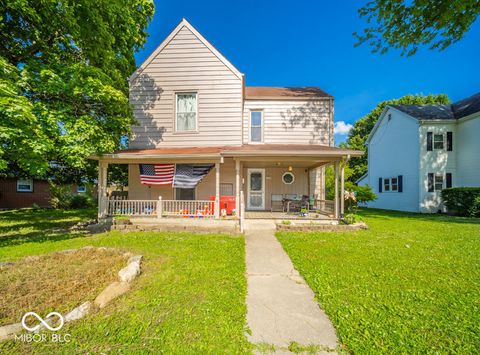
419 W 6th St, Anderson, IN 46016
$213
Cash flow
7.6%
Cash-on-Cash Return
7.9%
Cap rate
1.0%
Rent to Value Ratio
Active
$78,900
3
bds
|
1
ba
|
1,216
sqft
|
built
1925
721 Indiana Ave, Anderson, IN 46012
$355
Cash flow
23.5%
Cash-on-Cash Return
11.5%
Cap rate
1.4%
Rent to Value Ratio
Active
$294,900
5
bds
|
2
ba
|
3,059
sqft
|
built
1890
320 W 12th St, Anderson, IN 46016
$490
Cash flow
8.7%
Cash-on-Cash Return
8.1%
Cap rate
1.0%
Rent to Value Ratio
Active
$1,999,995
bds
|
0
ba
|
0
sqft
|
built
1988
1002 E 7th St, Anderson, IN 46012
$-9,141
Cash flow
-23.8%
Cash-on-Cash Return
0.7%
Cap rate
0.1%
Rent to Value Ratio
Active
$260,000
4
bds
|
3
ba
|
2,082
sqft
|
built
1899
305 W Monroe St, Alexandria, IN 46001
$-573
Cash flow
-11.5%
Cash-on-Cash Return
3.5%
Cap rate
0.4%
Rent to Value Ratio
Active
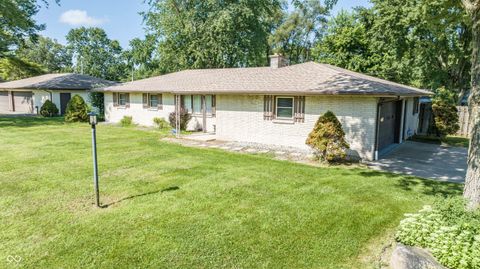
$174,900
3
bds
|
2
ba
|
1,082
sqft
|
built
1947
615 W Jefferson St, Alexandria, IN 46001
$-68
Cash flow
-2.0%
Cash-on-Cash Return
5.7%
Cap rate
0.7%
Rent to Value Ratio
Active
$159,000
3
bds
|
2
ba
|
2,766
sqft
|
built
1945
1405 N Harrison St, Alexandria, IN 46001
$83
Cash flow
2.7%
Cash-on-Cash Return
6.8%
Cap rate
0.8%
Rent to Value Ratio
Active
$265,000
4
bds
|
3
ba
|
2,328
sqft
|
built
2005
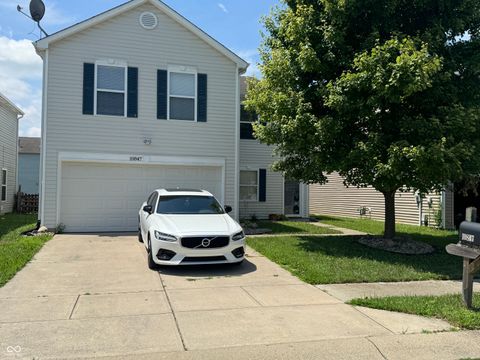
10847 Grace Dr, Ingalls, IN 46048
$23
Cash flow
0.5%
Cash-on-Cash Return
6.2%
Cap rate
0.8%
Rent to Value Ratio
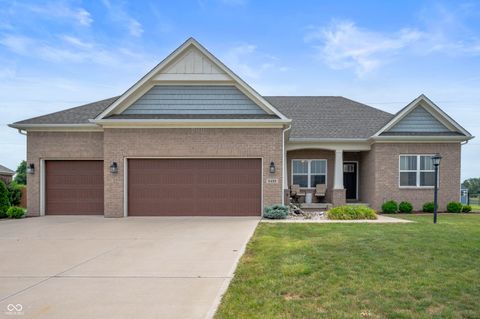
Active
$329,950
4
bds
|
3
ba
|
2,111
sqft
|
built
2022
224 E 6th Ave, Ingalls, IN 46048
$-103
Cash flow
-1.6%
Cash-on-Cash Return
5.8%
Cap rate
0.7%
Rent to Value Ratio
Active
$169,000
6
bds
|
2
ba
|
1,560
sqft
|
built
1971
2015 Rosewood Dr, Anderson, IN 46011
$100
Cash flow
3.1%
Cash-on-Cash Return
6.9%
Cap rate
0.8%
Rent to Value Ratio
Active
$729,900
3
bds
|
4
ba
|
4,876
sqft
|
built
1998
1105 Deer Creek Dr, Anderson, IN 46011
$-1,324
Cash flow
-9.5%
Cash-on-Cash Return
4.0%
Cap rate
0.5%
Rent to Value Ratio