Marion County Investment Properties for Sale
Browse homes for sale and investment properties in Marion County. Refine your search by price, property type, or more.
Best cash flowing properties in Marion County
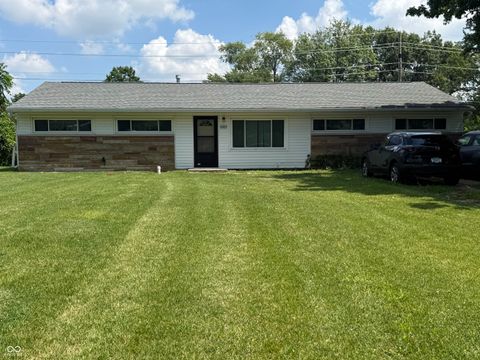
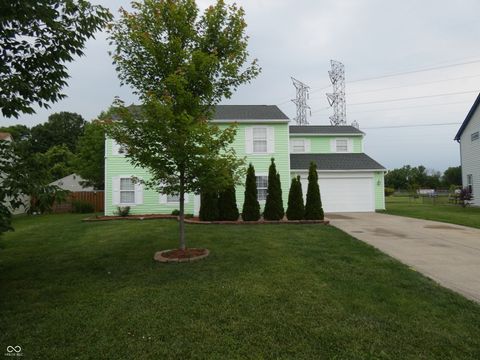
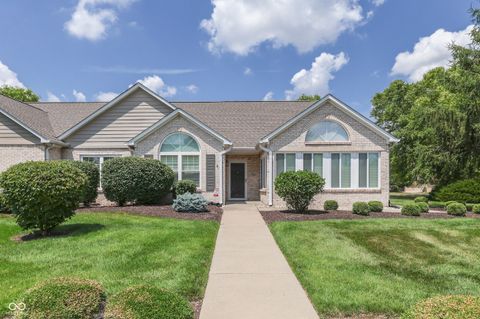
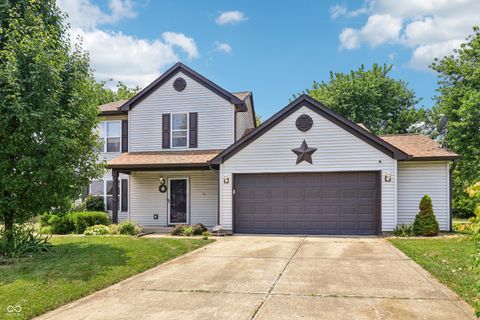
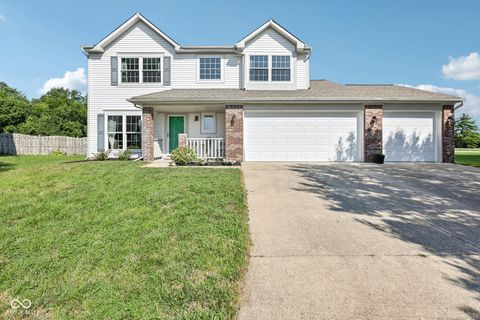
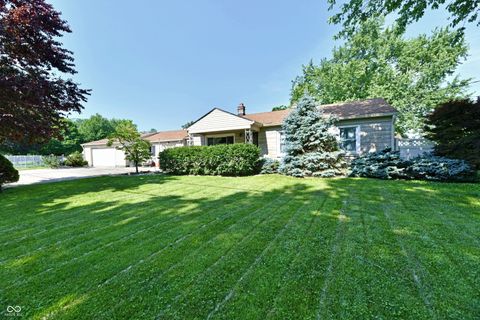
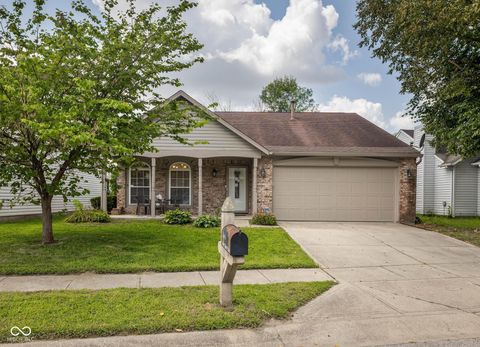
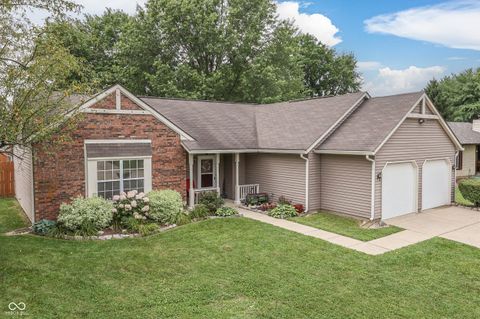
Active
$120,000
4
bds
|
2
ba
|
1,508
sqft
|
built
1956
3107 Radford Dr, Indianapolis, IN 46226
$420
Cash flow
18.3%
Cash-on-Cash Return
10.4%
Cap rate
1.3%
Rent to Value Ratio
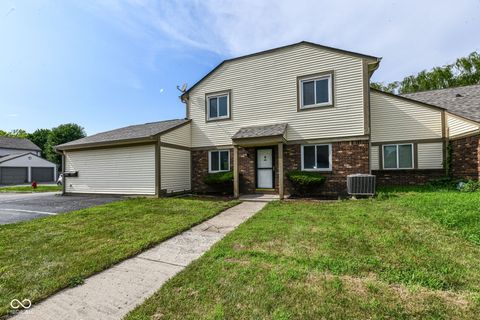
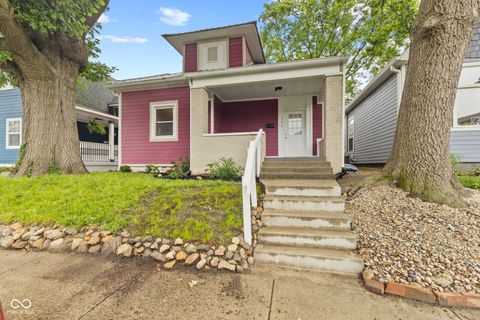
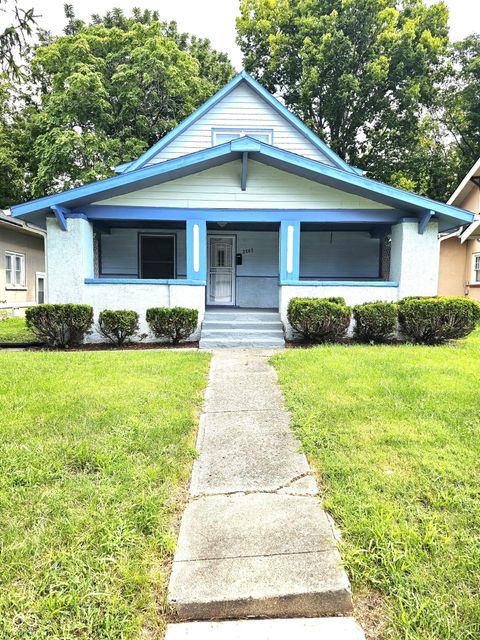
Active
$125,000
2
bds
|
0
ba
|
872
sqft
|
built
1870
324 Burgess Ave, Indianapolis, IN 46219
$326
Cash flow
13.6%
Cash-on-Cash Return
9.3%
Cap rate
1.1%
Rent to Value Ratio
2,034 out of 2,209 properties for sale in Marion County
Limited Results Shown
Create a free account, or log in to reveal all property listings and enjoy the complete experience.
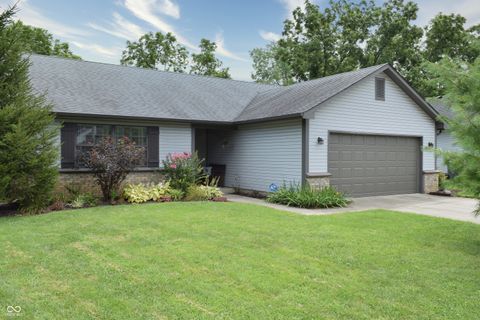
Active
$709,900
5
bds
|
4
ba
|
3,060
sqft
|
built
1994
9909 E Mc Gregor Rd, Indianapolis, IN 46259
$-1,152
Cash flow
-8.5%
Cash-on-Cash Return
4.2%
Cap rate
0.5%
Rent to Value Ratio

Active
$209,900
2
bds
|
2
ba
|
1,530
sqft
|
built
1984
9415 Timber View Dr, Indianapolis, IN 46250
$-233
Cash flow
-5.8%
Cash-on-Cash Return
4.8%
Cap rate
0.7%
Rent to Value Ratio

Active
$225,000
2
bds
|
2
ba
|
1,620
sqft
|
built
1989
8651 Jaffa Court East Dr, Indianapolis, IN 46260
$-213
Cash flow
-4.9%
Cash-on-Cash Return
5.0%
Cap rate
1.0%
Rent to Value Ratio
Active
$185,000
3
bds
|
1
ba
|
1,421
sqft
|
built
1961
8902 Carla Dr, Indianapolis, IN 46219
$156
Cash flow
4.4%
Cash-on-Cash Return
7.2%
Cap rate
0.9%
Rent to Value Ratio
Active
$329,900
5
bds
|
3
ba
|
2,192
sqft
|
built
1995
6714 Colleens Way, Indianapolis, IN 46221
$-324
Cash flow
-5.1%
Cash-on-Cash Return
5.0%
Cap rate
0.6%
Rent to Value Ratio

Active
$248,900
3
bds
|
2
ba
|
1,558
sqft
|
built
1916
909 N Parker Ave, Indianapolis, IN 46201
$-33
Cash flow
-0.7%
Cash-on-Cash Return
6.0%
Cap rate
0.7%
Rent to Value Ratio
Active
$175,000
3
bds
|
1
ba
|
920
sqft
|
built
1953
7307 Twin Beech Dr, Indianapolis, IN 46226
$70
Cash flow
2.1%
Cash-on-Cash Return
6.6%
Cap rate
0.8%
Rent to Value Ratio
Active
$149,000
2
bds
|
0
ba
|
0
sqft
|
built
1928
367 S Butler Ave, Indianapolis, IN 46219
$-73
Cash flow
-2.6%
Cash-on-Cash Return
5.6%
Cap rate
0.7%
Rent to Value Ratio
Active
$389,899
4
bds
|
3
ba
|
2,800
sqft
|
built
2022
4224 Evening Sky Ct, Indianapolis, IN 46239
$-188
Cash flow
-2.5%
Cash-on-Cash Return
5.6%
Cap rate
0.7%
Rent to Value Ratio
Active
$259,900
3
bds
|
2
ba
|
1,699
sqft
|
built
2000
7304 Lake Lakota Pl, Indianapolis, IN 46217
$-488
Cash flow
-9.8%
Cash-on-Cash Return
3.9%
Cap rate
0.7%
Rent to Value Ratio
Active
$159,900
3
bds
|
2
ba
|
1,300
sqft
|
built
1973
5933 Deerwood Ct, Indianapolis, IN 46254
$-198
Cash flow
-6.5%
Cash-on-Cash Return
4.7%
Cap rate
0.9%
Rent to Value Ratio
Active
$460,000
4
bds
|
4
ba
|
3,302
sqft
|
built
1997
11016 Turfgrass Way, Indianapolis, IN 46236
$-169
Cash flow
-1.9%
Cash-on-Cash Return
5.7%
Cap rate
0.7%
Rent to Value Ratio
Active
$160,000
2
bds
|
1
ba
|
725
sqft
|
built
1947
625 S Spencer Ave, Indianapolis, IN 46219
$146
Cash flow
4.8%
Cash-on-Cash Return
7.2%
Cap rate
0.9%
Rent to Value Ratio
Active
$265,000
3
bds
|
3
ba
|
1,676
sqft
|
built
1997
2426 Borgman Ct, Indianapolis, IN 46229
$5
Cash flow
0.1%
Cash-on-Cash Return
6.2%
Cap rate
0.8%
Rent to Value Ratio
Active
$349,000
3
bds
|
2
ba
|
1,444
sqft
|
built
1956
8105 Allisonville Rd, Indianapolis, IN 46250
$-546
Cash flow
-8.2%
Cash-on-Cash Return
4.3%
Cap rate
0.5%
Rent to Value Ratio
Active
$150,000
1
bds
|
1
ba
|
720
sqft
|
built
1922
2933 S East St, Indianapolis, IN 46225
$129
Cash flow
4.5%
Cash-on-Cash Return
7.2%
Cap rate
0.9%
Rent to Value Ratio
Active
$240,000
3
bds
|
1
ba
|
1,222
sqft
|
built
1938
2701 Manker St, Indianapolis, IN 46203
$151
Cash flow
3.3%
Cash-on-Cash Return
6.9%
Cap rate
0.8%
Rent to Value Ratio
Active
$300,000
3
bds
|
3
ba
|
2,072
sqft
|
built
2001
3175 Delaway Ln, Indianapolis, IN 46217
$-290
Cash flow
-5.0%
Cash-on-Cash Return
5.0%
Cap rate
0.7%
Rent to Value Ratio

Active
$299,900
4
bds
|
3
ba
|
1,812
sqft
|
built
1998
3825 Grove Tree Ln, Indianapolis, IN 46203
$-173
Cash flow
-3.0%
Cash-on-Cash Return
5.5%
Cap rate
0.7%
Rent to Value Ratio
Active
$160,000
3
bds
|
1
ba
|
1,294
sqft
|
built
1956
4006 Kenneth Ave, Indianapolis, IN 46226
$284
Cash flow
9.3%
Cash-on-Cash Return
8.3%
Cap rate
1.0%
Rent to Value Ratio
Active
$164,900
2
bds
|
1
ba
|
725
sqft
|
built
1949
2257 N Goodlet Ave, Indianapolis, IN 46222
$52
Cash flow
1.6%
Cash-on-Cash Return
6.5%
Cap rate
0.8%
Rent to Value Ratio
Active
$259,000
3
bds
|
2
ba
|
1,496
sqft
|
built
1994
6933 Lohr Way, Indianapolis, IN 46214
$-85
Cash flow
-1.7%
Cash-on-Cash Return
5.8%
Cap rate
0.7%
Rent to Value Ratio
Active
$264,900
3
bds
|
2
ba
|
1,248
sqft
|
built
1991
7117 Carrie Dr, Indianapolis, IN 46237
$-115
Cash flow
-2.3%
Cash-on-Cash Return
5.6%
Cap rate
0.7%
Rent to Value Ratio
Active
$259,900
3
bds
|
1
ba
|
1,824
sqft
|
built
1949
2201 E 65th St, Indianapolis, IN 46220
$-89
Cash flow
-1.8%
Cash-on-Cash Return
5.7%
Cap rate
0.7%
Rent to Value Ratio

Active
$225,000
3
bds
|
4
ba
|
1,670
sqft
|
built
1982
6126 E 96th Pl, Indianapolis, IN 46250
$-96
Cash flow
-2.2%
Cash-on-Cash Return
5.6%
Cap rate
0.8%
Rent to Value Ratio
Active
$299,000
3
bds
|
2
ba
|
1,641
sqft
|
built
1988
3625 Wild Ivy Ct, Indianapolis, IN 46227
$-290
Cash flow
-5.1%
Cash-on-Cash Return
5.0%
Cap rate
0.6%
Rent to Value Ratio
Active
$185,000
3
bds
|
1
ba
|
900
sqft
|
built
1955
3148 Keswick Rd, Indianapolis, IN 46222
$-51
Cash flow
-1.4%
Cash-on-Cash Return
5.8%
Cap rate
0.7%
Rent to Value Ratio
Active
$260,000
4
bds
|
2
ba
|
1,732
sqft
|
built
1952
4020 S Lynhurst Dr, Indianapolis, IN 46221
$48
Cash flow
1.0%
Cash-on-Cash Return
6.4%
Cap rate
0.8%
Rent to Value Ratio
Active
$264,900
3
bds
|
2
ba
|
1,208
sqft
|
built
1909
734 Parkway Ave, Indianapolis, IN 46203
$23
Cash flow
0.5%
Cash-on-Cash Return
6.3%
Cap rate
0.8%
Rent to Value Ratio
Active
$163,000
2
bds
|
1
ba
|
1,179
sqft
|
built
1983
7962 Valley Farms Ct, Indianapolis, IN 46214
$51
Cash flow
1.6%
Cash-on-Cash Return
6.5%
Cap rate
1.0%
Rent to Value Ratio
Active
$279,000
3
bds
|
3
ba
|
2,284
sqft
|
built
1995
5626 Prince Woods Cir, Indianapolis, IN 46224
$-139
Cash flow
-2.6%
Cash-on-Cash Return
5.5%
Cap rate
0.7%
Rent to Value Ratio
Active
$229,900
3
bds
|
2
ba
|
1,811
sqft
|
built
1999
3046 River Shore Pl, Indianapolis, IN 46208
$177
Cash flow
4.0%
Cash-on-Cash Return
7.1%
Cap rate
0.9%
Rent to Value Ratio
Active
$754,500
5
bds
|
5
ba
|
3,362
sqft
|
built
1968
6639 E 65th St, Indianapolis, IN 46220
$-1,391
Cash flow
-9.6%
Cash-on-Cash Return
3.9%
Cap rate
0.5%
Rent to Value Ratio
Active
$285,000
2
bds
|
3
ba
|
1,926
sqft
|
built
1978
5228 Greenwillow Rd, Indianapolis, IN 46226
$-633
Cash flow
-11.6%
Cash-on-Cash Return
3.5%
Cap rate
0.7%
Rent to Value Ratio
Active
$299,900
3
bds
|
1
ba
|
864
sqft
|
built
1949
6224 Norwaldo Ave, Indianapolis, IN 46220
$-156
Cash flow
-2.7%
Cash-on-Cash Return
5.5%
Cap rate
0.7%
Rent to Value Ratio
Active
$269,999
3
bds
|
2
ba
|
1,500
sqft
|
built
1985
7556 Gunyon Ct, Indianapolis, IN 46237
$-141
Cash flow
-2.7%
Cash-on-Cash Return
5.5%
Cap rate
0.7%
Rent to Value Ratio

Active
$450,000
3
bds
|
3
ba
|
2,340
sqft
|
built
1940
4629 Cornelius Ave, Indianapolis, IN 46208
$-373
Cash flow
-4.3%
Cash-on-Cash Return
5.2%
Cap rate
0.6%
Rent to Value Ratio
Active
$254,900
4
bds
|
3
ba
|
2,048
sqft
|
built
1940
3565 Evergreen Ave, Indianapolis, IN 46205
$-409
Cash flow
-8.4%
Cash-on-Cash Return
4.2%
Cap rate
0.5%
Rent to Value Ratio