Marion County Investment Properties for Sale
Browse homes for sale and investment properties in Marion County. Refine your search by price, property type, or more.
Best cash flowing properties in Marion County
Active
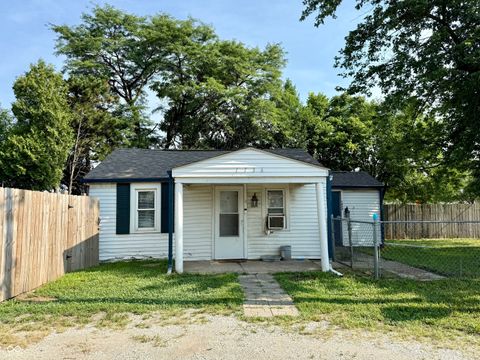
$69,900
1
bds
|
1
ba
|
562
sqft
|
built
1910
1736 S Belmont Ave, Indianapolis, IN 46221
$483
Cash flow
8.1%
Cash-on-Cash Return
8.3%
Cap rate
1.0%
Rent to Value Ratio
Active
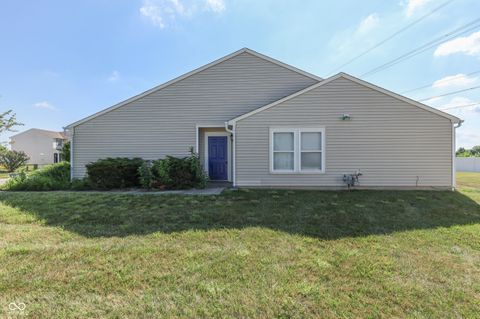
$169,900
2
bds
|
2
ba
|
1,309
sqft
|
built
2005
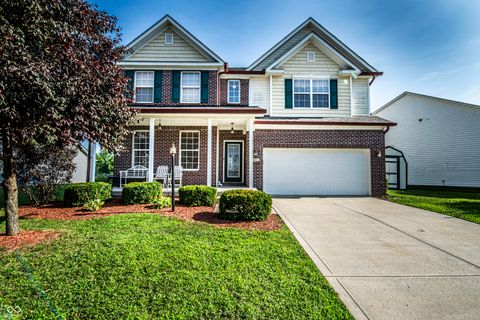
7853 Wildwood Farms Ln, Indianapolis, IN 46239
$217
Cash flow
6.7%
Cash-on-Cash Return
7.7%
Cap rate
1.1%
Rent to Value Ratio
1,912 out of 2,079 properties for sale in Marion County
Limited Results Shown
Create a free account, or log in to reveal all property listings and enjoy the complete experience.
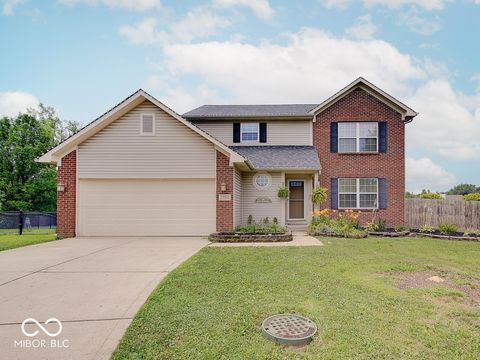
Active
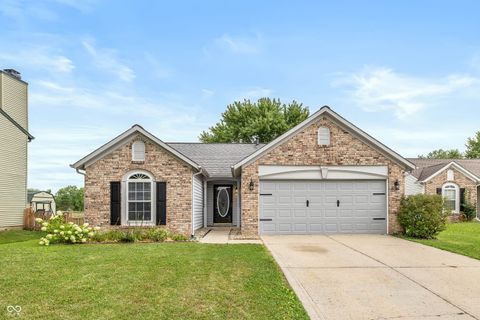
$259,900
3
bds
|
2
ba
|
1,262
sqft
|
built
2000
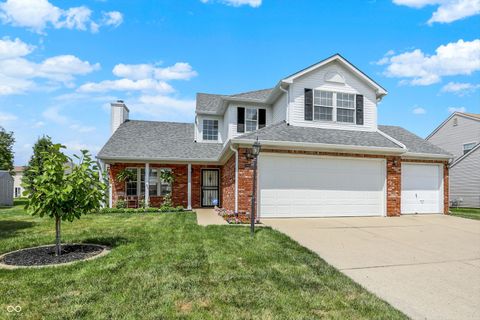
2325 Canvasback Dr, Indianapolis, IN 46234
$-89
Cash flow
-1.8%
Cash-on-Cash Return
5.7%
Cap rate
0.7%
Rent to Value Ratio
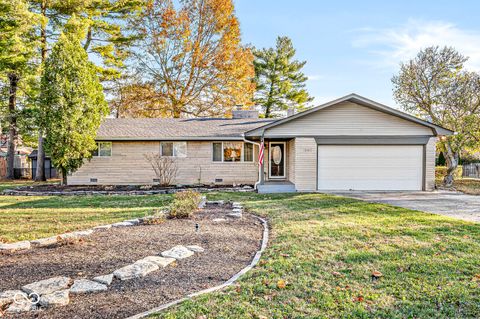
Active
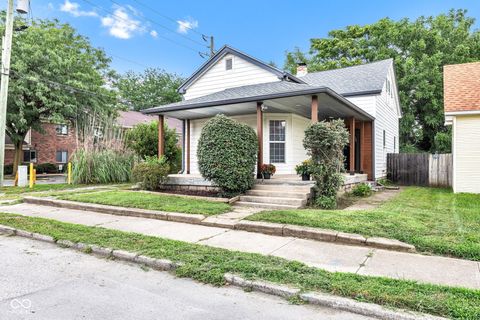
$274,999
3
bds
|
2
ba
|
1,734
sqft
|
built
1955
1542 W New York St, Indianapolis, IN 46222
$-29
Cash flow
-0.6%
Cash-on-Cash Return
6.0%
Cap rate
0.7%
Rent to Value Ratio
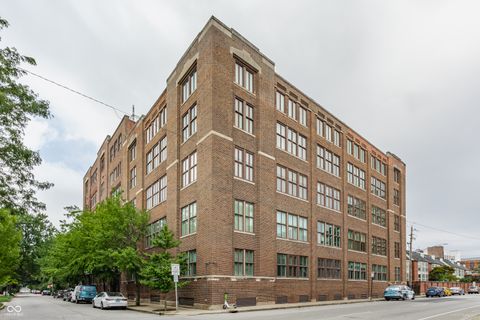
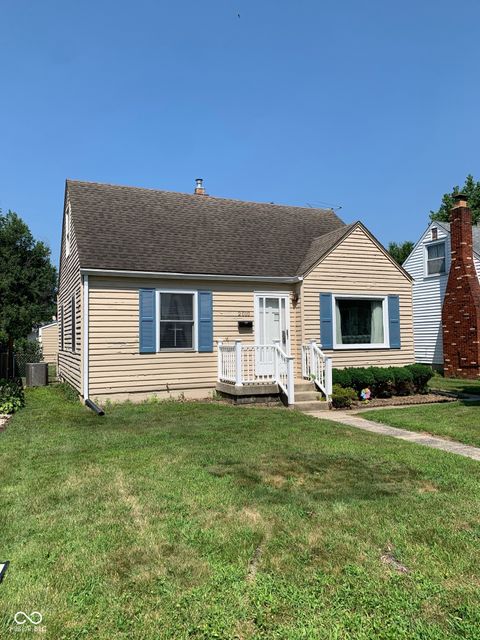
Active
$299,000
1
bds
|
1
ba
|
1,197
sqft
|
built
1910
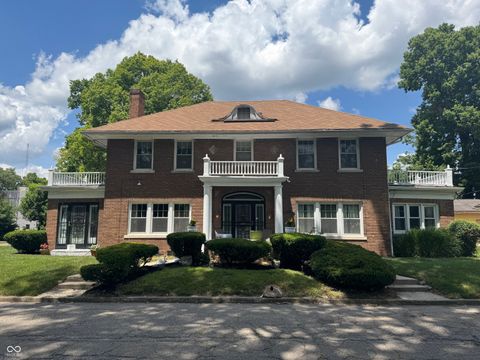
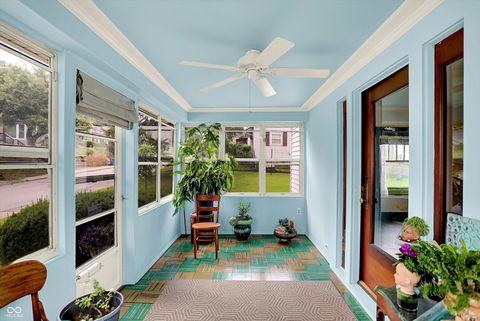
430 N Park Ave, Indianapolis, IN 46202
$-715
Cash flow
-12.5%
Cash-on-Cash Return
3.3%
Cap rate
0.7%
Rent to Value Ratio
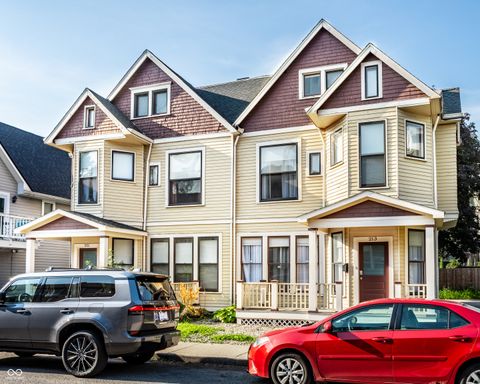
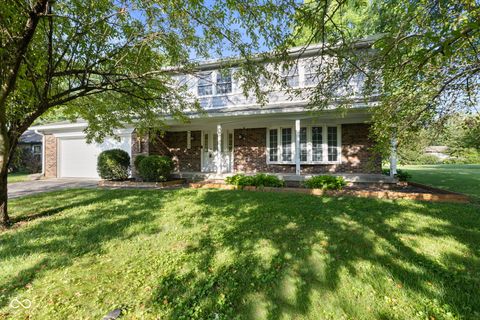
Active
$399,000
3
bds
|
4
ba
|
1,536
sqft
|
built
1905
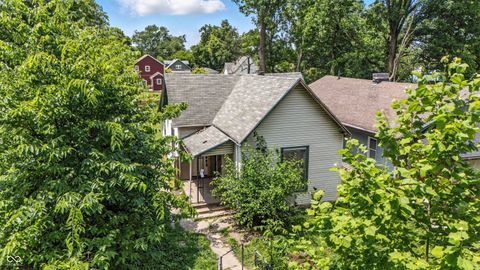
213 E 15th St, Indianapolis, IN 46202
$-319
Cash flow
-4.2%
Cash-on-Cash Return
5.2%
Cap rate
0.6%
Rent to Value Ratio
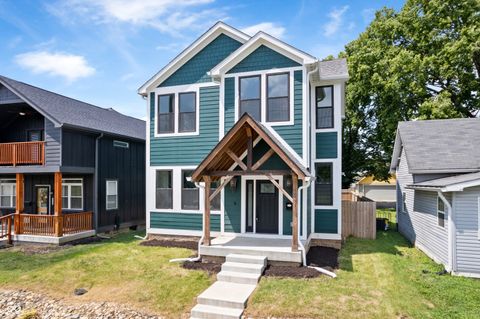
Active
$399,900
4
bds
|
3
ba
|
2,955
sqft
|
built
2024
1718 Milburn St, Indianapolis, IN 46202
$160
Cash flow
2.1%
Cash-on-Cash Return
6.6%
Cap rate
0.8%
Rent to Value Ratio

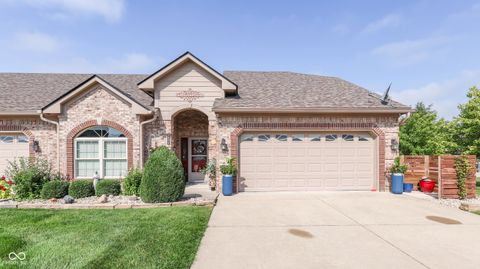
Active
$649,000
5
bds
|
3
ba
|
2,320
sqft
|
built
1965
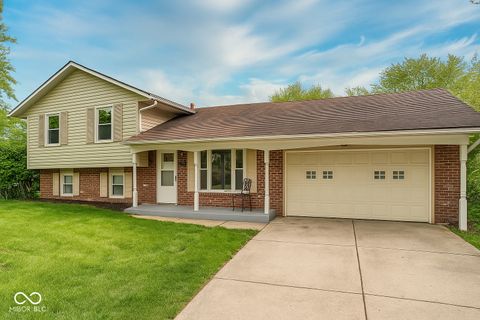
4219 Terra Dr, Indianapolis, IN 46237
$-1,807
Cash flow
-14.5%
Cash-on-Cash Return
2.8%
Cap rate
0.3%
Rent to Value Ratio
Active
$309,500
2
bds
|
2
ba
|
2,011
sqft
|
built
2007
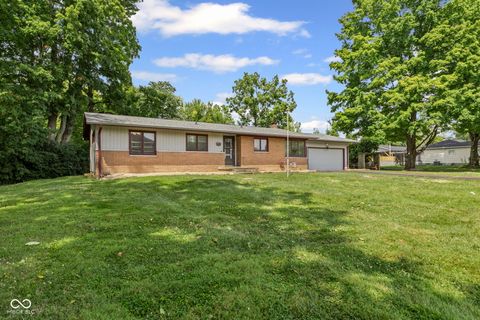
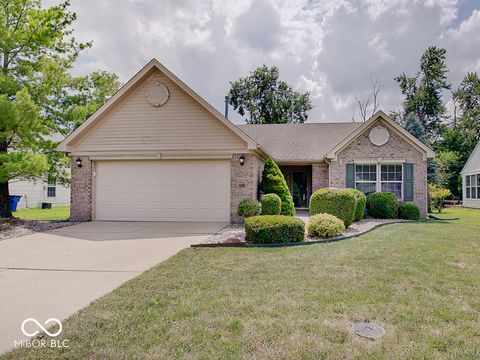
7804 Rosa Dr, Indianapolis, IN 46237
$-209
Cash flow
-3.5%
Cash-on-Cash Return
5.3%
Cap rate
0.7%
Rent to Value Ratio
Active
$190,000
3
bds
|
1
ba
|
1,054
sqft
|
built
2006
2615 Shelby St, Indianapolis, IN 46203
$131
Cash flow
3.6%
Cash-on-Cash Return
7.0%
Cap rate
0.8%
Rent to Value Ratio
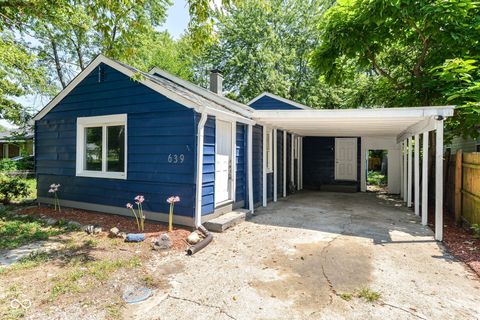
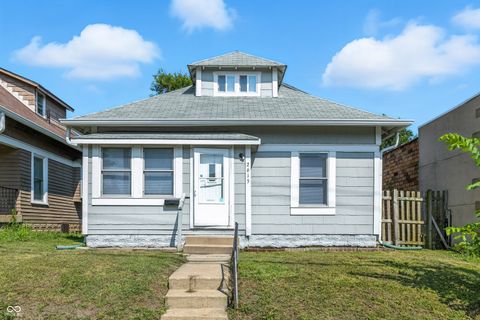
Active
$199,900
3
bds
|
2
ba
|
1,398
sqft
|
built
1940
639 S Worth Ave, Indianapolis, IN 46241
$-58
Cash flow
-1.5%
Cash-on-Cash Return
5.8%
Cap rate
0.7%
Rent to Value Ratio
Active
$375,000
4
bds
|
3
ba
|
2,342
sqft
|
built
1991
11935 Glen Scott Dr, Indianapolis, IN 46236
$-229
Cash flow
-3.2%
Cash-on-Cash Return
5.4%
Cap rate
0.7%
Rent to Value Ratio
Active
$105,000
2
bds
|
2
ba
|
1,485
sqft
|
built
1973
6417 Park Central Dr W, Indianapolis, IN 46260
$6
Cash flow
0.3%
Cash-on-Cash Return
6.2%
Cap rate
1.4%
Rent to Value Ratio
Active
$325,000
3
bds
|
4
ba
|
2,184
sqft
|
built
1955
3733 Winthrop Ave, Indianapolis, IN 46205
$-285
Cash flow
-4.6%
Cash-on-Cash Return
5.1%
Cap rate
0.6%
Rent to Value Ratio
Active
$100,000
2
bds
|
1
ba
|
984
sqft
|
built
1893
2426 N Lasalle St, Indianapolis, IN 46218
$178
Cash flow
9.3%
Cash-on-Cash Return
8.3%
Cap rate
1.0%
Rent to Value Ratio
Active
$300,000
3
bds
|
2
ba
|
2,148
sqft
|
built
1973
3911 Eastwind St, Indianapolis, IN 46237
$-295
Cash flow
-5.1%
Cash-on-Cash Return
5.0%
Cap rate
0.6%
Rent to Value Ratio
Active
$239,999
3
bds
|
2
ba
|
2,500
sqft
|
built
1957
5832 Norcroft Dr, Indianapolis, IN 46221
$13
Cash flow
0.3%
Cash-on-Cash Return
6.2%
Cap rate
0.8%
Rent to Value Ratio
Active
$315,000
3
bds
|
3
ba
|
2,156
sqft
|
built
1975
5403 Honey Comb Ln, Indianapolis, IN 46221
$-372
Cash flow
-6.2%
Cash-on-Cash Return
4.7%
Cap rate
0.6%
Rent to Value Ratio
Active
$1,450,000
5
bds
|
4
ba
|
3,382
sqft
|
built
1984
2780 Wicker Rd, Indianapolis, IN 46217
$-5,427
Cash flow
-19.5%
Cash-on-Cash Return
1.7%
Cap rate
0.2%
Rent to Value Ratio
Active
$225,000
4
bds
|
3
ba
|
1,584
sqft
|
built
1982
6137 Apache Dr, Indianapolis, IN 46254
$-220
Cash flow
-5.1%
Cash-on-Cash Return
5.0%
Cap rate
0.8%
Rent to Value Ratio
Active
$385,000
4
bds
|
3
ba
|
2,150
sqft
|
built
1990
7739 Chesapeake Dr W, Indianapolis, IN 46236
$-423
Cash flow
-5.7%
Cash-on-Cash Return
4.8%
Cap rate
0.6%
Rent to Value Ratio
Active
$280,000
2
bds
|
3
ba
|
1,775
sqft
|
built
1997
7948 Bent Willow Dr, Indianapolis, IN 46239
$-1
Cash flow
0.0%
Cash-on-Cash Return
6.1%
Cap rate
0.8%
Rent to Value Ratio
Active
$315,000
3
bds
|
2
ba
|
1,528
sqft
|
built
2001
12551 Castilla Pl, Indianapolis, IN 46236
$-273
Cash flow
-4.5%
Cash-on-Cash Return
5.1%
Cap rate
0.6%
Rent to Value Ratio
Active
$280,000
2
bds
|
2
ba
|
1,829
sqft
|
built
1923
2502 S Delaware St, Indianapolis, IN 46225
$-330
Cash flow
-6.1%
Cash-on-Cash Return
4.7%
Cap rate
0.6%
Rent to Value Ratio
Active
$415,000
7
bds
|
4
ba
|
4,502
sqft
|
built
2009
7407 Ponderosa Pines Ln, Indianapolis, IN 46239
$-20
Cash flow
-0.3%
Cash-on-Cash Return
6.1%
Cap rate
0.7%
Rent to Value Ratio
Active
$181,700
3
bds
|
2
ba
|
925
sqft
|
built
1951
3536 N Hawthorne Ln, Indianapolis, IN 46218
$-34
Cash flow
-1.0%
Cash-on-Cash Return
5.9%
Cap rate
0.7%
Rent to Value Ratio
Active
$350,000
3
bds
|
3
ba
|
2,485
sqft
|
built
2012
922 Iowa St, Indianapolis, IN 46203
$-68
Cash flow
-1.0%
Cash-on-Cash Return
5.9%
Cap rate
0.7%
Rent to Value Ratio
Active
$184,900
3
bds
|
1
ba
|
1,469
sqft
|
built
1954
4917 W 34th St, Indianapolis, IN 46224
$157
Cash flow
4.4%
Cash-on-Cash Return
7.2%
Cap rate
0.9%
Rent to Value Ratio
Active
$374,900
4
bds
|
3
ba
|
2,264
sqft
|
built
2001
7981 Arvada Pl, Indianapolis, IN 46236
$-234
Cash flow
-3.3%
Cash-on-Cash Return
5.4%
Cap rate
0.7%
Rent to Value Ratio
Active
$350,000
3
bds
|
3
ba
|
2,489
sqft
|
built
1995
3902 Jekyll Ct, Indianapolis, IN 46237
$-275
Cash flow
-4.1%
Cash-on-Cash Return
5.2%
Cap rate
0.6%
Rent to Value Ratio
Active
$135,000
3
bds
|
1
ba
|
1,084
sqft
|
built
1931
3731 Caroline Ave, Indianapolis, IN 46218
$205
Cash flow
7.9%
Cash-on-Cash Return
8.0%
Cap rate
1.0%
Rent to Value Ratio
Active
$299,900
3
bds
|
2
ba
|
1,588
sqft
|
built
1966
8201 Linda Leigh Ln, Indianapolis, IN 46217
$-156
Cash flow
-2.7%
Cash-on-Cash Return
5.5%
Cap rate
0.7%
Rent to Value Ratio
Active
$219,000
4
bds
|
1
ba
|
1,066
sqft
|
built
1948
2010 Winton Ave, Indianapolis, IN 46224
$-18
Cash flow
-0.4%
Cash-on-Cash Return
6.0%
Cap rate
0.7%
Rent to Value Ratio
Active
$299,000
4
bds
|
3
ba
|
1,934
sqft
|
built
1974
9028 Colgate St, Indianapolis, IN 46268
$5
Cash flow
0.1%
Cash-on-Cash Return
6.2%
Cap rate
0.8%
Rent to Value Ratio
Active
$300,000
2
bds
|
1
ba
|
1,520
sqft
|
built
1953
9502 Broadway St, Indianapolis, IN 46240
$-19
Cash flow
-0.3%
Cash-on-Cash Return
6.1%
Cap rate
0.7%
Rent to Value Ratio
Active
$114,900
2
bds
|
1
ba
|
1,216
sqft
|
built
1966
7480 Country Brook Dr, Indianapolis, IN 46260
$9
Cash flow
0.4%
Cash-on-Cash Return
6.2%
Cap rate
1.2%
Rent to Value Ratio
Active
$174,999
3
bds
|
1
ba
|
992
sqft
|
built
1948
3426 N Olney St, Indianapolis, IN 46218
$1
Cash flow
0.0%
Cash-on-Cash Return
6.2%
Cap rate
0.7%
Rent to Value Ratio
Active
$635,000
3
bds
|
3
ba
|
1,966
sqft
|
built
1924
206 E 51st St, Indianapolis, IN 46205
$-562
Cash flow
-4.6%
Cash-on-Cash Return
5.1%
Cap rate
0.6%
Rent to Value Ratio
Active
$214,000
4
bds
|
2
ba
|
1,944
sqft
|
built
1930
9747 E 46th St, Indianapolis, IN 46235
$146
Cash flow
3.6%
Cash-on-Cash Return
7.0%
Cap rate
0.8%
Rent to Value Ratio
Active
$145,000
3
bds
|
1
ba
|
1,056
sqft
|
built
1926
331 S Oakland Ave, Indianapolis, IN 46201
$-53
Cash flow
-1.9%
Cash-on-Cash Return
5.7%
Cap rate
0.7%
Rent to Value Ratio