Marion County Investment Properties for Sale
Browse homes for sale and investment properties in Marion County. Refine your search by price, property type, or more.
Best cash flowing properties in Marion County
Active
$60,000
2
bds
|
1
ba
|
1,640
sqft
|
built
1955
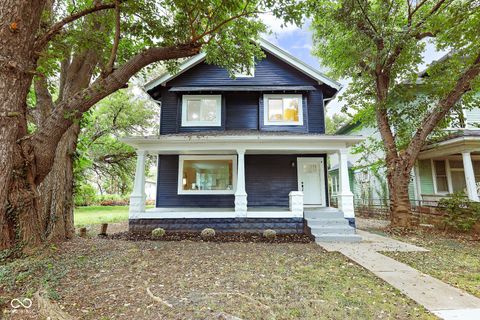
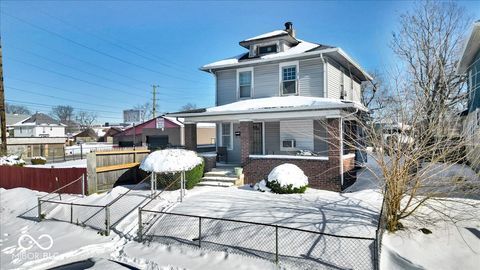
959 E Georgia St, Indianapolis, IN 46202
$1,104
Cash flow
21.4%
Cash-on-Cash Return
22.1%
Cap rate
2.7%
Rent to Value Ratio
Active
$59,900
2
bds
|
1
ba
|
1,043
sqft
|
built
1900
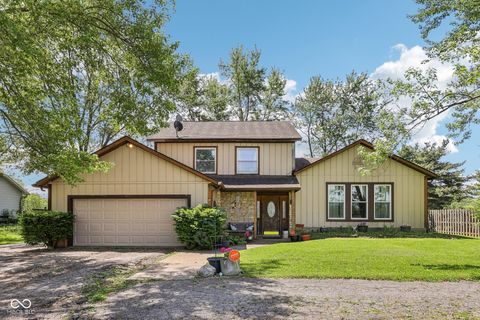
317 S Harris Ave, Indianapolis, IN 46222
$966
Cash flow
18.8%
Cash-on-Cash Return
19.4%
Cap rate
2.3%
Rent to Value Ratio
1,607 out of 1,746 properties for sale in Marion County
Limited Results Shown
Create a free account, or log in to reveal all property listings and enjoy the complete experience.
Active
$245,000
3
bds
|
0
ba
|
0
sqft
|
built
1990
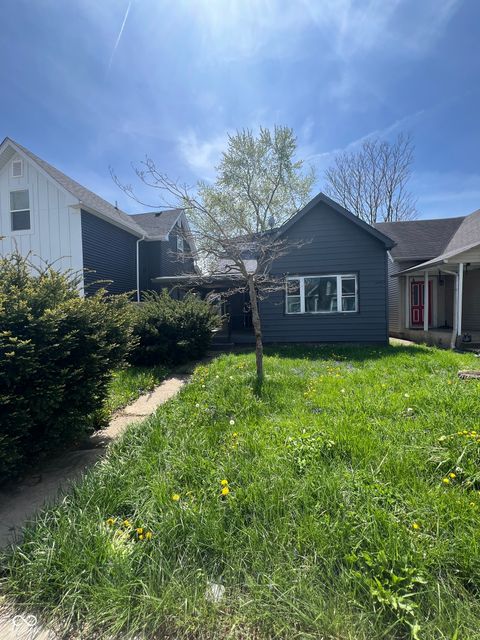
653 Birch Ave, Indianapolis, IN 46221
$-589
Cash flow
-12.5%
Cash-on-Cash Return
3.4%
Cap rate
0.4%
Rent to Value Ratio

Active
$189,000
2
bds
|
0
ba
|
0
sqft
|
built
1920
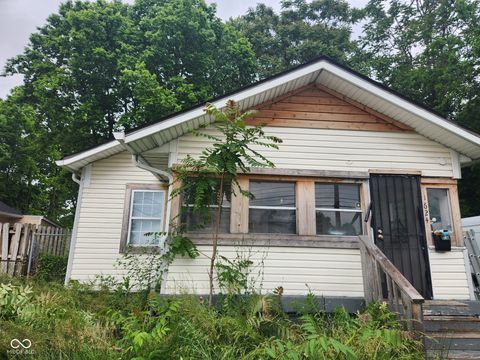
4710 E Michigan St, Indianapolis, IN 46201
$-366
Cash flow
-10.1%
Cash-on-Cash Return
3.9%
Cap rate
0.5%
Rent to Value Ratio

Active
$89,900
3
bds
|
1
ba
|
1,498
sqft
|
built
1925
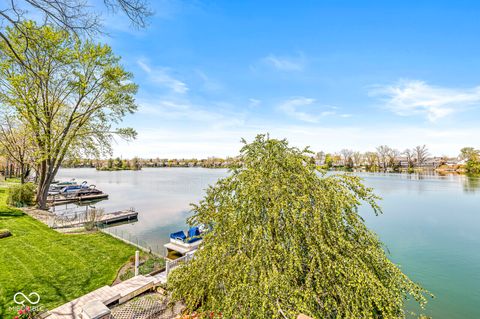
1138 W 33rd St, Indianapolis, IN 46208
$290
Cash flow
16.8%
Cash-on-Cash Return
10.1%
Cap rate
1.2%
Rent to Value Ratio
Active
$279,900
4
bds
|
2
ba
|
2,112
sqft
|
built
1900
1115 N Keystone Ave, Indianapolis, IN 46201
$-81
Cash flow
-1.5%
Cash-on-Cash Return
5.9%
Cap rate
0.7%
Rent to Value Ratio
Active
$294,000
4
bds
|
3
ba
|
2,402
sqft
|
built
1910
3031 N New Jersey St, Indianapolis, IN 46205
$397
Cash flow
7.0%
Cash-on-Cash Return
7.9%
Cap rate
1.0%
Rent to Value Ratio

Active
$340,000
4
bds
|
4
ba
|
1,680
sqft
|
built
1960
2421 E 11th St, Indianapolis, IN 46201
$-50
Cash flow
-0.8%
Cash-on-Cash Return
6.1%
Cap rate
0.7%
Rent to Value Ratio
Active
$215,000
4
bds
|
1
ba
|
1,459
sqft
|
built
1952
409 Parkway Ave, Indianapolis, IN 46225
$-294
Cash flow
-7.1%
Cash-on-Cash Return
4.6%
Cap rate
0.6%
Rent to Value Ratio

Active
$624,900
5
bds
|
4
ba
|
4,165
sqft
|
built
1989
6575 Robin Hood Dr, Indianapolis, IN 46227
$-1,311
Cash flow
-10.9%
Cash-on-Cash Return
3.7%
Cap rate
0.5%
Rent to Value Ratio
Active
$150,000
2
bds
|
1
ba
|
720
sqft
|
built
1910
1624 E 30th St, Indianapolis, IN 46218
$114
Cash flow
4.0%
Cash-on-Cash Return
7.2%
Cap rate
0.9%
Rent to Value Ratio

Active
$288,900
5
bds
|
2
ba
|
2,289
sqft
|
built
1956
1607 Elmhurst Dr, Indianapolis, IN 46219
$-266
Cash flow
-4.8%
Cash-on-Cash Return
5.2%
Cap rate
0.6%
Rent to Value Ratio

Active
$475,000
3
bds
|
3
ba
|
2,468
sqft
|
built
1951
7060 N Park Ave, Indianapolis, IN 46220
$-341
Cash flow
-3.7%
Cash-on-Cash Return
5.4%
Cap rate
0.7%
Rent to Value Ratio

Active
$449,000
4
bds
|
4
ba
|
2,872
sqft
|
built
1962
5433 Brendonridge Rd, Indianapolis, IN 46226
$-763
Cash flow
-8.9%
Cash-on-Cash Return
4.2%
Cap rate
0.5%
Rent to Value Ratio

Active
$199,900
4
bds
|
2
ba
|
1,737
sqft
|
built
1920
1511 E Tabor St, Indianapolis, IN 46203
$-147
Cash flow
-3.8%
Cash-on-Cash Return
5.4%
Cap rate
0.7%
Rent to Value Ratio
Active
$1,250,000
4
bds
|
5
ba
|
6,882
sqft
|
built
1988
3748 Bay Road South Dr, Indianapolis, IN 46240
$-2,735
Cash flow
-11.4%
Cash-on-Cash Return
3.6%
Cap rate
0.5%
Rent to Value Ratio
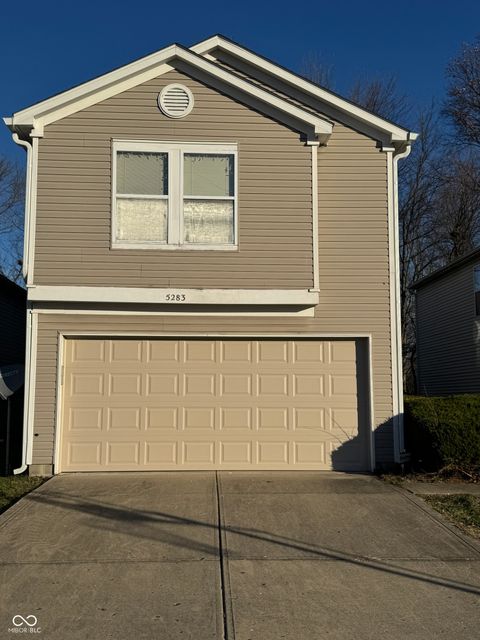
Active
$235,000
3
bds
|
4
ba
|
1,727
sqft
|
built
1998
5283 Tufton Dr, Indianapolis, IN 46254
$15
Cash flow
0.3%
Cash-on-Cash Return
6.3%
Cap rate
0.8%
Rent to Value Ratio

Active
$245,000
3
bds
|
2
ba
|
1,205
sqft
|
built
1989
8318 Rob Ln, Indianapolis, IN 46237
$-37
Cash flow
-0.8%
Cash-on-Cash Return
6.1%
Cap rate
0.7%
Rent to Value Ratio

Active
$292,900
3
bds
|
2
ba
|
1,264
sqft
|
built
1994
12157 Longstraw Dr, Indianapolis, IN 46236
$-161
Cash flow
-2.9%
Cash-on-Cash Return
5.6%
Cap rate
0.7%
Rent to Value Ratio

Active
$259,900
4
bds
|
3
ba
|
1,440
sqft
|
built
1991
2235 N Kenwood Ave, Indianapolis, IN 46208
$-115
Cash flow
-2.3%
Cash-on-Cash Return
5.7%
Cap rate
0.7%
Rent to Value Ratio

Active
$380,000
2
bds
|
3
ba
|
2,032
sqft
|
built
1900
1429 Fletcher Ave, Indianapolis, IN 46203
$-259
Cash flow
-3.6%
Cash-on-Cash Return
5.4%
Cap rate
0.7%
Rent to Value Ratio

Active
$699,000
5
bds
|
3
ba
|
3,218
sqft
|
built
1913
140 E 44th St, Indianapolis, IN 46205
$-1,855
Cash flow
-13.8%
Cash-on-Cash Return
3.1%
Cap rate
0.4%
Rent to Value Ratio
Active
$314,900
4
bds
|
2
ba
|
2,006
sqft
|
built
1956
1248 Hathaway Dr, Indianapolis, IN 46229
$-264
Cash flow
-4.4%
Cash-on-Cash Return
5.3%
Cap rate
0.6%
Rent to Value Ratio

Active
$262,500
3
bds
|
3
ba
|
1,964
sqft
|
built
1920
1601 Spruce St, Indianapolis, IN 46203
$10
Cash flow
0.2%
Cash-on-Cash Return
6.3%
Cap rate
0.8%
Rent to Value Ratio

Active
$259,900
3
bds
|
3
ba
|
1,728
sqft
|
built
1916
1224 N Olney St, Indianapolis, IN 46201
$23
Cash flow
0.5%
Cash-on-Cash Return
6.4%
Cap rate
0.8%
Rent to Value Ratio

Active
$230,000
3
bds
|
2
ba
|
1,355
sqft
|
built
2000
540 Cahill Ln, Indianapolis, IN 46214
$4
Cash flow
0.1%
Cash-on-Cash Return
6.3%
Cap rate
0.8%
Rent to Value Ratio

Active
$374,500
4
bds
|
4
ba
|
2,074
sqft
|
built
1910
1938 E 11th St, Indianapolis, IN 46201
$-23
Cash flow
-0.3%
Cash-on-Cash Return
6.2%
Cap rate
0.7%
Rent to Value Ratio

Active
$232,000
4
bds
|
1
ba
|
1,424
sqft
|
built
1973
5041 Norcroft Dr, Indianapolis, IN 46221
$-107
Cash flow
-2.4%
Cash-on-Cash Return
5.7%
Cap rate
0.7%
Rent to Value Ratio

Active
$244,900
4
bds
|
2
ba
|
1,924
sqft
|
built
1957
6117 Marilyn Rd, Indianapolis, IN 46226
$-175
Cash flow
-3.7%
Cash-on-Cash Return
5.4%
Cap rate
0.7%
Rent to Value Ratio

Active
$212,000
3
bds
|
2
ba
|
1,556
sqft
|
built
1920
3458 N Kenwood Ave, Indianapolis, IN 46208
$66
Cash flow
1.6%
Cash-on-Cash Return
6.6%
Cap rate
0.8%
Rent to Value Ratio
Active
$325,000
2
bds
|
2
ba
|
1,120
sqft
|
built
1984
1548 N Park Ave, Indianapolis, IN 46202
$-179
Cash flow
-2.9%
Cash-on-Cash Return
5.6%
Cap rate
0.7%
Rent to Value Ratio
Active
$135,000
2
bds
|
1
ba
|
930
sqft
|
built
1920
361 S Spencer Ave, Indianapolis, IN 46219
$261
Cash flow
10.1%
Cash-on-Cash Return
8.6%
Cap rate
1.0%
Rent to Value Ratio

Active
$305,000
4
bds
|
3
ba
|
2,036
sqft
|
built
1987
7670 Lippincott Way, Indianapolis, IN 46268
$-77
Cash flow
-1.3%
Cash-on-Cash Return
6.0%
Cap rate
0.7%
Rent to Value Ratio

Active
$149,900
2
bds
|
1
ba
|
736
sqft
|
built
1948
1612 E Raymond St, Indianapolis, IN 46203
$183
Cash flow
6.4%
Cash-on-Cash Return
7.7%
Cap rate
0.9%
Rent to Value Ratio

Active
$219,000
3
bds
|
3
ba
|
1,440
sqft
|
built
2006
10425 Candy Apple Ln, Indianapolis, IN 46235
$237
Cash flow
5.6%
Cash-on-Cash Return
7.6%
Cap rate
0.9%
Rent to Value Ratio
Active
$190,000
2
bds
|
1
ba
|
1,140
sqft
|
built
1918
2957 Winthrop Ave, Indianapolis, IN 46205
$-26
Cash flow
-0.7%
Cash-on-Cash Return
6.1%
Cap rate
0.7%
Rent to Value Ratio

Active
$239,900
3
bds
|
2
ba
|
2,080
sqft
|
built
1962
3720 E Southern Ave, Indianapolis, IN 46203
$-10
Cash flow
-0.2%
Cash-on-Cash Return
6.2%
Cap rate
0.8%
Rent to Value Ratio

Active
$260,000
2
bds
|
1
ba
|
1,311
sqft
|
built
1937
5435 E 10th St, Indianapolis, IN 46219
$23
Cash flow
0.5%
Cash-on-Cash Return
6.4%
Cap rate
0.8%
Rent to Value Ratio
Active
$265,000
3
bds
|
3
ba
|
1,857
sqft
|
built
1980
11733 E 21st St, Indianapolis, IN 46229
$-3
Cash flow
-0.1%
Cash-on-Cash Return
6.2%
Cap rate
0.8%
Rent to Value Ratio

Active
$315,000
3
bds
|
3
ba
|
2,004
sqft
|
built
2011
5151 Climbing Rose Pl, Indianapolis, IN 46254
$-83
Cash flow
-1.4%
Cash-on-Cash Return
6.0%
Cap rate
0.7%
Rent to Value Ratio