Vigo County Investment Properties for Sale
Browse homes for sale and investment properties in Vigo County. Refine your search by price, property type, or more.
Best cash flowing properties in Vigo County
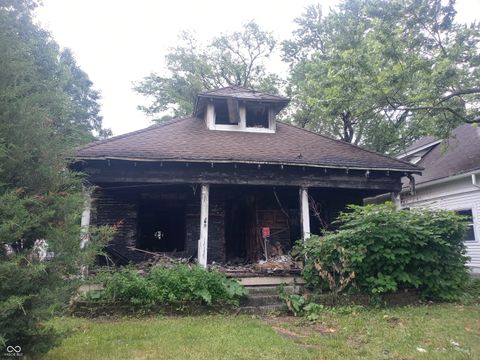
Active
$6,900
3
bds
|
3
ba
|
3,304
sqft
|
built
1920
1502 S 11th 1/2 St, Terre Haute, IN 47802
$966
Cash flow
163.1%
Cash-on-Cash Return
168.0%
Cap rate
20.3%
Rent to Value Ratio
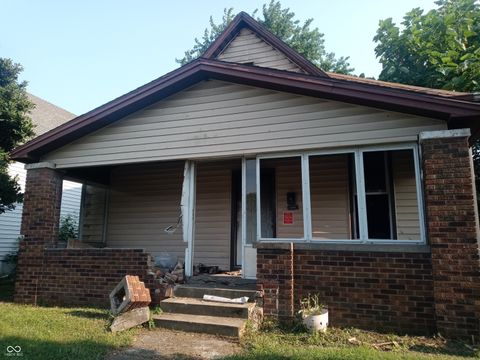
Active
$6,900
2
bds
|
1
ba
|
2,219
sqft
|
built
1901
1505 Poplar St, Terre Haute, IN 47807
$828
Cash flow
139.8%
Cash-on-Cash Return
144.0%
Cap rate
17.4%
Rent to Value Ratio
23 out of 25 properties for sale in Vigo County
Limited Results Shown
Create a free account, or log in to reveal all property listings and enjoy the complete experience.
Active
$165,000
5
bds
|
3
ba
|
3,006
sqft
|
built
1910
809 Maple Ave, Terre Haute, IN 47804
$397
Cash flow
12.6%
Cash-on-Cash Return
9.0%
Cap rate
1.1%
Rent to Value Ratio
Active
$62,000
3
bds
|
1
ba
|
1,452
sqft
|
built
1890
2228 Tippecanoe St, Terre Haute, IN 47807
$828
Cash flow
15.6%
Cash-on-Cash Return
16.0%
Cap rate
1.9%
Rent to Value Ratio
Active
$135,000
5
bds
|
2
ba
|
1,888
sqft
|
built
1895
1019 S 15th St, Terre Haute, IN 47807
$205
Cash flow
7.9%
Cash-on-Cash Return
8.0%
Cap rate
1.0%
Rent to Value Ratio
Active
$79,900
4
bds
|
2
ba
|
2,666
sqft
|
built
1890
1139 S 7th St, Terre Haute, IN 47802
$419
Cash flow
27.4%
Cash-on-Cash Return
12.4%
Cap rate
1.5%
Rent to Value Ratio
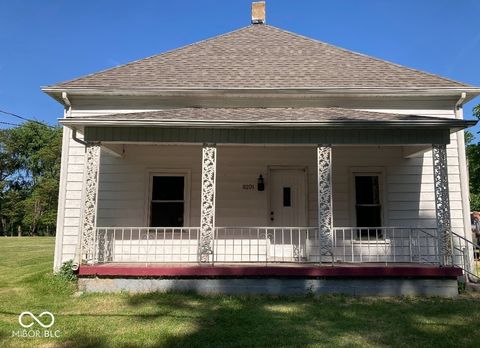
Active
$140,000
3
bds
|
1
ba
|
1,631
sqft
|
built
1900
8201 N Baldwin St, Brazil, IN 47834
$42
Cash flow
1.6%
Cash-on-Cash Return
6.5%
Cap rate
0.8%
Rent to Value Ratio
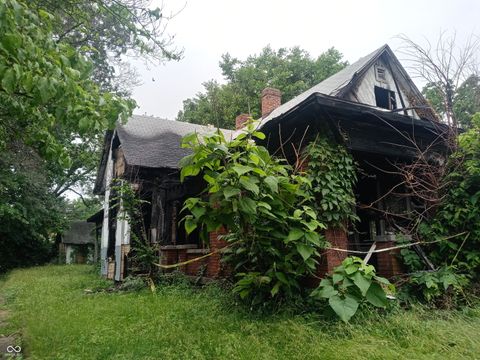
Active
$15,900
5
bds
|
0
ba
|
0
sqft
|
built
1900
1910 Locust St, Terre Haute, IN 47807
$759
Cash flow
55.6%
Cash-on-Cash Return
57.3%
Cap rate
6.9%
Rent to Value Ratio
Active
$189,900
3
bds
|
2
ba
|
1,600
sqft
|
built
1967
1901 E Buena Vista Dr, Terre Haute, IN 47802
$-7
Cash flow
-0.2%
Cash-on-Cash Return
6.1%
Cap rate
0.7%
Rent to Value Ratio
Active
$189,900
4
bds
|
2
ba
|
2,115
sqft
|
built
1907
2227 Sycamore St, Terre Haute, IN 47807
$407
Cash flow
11.2%
Cash-on-Cash Return
8.7%
Cap rate
1.1%
Rent to Value Ratio
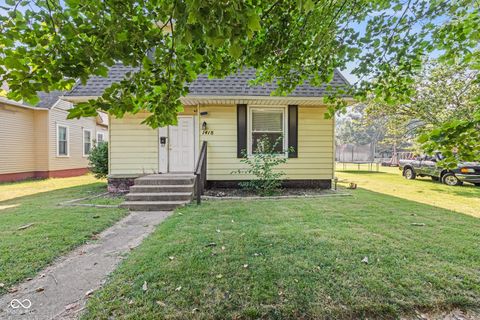
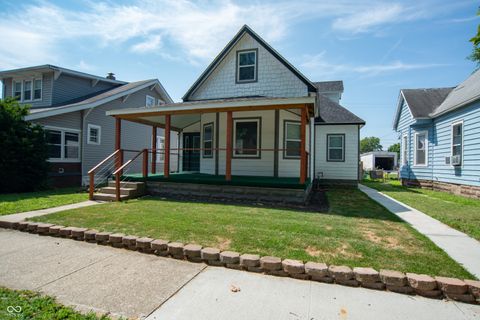
Active
$175,000
4
bds
|
3
ba
|
2,680
sqft
|
built
1900
1418 S 7th St, Terre Haute, IN 47802
$70
Cash flow
2.1%
Cash-on-Cash Return
6.6%
Cap rate
0.8%
Rent to Value Ratio

Active
$219,997
3
bds
|
3
ba
|
2,104
sqft
|
built
1910
1925 S 4th St, Terre Haute, IN 47802
$529
Cash flow
12.5%
Cash-on-Cash Return
9.0%
Cap rate
1.1%
Rent to Value Ratio
Active
$6,900
3
bds
|
1
ba
|
1,857
sqft
|
built
1903
925 S 10th St, Terre Haute, IN 47807
$759
Cash flow
128.2%
Cash-on-Cash Return
132.0%
Cap rate
15.9%
Rent to Value Ratio
Active
$139,900
2
bds
|
1
ba
|
768
sqft
|
built
1950
2843 Garfield Ave, Terre Haute, IN 47804
$-27
Cash flow
-1.0%
Cash-on-Cash Return
5.9%
Cap rate
0.7%
Rent to Value Ratio
Active
$99,900
2
bds
|
2
ba
|
1,806
sqft
|
built
1895
1414 Maple Ave, Terre Haute, IN 47804
$454
Cash flow
23.7%
Cash-on-Cash Return
11.6%
Cap rate
1.4%
Rent to Value Ratio
Active
$119,900
3
bds
|
2
ba
|
2,150
sqft
|
built
1916
1800 Park St, Terre Haute, IN 47803
$490
Cash flow
21.3%
Cash-on-Cash Return
11.0%
Cap rate
1.3%
Rent to Value Ratio
Active
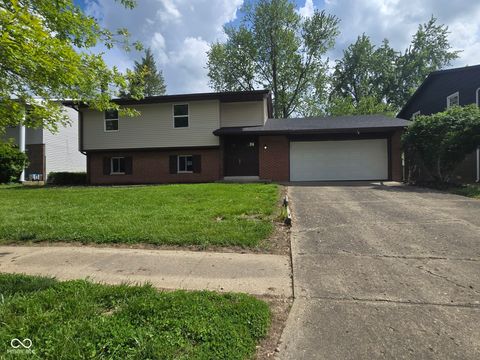
$279,900
4
bds
|
3
ba
|
1,708
sqft
|
built
2001
3919 W Wahachee Dr, Terre Haute, IN 47802
$-330
Cash flow
-6.2%
Cash-on-Cash Return
4.7%
Cap rate
0.6%
Rent to Value Ratio
Active
$279,000
4
bds
|
3
ba
|
1,824
sqft
|
built
1980
7737 N 42nd St, Terre Haute, IN 47805
$-325
Cash flow
-6.1%
Cash-on-Cash Return
4.7%
Cap rate
0.6%
Rent to Value Ratio
Active
$134,900
2
bds
|
2
ba
|
1,350
sqft
|
built
1937
1335 S 20th St, Terre Haute, IN 47803
$206
Cash flow
8.0%
Cash-on-Cash Return
8.0%
Cap rate
1.0%
Rent to Value Ratio
Active
$130,000
2
bds
|
1
ba
|
1,434
sqft
|
built
1906
52 Home Ave, Terre Haute, IN 47803
$438
Cash flow
17.6%
Cash-on-Cash Return
10.2%
Cap rate
1.2%
Rent to Value Ratio
Active
$249,000
3
bds
|
2
ba
|
1,510
sqft
|
built
1968
6949 N Erickson St, Terre Haute, IN 47805
$-172
Cash flow
-3.6%
Cash-on-Cash Return
5.3%
Cap rate
0.6%
Rent to Value Ratio
Active
$379,900
3
bds
|
2
ba
|
2,086
sqft
|
built
1966
121 Woodbine, Terre Haute, IN 47803
$-842
Cash flow
-11.6%
Cash-on-Cash Return
3.5%
Cap rate
0.4%
Rent to Value Ratio
Active
$429,900
1
bds
|
3
ba
|
3,049
sqft
|
built
1978
1175 N Ellsworth Pl, West Terre Haute, IN 47885
$-1,098
Cash flow
-13.3%
Cash-on-Cash Return
3.1%
Cap rate
0.4%
Rent to Value Ratio