Indianapolis, IN Investment Properties for Sale
Browse homes for sale and investment properties in Indianapolis, IN. Refine your search by price, property type, or more.
Best cash flowing properties in Indianapolis, IN

Active
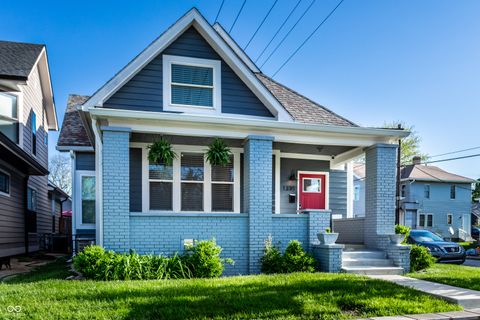
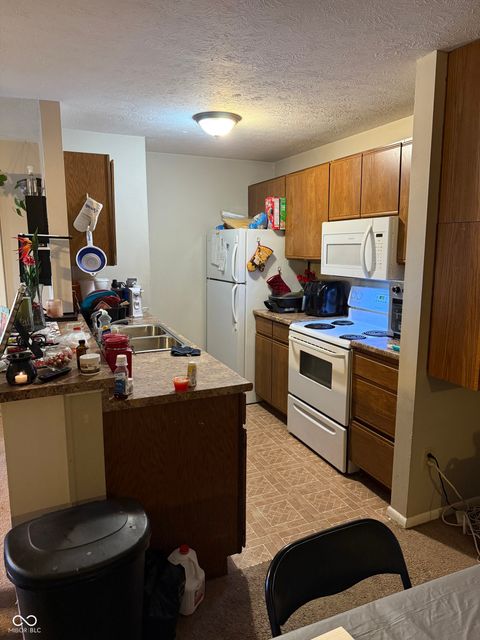
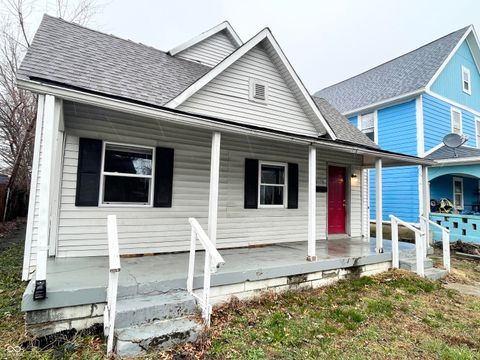
$99,000
3
bds
|
1
ba
|
1,176
sqft
|
built
1955
5858 E 44th St, Indianapolis, IN 46226
$459
Cash flow
24.2%
Cash-on-Cash Return
11.7%
Cap rate
1.4%
Rent to Value Ratio
Active
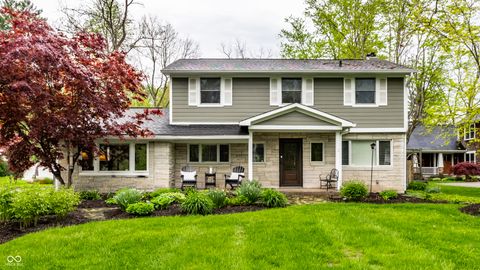
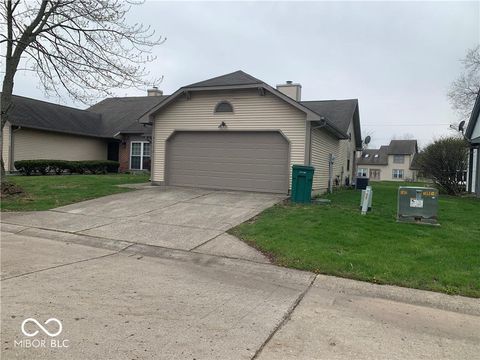
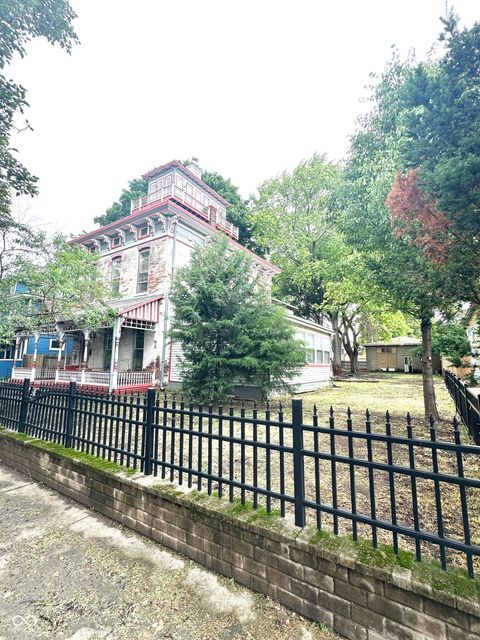
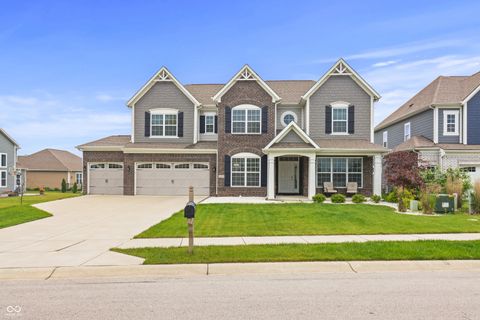
$415,000
3
bds
|
3
ba
|
2,767
sqft
|
built
1910
1330 Marlowe Ave, Indianapolis, IN 46202
$358
Cash flow
4.5%
Cash-on-Cash Return
7.2%
Cap rate
0.9%
Rent to Value Ratio
1,717 out of 2,339 properties for sale in Indianapolis, IN
Limited Results Shown
Create a free account, or log in to reveal all property listings and enjoy the complete experience.

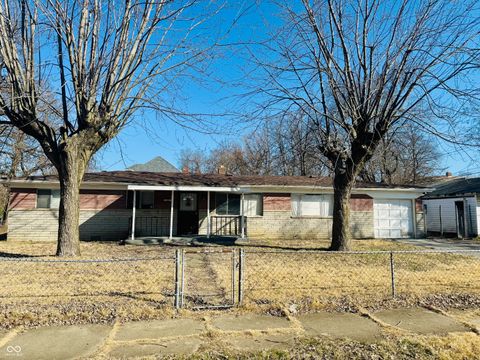
Active
$259,900
3
bds
|
2
ba
|
1,377
sqft
|
built
1965
2951 S Elizabeth St, Indianapolis, IN 46203
$-227
Cash flow
-4.6%
Cash-on-Cash Return
5.1%
Cap rate
0.6%
Rent to Value Ratio
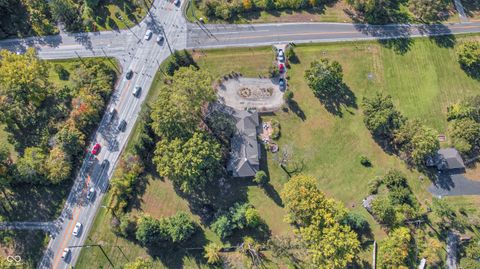
Active
$999,000
4
bds
|
4
ba
|
3,611
sqft
|
built
1955
440 E 82nd St, Indianapolis, IN 46240
$-2,081
Cash flow
-10.9%
Cash-on-Cash Return
3.6%
Cap rate
0.4%
Rent to Value Ratio

Active
$389,999
4
bds
|
4
ba
|
2,488
sqft
|
built
2020
10890 Poppy Hill Dr, Indianapolis, IN 46234
$-108
Cash flow
-1.4%
Cash-on-Cash Return
5.8%
Cap rate
0.7%
Rent to Value Ratio

Active
$319,000
1
bds
|
1
ba
|
1,041
sqft
|
built
2015
622 E 10th St, Indianapolis, IN 46202
$-445
Cash flow
-7.3%
Cash-on-Cash Return
4.5%
Cap rate
0.7%
Rent to Value Ratio
Pending
$549,900
5
bds
|
3
ba
|
2,344
sqft
|
built
1985
529 E Merrill St, Indianapolis, IN 46203
$-609
Cash flow
-5.8%
Cash-on-Cash Return
4.8%
Cap rate
0.6%
Rent to Value Ratio

Active
$210,000
3
bds
|
3
ba
|
1,360
sqft
|
built
1966
1136 W 35th St, Indianapolis, IN 46208
$166
Cash flow
4.1%
Cash-on-Cash Return
7.1%
Cap rate
0.9%
Rent to Value Ratio

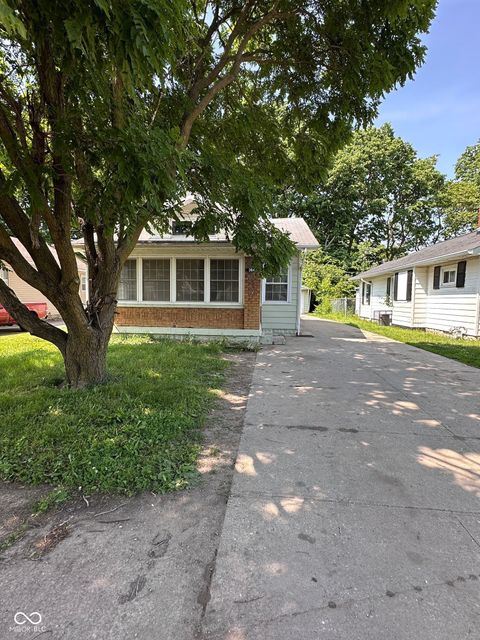
Active
$264,900
4
bds
|
3
ba
|
1,330
sqft
|
built
1947
233 N Devon Ave, Indianapolis, IN 46219
$-391
Cash flow
-7.7%
Cash-on-Cash Return
4.4%
Cap rate
0.5%
Rent to Value Ratio

Active
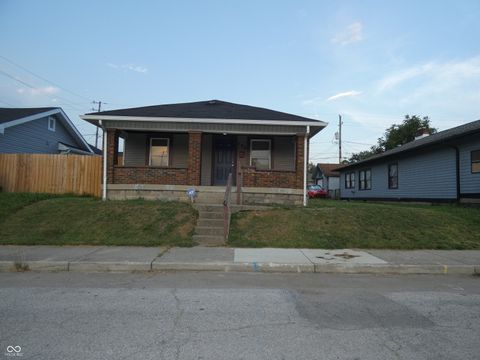
$145,000
2
bds
|
1
ba
|
720
sqft
|
built
1935
1311 N Denny St, Indianapolis, IN 46201
$223
Cash flow
8.0%
Cash-on-Cash Return
8.0%
Cap rate
1.0%
Rent to Value Ratio

Active
$150,000
3
bds
|
1
ba
|
1,008
sqft
|
built
1953
3314 Argyle Ct, Indianapolis, IN 46226
$198
Cash flow
6.9%
Cash-on-Cash Return
7.7%
Cap rate
0.9%
Rent to Value Ratio
Active
$574,900
4
bds
|
3
ba
|
3,541
sqft
|
built
1990
6520 Forrest Commons Blvd, Indianapolis, IN 46227
$-580
Cash flow
-5.3%
Cash-on-Cash Return
4.9%
Cap rate
0.6%
Rent to Value Ratio
Active
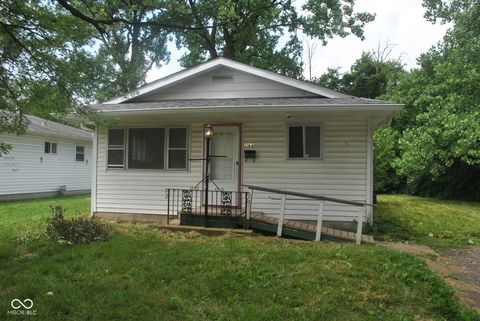
$99,000
3
bds
|
1
ba
|
1,176
sqft
|
built
1955
5858 E 44th St, Indianapolis, IN 46226
$459
Cash flow
24.2%
Cash-on-Cash Return
11.7%
Cap rate
1.4%
Rent to Value Ratio

Active
$79,900
2
bds
|
1
ba
|
1,040
sqft
|
built
1950
837 S Warman Ave, Indianapolis, IN 46221
$350
Cash flow
22.9%
Cash-on-Cash Return
11.4%
Cap rate
1.4%
Rent to Value Ratio

Active
$115,000
3
bds
|
1
ba
|
953
sqft
|
built
1940
4618 W Beecher St, Indianapolis, IN 46241
$239
Cash flow
10.8%
Cash-on-Cash Return
8.6%
Cap rate
1.0%
Rent to Value Ratio

Active
$120,000
3
bds
|
1
ba
|
1,006
sqft
|
built
1920
3704 Graceland Ave, Indianapolis, IN 46208
$351
Cash flow
15.3%
Cash-on-Cash Return
9.7%
Cap rate
1.2%
Rent to Value Ratio

Active
$275,000
5
bds
|
3
ba
|
1,840
sqft
|
built
1935
6640 E Washington St, Indianapolis, IN 46219
$-29
Cash flow
-0.6%
Cash-on-Cash Return
6.0%
Cap rate
0.7%
Rent to Value Ratio
Active
$135,000
2
bds
|
2
ba
|
993
sqft
|
built
1987
4291 Village Parkway Cir W, Indianapolis, IN 46254
$-38
Cash flow
-1.5%
Cash-on-Cash Return
5.8%
Cap rate
1.0%
Rent to Value Ratio
Active
$189,900
2
bds
|
2
ba
|
1,046
sqft
|
built
1989
4112 Eagle Cove East Dr, Indianapolis, IN 46254
$1
Cash flow
0.0%
Cash-on-Cash Return
6.2%
Cap rate
0.9%
Rent to Value Ratio
Active
$134,900
3
bds
|
2
ba
|
1,200
sqft
|
built
1961
260 W 33rd St, Indianapolis, IN 46208
$137
Cash flow
5.3%
Cash-on-Cash Return
7.4%
Cap rate
0.9%
Rent to Value Ratio
Active
$210,000
2
bds
|
1
ba
|
1,462
sqft
|
built
1930
1924 E Maryland St, Indianapolis, IN 46201
$-248
Cash flow
-6.2%
Cash-on-Cash Return
4.7%
Cap rate
0.6%
Rent to Value Ratio
Active
$415,000
3
bds
|
3
ba
|
2,767
sqft
|
built
1910
1330 Marlowe Ave, Indianapolis, IN 46202
$358
Cash flow
4.5%
Cash-on-Cash Return
7.2%
Cap rate
0.9%
Rent to Value Ratio
Active
$125,000
3
bds
|
1
ba
|
1,008
sqft
|
built
1967
2194 N Riley Ave, Indianapolis, IN 46218
$257
Cash flow
10.7%
Cash-on-Cash Return
8.6%
Cap rate
1.0%
Rent to Value Ratio

Active
$215,000
2
bds
|
0
ba
|
0
sqft
|
built
1920
626 N Euclid Ave, Indianapolis, IN 46201
$-411
Cash flow
-10.0%
Cash-on-Cash Return
3.9%
Cap rate
0.5%
Rent to Value Ratio
Active
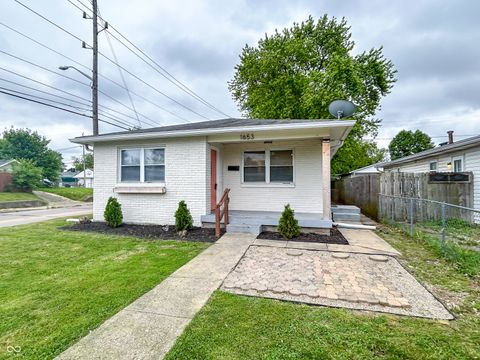
$185,900
3
bds
|
2
ba
|
1,128
sqft
|
built
1972
1653 Wade St, Indianapolis, IN 46203
$152
Cash flow
4.3%
Cash-on-Cash Return
7.1%
Cap rate
0.9%
Rent to Value Ratio
Active
$134,900
2
bds
|
1
ba
|
1,196
sqft
|
built
1920
4041 Boulevard Pl, Indianapolis, IN 46208
$275
Cash flow
10.6%
Cash-on-Cash Return
8.6%
Cap rate
1.0%
Rent to Value Ratio

Active
$204,900
2
bds
|
3
ba
|
1,386
sqft
|
built
2000
7042 Tyler Ln, Indianapolis, IN 46217
$-241
Cash flow
-6.1%
Cash-on-Cash Return
4.7%
Cap rate
0.8%
Rent to Value Ratio
Active
$185,000
3
bds
|
2
ba
|
2,016
sqft
|
built
1979
3131 Stillmeadow Dr, Indianapolis, IN 46214
$-56
Cash flow
-1.6%
Cash-on-Cash Return
5.8%
Cap rate
0.9%
Rent to Value Ratio

Active
$925,000
2
bds
|
3
ba
|
3,078
sqft
|
built
1940
610 N Park Ave, Indianapolis, IN 46204
$-1,702
Cash flow
-9.6%
Cash-on-Cash Return
3.9%
Cap rate
0.5%
Rent to Value Ratio
Active
$475,000
5
bds
|
2
ba
|
2,892
sqft
|
built
1876
866 Fletcher Ave, Indianapolis, IN 46203
$-294
Cash flow
-3.2%
Cash-on-Cash Return
5.4%
Cap rate
0.7%
Rent to Value Ratio

Active
$620,000
4
bds
|
4
ba
|
4,825
sqft
|
built
2004
7818 Fawnwood Dr, Indianapolis, IN 46278
$-874
Cash flow
-7.4%
Cash-on-Cash Return
4.5%
Cap rate
0.6%
Rent to Value Ratio
Active
$789,000
4
bds
|
5
ba
|
4,917
sqft
|
built
1940
6502 Allisonville Rd, Indianapolis, IN 46220
$-592
Cash flow
-3.9%
Cash-on-Cash Return
5.2%
Cap rate
0.6%
Rent to Value Ratio
Active
$159,900
3
bds
|
1
ba
|
1,120
sqft
|
built
1928
3646 Creston Dr, Indianapolis, IN 46222
$147
Cash flow
4.8%
Cash-on-Cash Return
7.2%
Cap rate
0.9%
Rent to Value Ratio

Active
$1,999,900
bds
|
0
ba
|
0
sqft
|
built
1964
3805 Biscayne Rd, Indianapolis, IN 46226
$-9,623
Cash flow
-25.1%
Cash-on-Cash Return
0.4%
Cap rate
0.0%
Rent to Value Ratio
Active
$138,800
2
bds
|
1
ba
|
942
sqft
|
built
1914
305 Leeds Ave, Indianapolis, IN 46201
$255
Cash flow
9.6%
Cash-on-Cash Return
8.4%
Cap rate
1.0%
Rent to Value Ratio
Active
$479,900
5
bds
|
4
ba
|
3,537
sqft
|
built
2019
10811 Wild Orchard Ln, Indianapolis, IN 46239
$-231
Cash flow
-2.5%
Cash-on-Cash Return
5.6%
Cap rate
0.7%
Rent to Value Ratio
Active
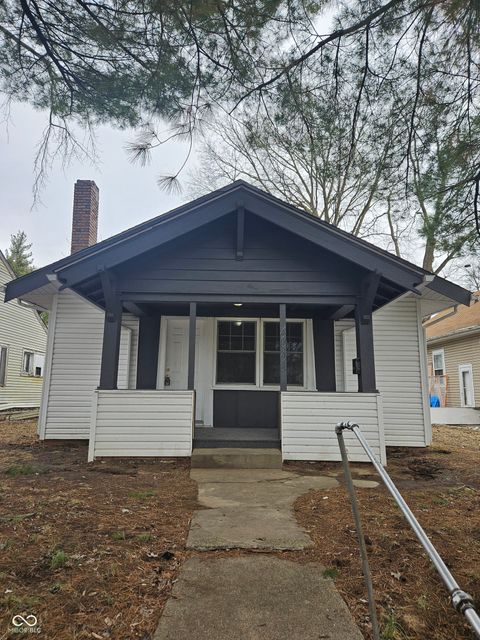
$139,900
3
bds
|
1
ba
|
1,344
sqft
|
built
1920
2134 Pleasant St, Indianapolis, IN 46203
$-27
Cash flow
-1.0%
Cash-on-Cash Return
5.9%
Cap rate
0.7%
Rent to Value Ratio

Active
$299,900
6
bds
|
2
ba
|
2,580
sqft
|
built
1959
8553 Broadway St, Indianapolis, IN 46240
$258
Cash flow
4.5%
Cash-on-Cash Return
7.2%
Cap rate
0.9%
Rent to Value Ratio
Pending
$189,500
4
bds
|
3
ba
|
2,940
sqft
|
built
1932
819 E 49th St, Indianapolis, IN 46205
$271
Cash flow
7.5%
Cash-on-Cash Return
7.9%
Cap rate
0.9%
Rent to Value Ratio

Active
$159,499
3
bds
|
1
ba
|
1,025
sqft
|
built
1900
35 S Catherwood Ave, Indianapolis, IN 46219
$287
Cash flow
9.4%
Cash-on-Cash Return
8.3%
Cap rate
1.0%
Rent to Value Ratio
Active
$160,000
3
bds
|
2
ba
|
1,322
sqft
|
built
1911
3532 E 10th St, Indianapolis, IN 46201
$-61
Cash flow
-2.0%
Cash-on-Cash Return
5.7%
Cap rate
0.7%
Rent to Value Ratio
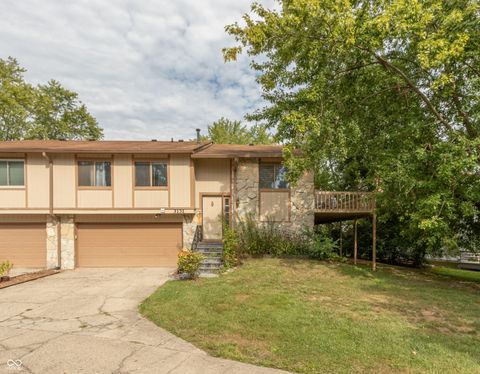
Active
$289,900
3
bds
|
3
ba
|
1,844
sqft
|
built
1996
7530 Redcliff Rd, Indianapolis, IN 46256
$79
Cash flow
1.4%
Cash-on-Cash Return
6.5%
Cap rate
0.8%
Rent to Value Ratio