Indianapolis, IN Investment Properties for Sale
Browse homes for sale and investment properties in Indianapolis, IN. Refine your search by price, property type, or more.
Best cash flowing properties in Indianapolis, IN
Active
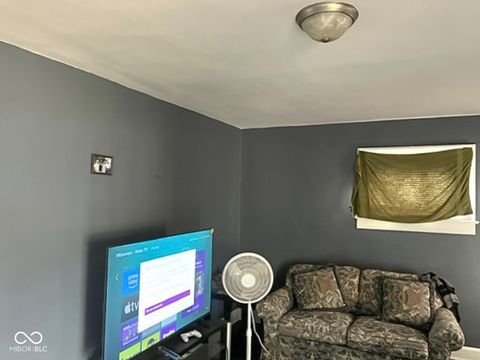
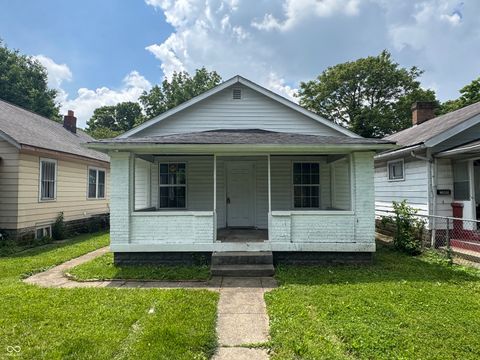
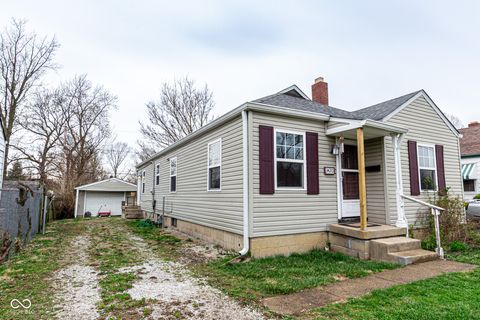
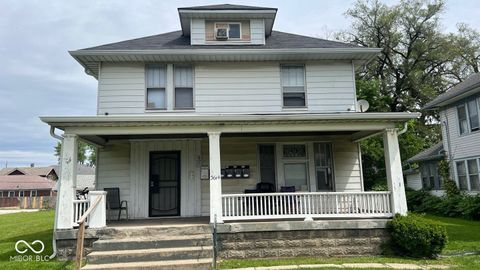
$110,000
2
bds
|
1
ba
|
843
sqft
|
built
1923
801 N Denny St, Indianapolis, IN 46201
$392
Cash flow
18.6%
Cash-on-Cash Return
10.5%
Cap rate
1.3%
Rent to Value Ratio
Active
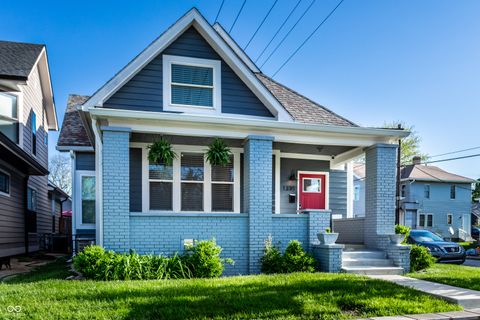
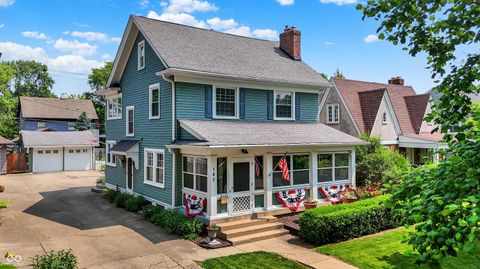
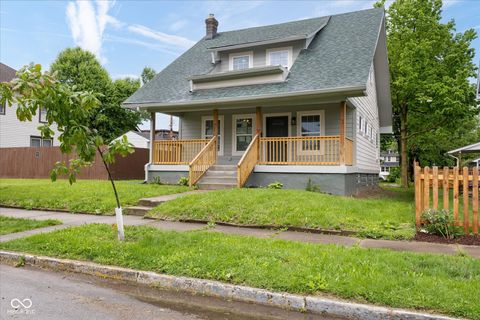
$415,000
3
bds
|
3
ba
|
2,767
sqft
|
built
1910
1330 Marlowe Ave, Indianapolis, IN 46202
$317
Cash flow
4.0%
Cash-on-Cash Return
7.2%
Cap rate
0.9%
Rent to Value Ratio
2,139 out of 2,296 properties for sale in Indianapolis, IN
Limited Results Shown
Create a free account, or log in to reveal all property listings and enjoy the complete experience.

Active
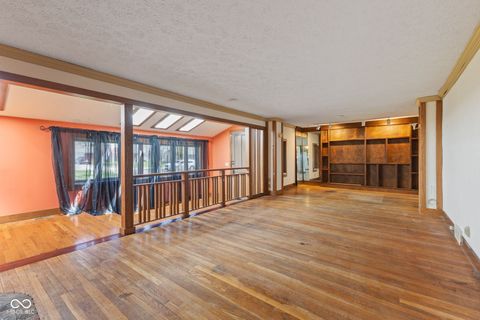
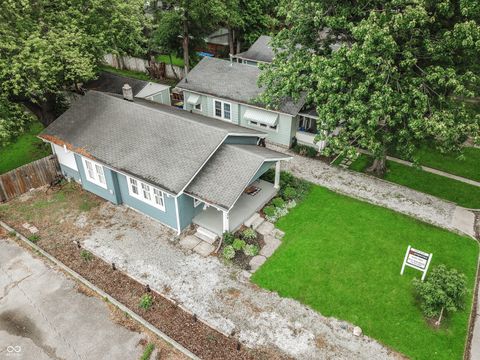
$395,000
4
bds
|
3
ba
|
2,470
sqft
|
built
2021
11034 Saddlebred Dr, Indianapolis, IN 46239
$-390
Cash flow
-5.2%
Cash-on-Cash Return
5.1%
Cap rate
0.6%
Rent to Value Ratio
Active
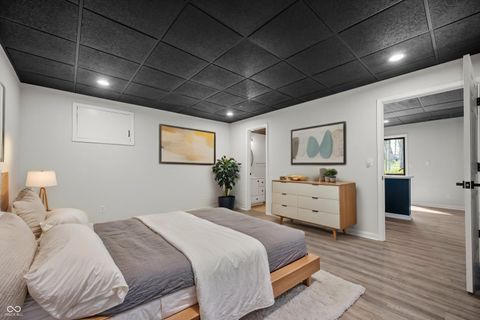
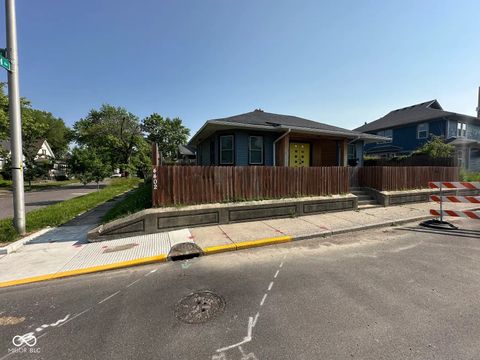
$379,900
3
bds
|
2
ba
|
2,778
sqft
|
built
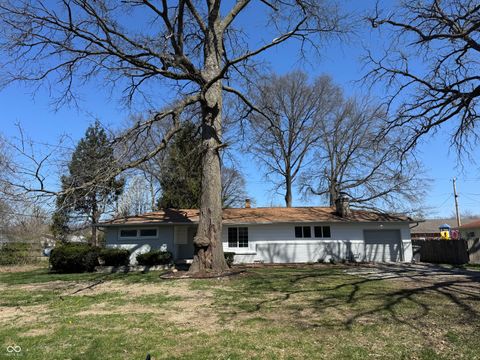
1952
7104 Combs Rd, Indianapolis, IN 46237
$-51
Cash flow
-0.7%
Cash-on-Cash Return
6.1%
Cap rate
0.7%
Rent to Value Ratio

Active
$1,175,000
4
bds
|
4
ba
|
6,316
sqft
|
built
1947
6230 E 56th St, Indianapolis, IN 46226
$-1,684
Cash flow
-7.5%
Cash-on-Cash Return
4.5%
Cap rate
0.6%
Rent to Value Ratio
Active
$625,000
4
bds
|
4
ba
|
3,756
sqft
|
built
1981
9111 Sand Key Ln, Indianapolis, IN 46256
$-1,375
Cash flow
-11.5%
Cash-on-Cash Return
3.6%
Cap rate
0.4%
Rent to Value Ratio
Active
$499,000
4
bds
|
3
ba
|
2,188
sqft
|
built
1930
140 W Hampton Dr, Indianapolis, IN 46208
$-604
Cash flow
-6.3%
Cash-on-Cash Return
4.8%
Cap rate
0.6%
Rent to Value Ratio
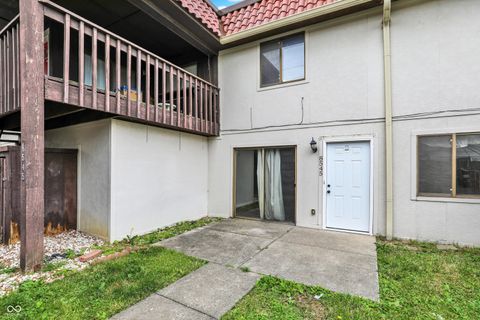
Active
$105,000
2
bds
|
2
ba
|
882
sqft
|
built
1980
8545 La Corrida Ct, Indianapolis, IN 46227
$-76
Cash flow
-3.8%
Cash-on-Cash Return
5.4%
Cap rate
1.0%
Rent to Value Ratio
Active
$110,000
2
bds
|
1
ba
|
843
sqft
|
built
1923
801 N Denny St, Indianapolis, IN 46201
$392
Cash flow
18.6%
Cash-on-Cash Return
10.5%
Cap rate
1.3%
Rent to Value Ratio
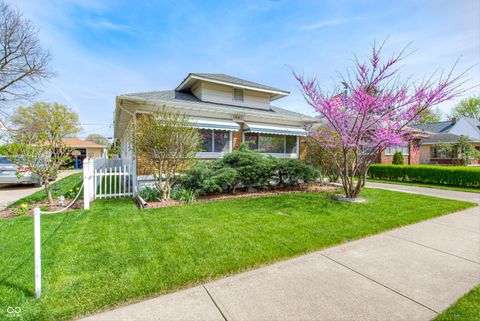
Active
$274,900
2
bds
|
2
ba
|
1,803
sqft
|
built
1935
1641 Winton Ave, Indianapolis, IN 46224
$-55
Cash flow
-1.0%
Cash-on-Cash Return
6.0%
Cap rate
0.7%
Rent to Value Ratio
Active
$129,000
2
bds
|
1
ba
|
672
sqft
|
built
1930
1445 W 34th St, Indianapolis, IN 46208
$86
Cash flow
3.5%
Cash-on-Cash Return
7.1%
Cap rate
0.9%
Rent to Value Ratio

Active
$300,000
4
bds
|
3
ba
|
1,517
sqft
|
built
1999
6368 Titania Dr, Indianapolis, IN 46236
$-324
Cash flow
-5.6%
Cash-on-Cash Return
5.0%
Cap rate
0.6%
Rent to Value Ratio

Active
$225,000
4
bds
|
2
ba
|
1,888
sqft
|
built
1920
518 Central Ct S, Indianapolis, IN 46205
$205
Cash flow
4.8%
Cash-on-Cash Return
7.4%
Cap rate
0.9%
Rent to Value Ratio
Active
$149,999
3
bds
|
1
ba
|
1,176
sqft
|
built
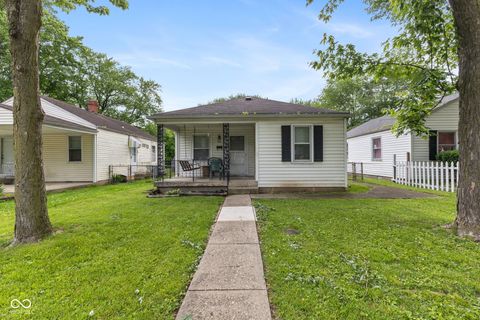
1950
3420 N Chester Ave, Indianapolis, IN 46218
$183
Cash flow
6.4%
Cash-on-Cash Return
7.7%
Cap rate
0.9%
Rent to Value Ratio

Active
$198,999
2
bds
|
1
ba
|
994
sqft
|
built
1925
5841 Julian Ave, Indianapolis, IN 46219
$-73
Cash flow
-1.9%
Cash-on-Cash Return
5.8%
Cap rate
0.7%
Rent to Value Ratio

Active
$144,900
3
bds
|
2
ba
|
1,928
sqft
|
built
1910
1207 W 35th St, Indianapolis, IN 46208
$72
Cash flow
2.6%
Cash-on-Cash Return
6.9%
Cap rate
0.8%
Rent to Value Ratio

Active
$124,900
3
bds
|
1
ba
|
1,624
sqft
|
built
1920
1163 Groff Ave, Indianapolis, IN 46222
$314
Cash flow
13.1%
Cash-on-Cash Return
9.3%
Cap rate
1.1%
Rent to Value Ratio

Active
$277,500
3
bds
|
3
ba
|
1,970
sqft
|
built
1984
8072 Foxchase Dr, Indianapolis, IN 46256
$-39
Cash flow
-0.7%
Cash-on-Cash Return
6.1%
Cap rate
0.9%
Rent to Value Ratio

Active
$215,000
2
bds
|
1
ba
|
1,294
sqft
|
built
1963
2832 Hillside Ave, Indianapolis, IN 46218
$-156
Cash flow
-3.8%
Cash-on-Cash Return
5.4%
Cap rate
0.7%
Rent to Value Ratio
Active
$294,999
3
bds
|
3
ba
|
1,429
sqft
|
built
1925
3216 N Kenwood Ave, Indianapolis, IN 46208
$-574
Cash flow
-10.2%
Cash-on-Cash Return
3.9%
Cap rate
0.5%
Rent to Value Ratio

Active
$375,000
2
bds
|
3
ba
|
1,554
sqft
|
built
1991
3260 Eddy Ct, Indianapolis, IN 46214
$-619
Cash flow
-8.6%
Cash-on-Cash Return
4.3%
Cap rate
0.5%
Rent to Value Ratio

Active
$634,000
3
bds
|
3
ba
|
1,589
sqft
|
built
1945
6185 Evanston Ave, Indianapolis, IN 46220
$-826
Cash flow
-6.8%
Cash-on-Cash Return
4.7%
Cap rate
0.6%
Rent to Value Ratio
Active
$245,000
2
bds
|
1
ba
|
826
sqft
|
built
1925
4926 Crittenden Ave, Indianapolis, IN 46205
$101
Cash flow
2.2%
Cash-on-Cash Return
6.8%
Cap rate
0.8%
Rent to Value Ratio
Active
$159,900
3
bds
|
1
ba
|
1,032
sqft
|
built
1920
4402 E New York St, Indianapolis, IN 46201
$131
Cash flow
4.3%
Cash-on-Cash Return
7.2%
Cap rate
0.9%
Rent to Value Ratio

Active
$299,900
4
bds
|
3
ba
|
1,924
sqft
|
built
2019
6540 Mc Creery Ct, Indianapolis, IN 46221
$-294
Cash flow
-5.1%
Cash-on-Cash Return
5.1%
Cap rate
0.6%
Rent to Value Ratio

Active
$344,900
3
bds
|
2
ba
|
2,940
sqft
|
built
2022
2428 N Gale St, Indianapolis, IN 46218
$-559
Cash flow
-8.5%
Cash-on-Cash Return
4.3%
Cap rate
0.5%
Rent to Value Ratio

Active
$150,000
3
bds
|
1
ba
|
855
sqft
|
built
1920
1845 W Wilkins St, Indianapolis, IN 46221
$183
Cash flow
6.4%
Cash-on-Cash Return
7.7%
Cap rate
0.9%
Rent to Value Ratio

Active
$158,900
2
bds
|
1
ba
|
1,005
sqft
|
built
1930
117 W 36th St, Indianapolis, IN 46208
$136
Cash flow
4.5%
Cash-on-Cash Return
7.3%
Cap rate
0.9%
Rent to Value Ratio

Active
$264,500
4
bds
|
2
ba
|
1,628
sqft
|
built
1968
1543 W 79th St, Indianapolis, IN 46260
$-1
Cash flow
0.0%
Cash-on-Cash Return
6.3%
Cap rate
0.8%
Rent to Value Ratio
Active
$340,000
4
bds
|
0
ba
|
0
sqft
|
built
1925
3614 E Washington St, Indianapolis, IN 46201
$-1,085
Cash flow
-16.6%
Cash-on-Cash Return
2.4%
Cap rate
0.3%
Rent to Value Ratio

Active
$325,000
3
bds
|
2
ba
|
1,921
sqft
|
built
1984
4428 Edinburgh Pt, Indianapolis, IN 46228
$-890
Cash flow
-14.3%
Cash-on-Cash Return
3.0%
Cap rate
0.7%
Rent to Value Ratio

Active
$925,000
4
bds
|
4
ba
|
4,176
sqft
|
built
1910
2828 N Illinois St, Indianapolis, IN 46208
$-3,587
Cash flow
-20.2%
Cash-on-Cash Return
1.6%
Cap rate
0.2%
Rent to Value Ratio
Active
$250,000
3
bds
|
2
ba
|
1,524
sqft
|
built
1955
7406 E 33rd St, Indianapolis, IN 46226
$-339
Cash flow
-7.1%
Cash-on-Cash Return
4.6%
Cap rate
0.6%
Rent to Value Ratio

Active
$725,000
5
bds
|
5
ba
|
5,022
sqft
|
built
1988
10350 Courageous Dr, Indianapolis, IN 46236
$-448
Cash flow
-3.2%
Cash-on-Cash Return
5.5%
Cap rate
0.7%
Rent to Value Ratio

Active
$85,000
3
bds
|
1
ba
|
1,056
sqft
|
built
1926
2134 Dr Andrew J Brown Ave, Indianapolis, IN 46202
$315
Cash flow
19.3%
Cash-on-Cash Return
10.7%
Cap rate
1.3%
Rent to Value Ratio
Active
$144,000
2
bds
|
1
ba
|
832
sqft
|
built
1947
1722 Dawson St, Indianapolis, IN 46203
$76
Cash flow
2.8%
Cash-on-Cash Return
6.9%
Cap rate
0.8%
Rent to Value Ratio
Active
$155,000
2
bds
|
1
ba
|
624
sqft
|
built
1952
1116 N Berwick Ave, Indianapolis, IN 46222
$88
Cash flow
3.0%
Cash-on-Cash Return
6.9%
Cap rate
0.8%
Rent to Value Ratio

Active
$499,900
2
bds
|
3
ba
|
1,947
sqft
|
built
2012
946 Stillwell St, Indianapolis, IN 46202
$-195
Cash flow
-2.0%
Cash-on-Cash Return
5.8%
Cap rate
0.7%
Rent to Value Ratio

Active
$615,000
3
bds
|
4
ba
|
2,374
sqft
|
built
2023
711 E 16th St, Indianapolis, IN 46202
$-902
Cash flow
-7.7%
Cash-on-Cash Return
4.5%
Cap rate
0.6%
Rent to Value Ratio
Active
$210,000
2
bds
|
1
ba
|
1,462
sqft
|
built
1930
1924 E Maryland St, Indianapolis, IN 46201
$-268
Cash flow
-6.7%
Cash-on-Cash Return
4.7%
Cap rate
0.6%
Rent to Value Ratio
Active
$415,000
3
bds
|
3
ba
|
2,767
sqft
|
built
1910
1330 Marlowe Ave, Indianapolis, IN 46202
$317
Cash flow
4.0%
Cash-on-Cash Return
7.2%
Cap rate
0.9%
Rent to Value Ratio
Active
$125,000
3
bds
|
1
ba
|
1,008
sqft
|
built
1967
2194 N Riley Ave, Indianapolis, IN 46218
$244
Cash flow
10.2%
Cash-on-Cash Return
8.6%
Cap rate
1.0%
Rent to Value Ratio