Indianapolis, IN Investment Properties for Sale
Browse homes for sale and investment properties in Indianapolis, IN. Refine your search by price, property type, or more.
Best cash flowing properties in Indianapolis, IN

Active
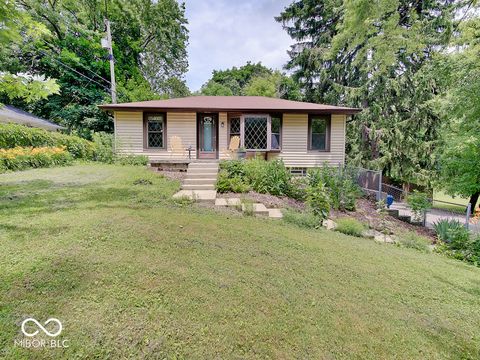
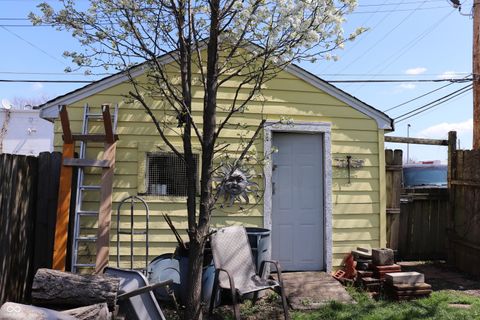
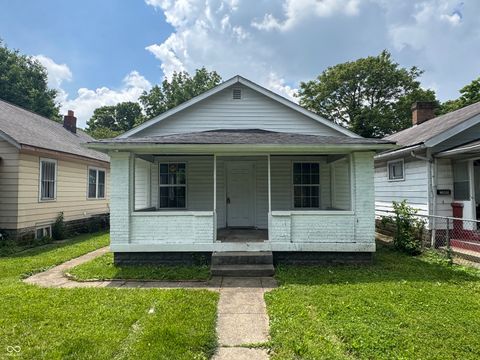
$115,000
2
bds
|
2
ba
|
610
sqft
|
built
1935
1623 N Centennial St, Indianapolis, IN 46222
$366
Cash flow
16.6%
Cash-on-Cash Return
10.1%
Cap rate
1.2%
Rent to Value Ratio
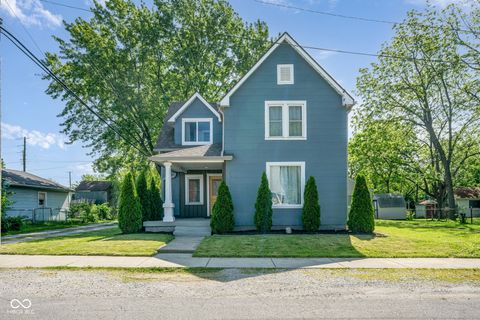
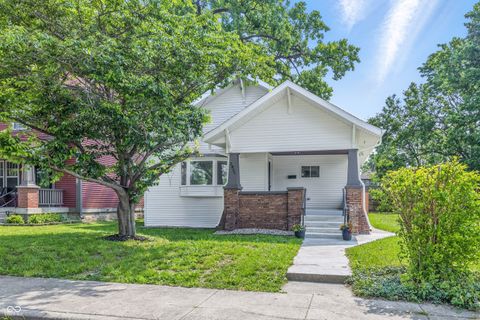
Active
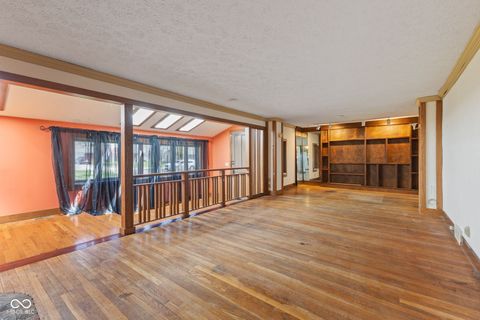
$165,000
2
bds
|
1
ba
|
828
sqft
|
built
1950
1908 W Northgate St, Indianapolis, IN 46228
$328
Cash flow
10.4%
Cash-on-Cash Return
8.5%
Cap rate
1.0%
Rent to Value Ratio
2,136 out of 2,292 properties for sale in Indianapolis, IN
Limited Results Shown
Create a free account, or log in to reveal all property listings and enjoy the complete experience.
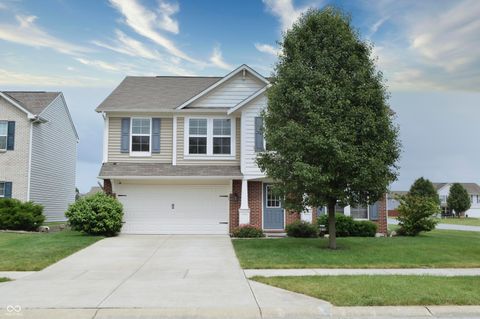
Active
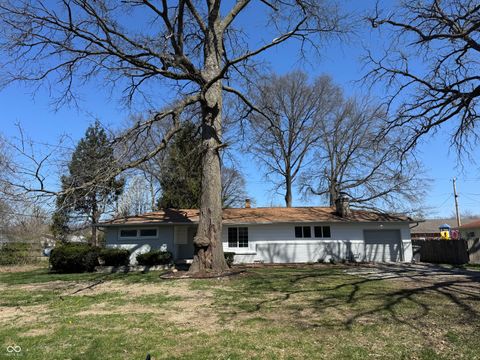
$320,000
3
bds
|
3
ba
|
1,992
sqft
|
built
1915
2215 S Delaware St, Indianapolis, IN 46225
$-84
Cash flow
-1.4%
Cash-on-Cash Return
6.0%
Cap rate
0.7%
Rent to Value Ratio
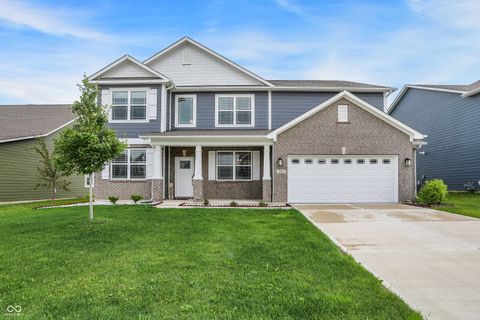
Active
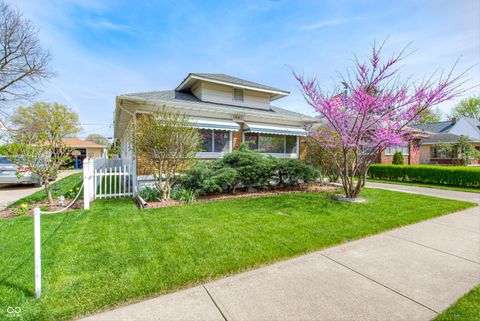
$295,000
4
bds
|
2
ba
|
1,796
sqft
|
built
1923
405 N Drexel Ave, Indianapolis, IN 46201
$-160
Cash flow
-2.8%
Cash-on-Cash Return
5.6%
Cap rate
0.7%
Rent to Value Ratio

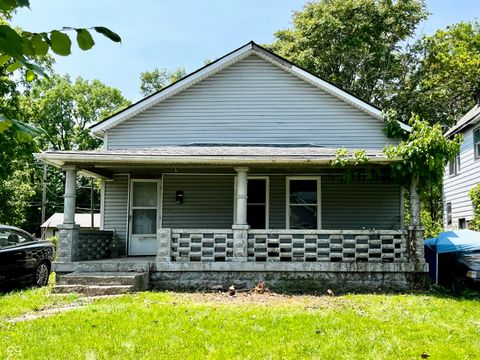
Active
$170,000
3
bds
|
1
ba
|
1,934
sqft
|
built
1955
1121 Eugene St, Indianapolis, IN 46208
$78
Cash flow
2.4%
Cash-on-Cash Return
6.8%
Cap rate
0.8%
Rent to Value Ratio
Active
$169,900
2
bds
|
1
ba
|
885
sqft
|
built
1923
1619 E Bradbury Ave, Indianapolis, IN 46203
$10
Cash flow
0.3%
Cash-on-Cash Return
6.3%
Cap rate
0.8%
Rent to Value Ratio
Active
$115,000
2
bds
|
2
ba
|
610
sqft
|
built
1935
1623 N Centennial St, Indianapolis, IN 46222
$366
Cash flow
16.6%
Cash-on-Cash Return
10.1%
Cap rate
1.2%
Rent to Value Ratio
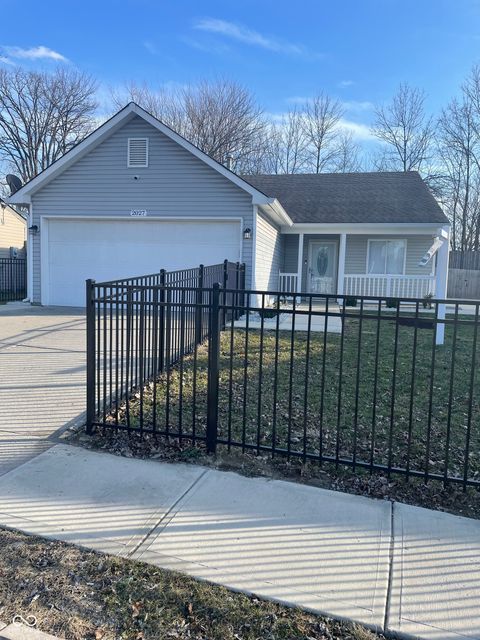
Active
$265,000
4
bds
|
3
ba
|
1,980
sqft
|
built
2002
411 Red Tail Ln, Indianapolis, IN 46241
$-160
Cash flow
-3.2%
Cash-on-Cash Return
5.5%
Cap rate
0.7%
Rent to Value Ratio
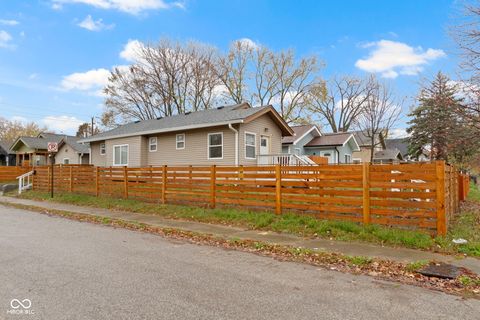
Active
$190,000
3
bds
|
2
ba
|
1,063
sqft
|
built
1926
802 N Tuxedo St, Indianapolis, IN 46201
$112
Cash flow
3.1%
Cash-on-Cash Return
7.0%
Cap rate
0.8%
Rent to Value Ratio

Active
$260,000
3
bds
|
2
ba
|
1,232
sqft
|
built
1990
9134 Jene Ct, Indianapolis, IN 46234
$-124
Cash flow
-2.5%
Cash-on-Cash Return
5.7%
Cap rate
0.7%
Rent to Value Ratio

Active
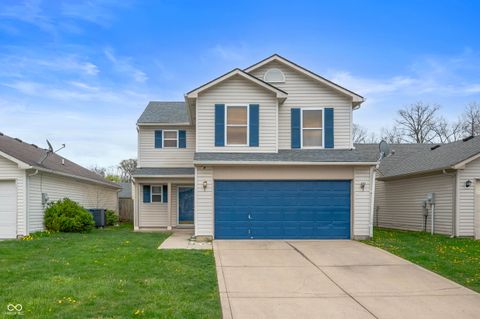
$469,000
3
bds
|
2
ba
|
1,890
sqft
|
built
2019
6611 Ventnor Pl, Indianapolis, IN 46217
$-759
Cash flow
-8.4%
Cash-on-Cash Return
4.3%
Cap rate
0.5%
Rent to Value Ratio

Active
$344,900
3
bds
|
2
ba
|
2,940
sqft
|
built
2022
2428 N Gale St, Indianapolis, IN 46218
$-559
Cash flow
-8.5%
Cash-on-Cash Return
4.3%
Cap rate
0.5%
Rent to Value Ratio

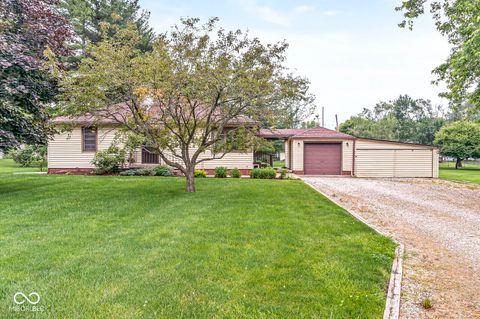
Active
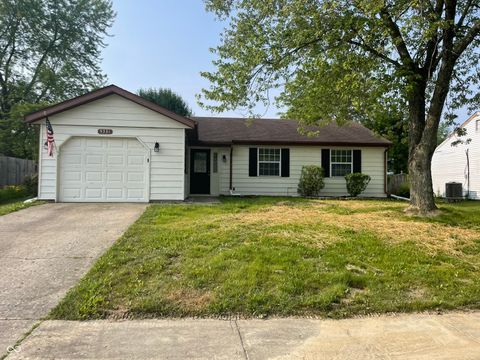
$150,000
3
bds
|
1
ba
|
855
sqft
|
built
1920
1845 W Wilkins St, Indianapolis, IN 46221
$183
Cash flow
6.4%
Cash-on-Cash Return
7.7%
Cap rate
0.9%
Rent to Value Ratio

Active
$158,900
2
bds
|
1
ba
|
1,005
sqft
|
built
1930
117 W 36th St, Indianapolis, IN 46208
$136
Cash flow
4.5%
Cash-on-Cash Return
7.3%
Cap rate
0.9%
Rent to Value Ratio

Active
$244,900
3
bds
|
0
ba
|
0
sqft
|
built
1920
418 N Oakland Ave, Indianapolis, IN 46201
$-520
Cash flow
-11.1%
Cash-on-Cash Return
3.7%
Cap rate
0.4%
Rent to Value Ratio

Active
$169,900
3
bds
|
2
ba
|
1,625
sqft
|
built
1920
322 S Rural St, Indianapolis, IN 46201
$-59
Cash flow
-1.8%
Cash-on-Cash Return
5.8%
Cap rate
0.7%
Rent to Value Ratio

Active
$295,900
4
bds
|
3
ba
|
2,666
sqft
|
built
1962
5549 Hollister Dr, Indianapolis, IN 46224
$-165
Cash flow
-2.9%
Cash-on-Cash Return
5.6%
Cap rate
0.7%
Rent to Value Ratio

Active
$330,000
4
bds
|
3
ba
|
1,944
sqft
|
built
1973
1102 Fox Hill Dr, Indianapolis, IN 46228
$-136
Cash flow
-2.2%
Cash-on-Cash Return
5.8%
Cap rate
0.7%
Rent to Value Ratio

Active
$199,900
3
bds
|
3
ba
|
1,721
sqft
|
built
2005
7218 Forrester Ln, Indianapolis, IN 46217
$-131
Cash flow
-3.4%
Cash-on-Cash Return
5.5%
Cap rate
0.9%
Rent to Value Ratio
Active
$245,000
3
bds
|
2
ba
|
1,084
sqft
|
built
1999
2027 E Werges Ave, Indianapolis, IN 46237
$-313
Cash flow
-6.7%
Cash-on-Cash Return
4.7%
Cap rate
0.6%
Rent to Value Ratio
Active
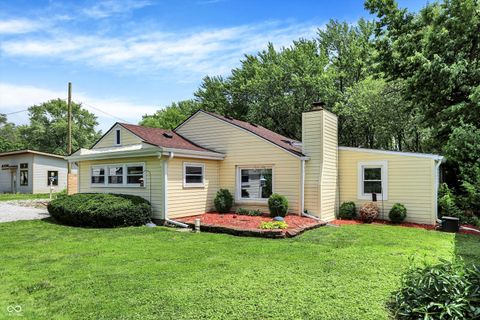
$109,000
2
bds
|
1
ba
|
1,383
sqft
|
built
1955
2826 Station St, Indianapolis, IN 46218
$328
Cash flow
15.7%
Cash-on-Cash Return
9.9%
Cap rate
1.2%
Rent to Value Ratio

Active
$175,000
2
bds
|
2
ba
|
1,180
sqft
|
built
1980
8980 Cinnebar Dr, Indianapolis, IN 46268
$-104
Cash flow
-3.1%
Cash-on-Cash Return
5.6%
Cap rate
0.9%
Rent to Value Ratio
Active
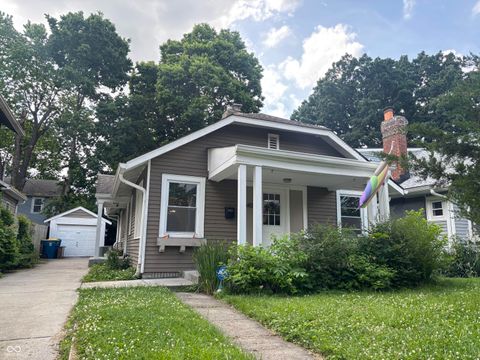
$149,900
2
bds
|
1
ba
|
916
sqft
|
built
1905
2025 Barth Ave, Indianapolis, IN 46203
$183
Cash flow
6.4%
Cash-on-Cash Return
7.7%
Cap rate
0.9%
Rent to Value Ratio

Active
$395,000
4
bds
|
3
ba
|
2,470
sqft
|
built
2021
11034 Saddlebred Dr, Indianapolis, IN 46239
$-390
Cash flow
-5.2%
Cash-on-Cash Return
5.1%
Cap rate
0.6%
Rent to Value Ratio
Active
$379,900
3
bds
|
2
ba
|
2,778
sqft
|
built
1952
7104 Combs Rd, Indianapolis, IN 46237
$-51
Cash flow
-0.7%
Cash-on-Cash Return
6.1%
Cap rate
0.7%
Rent to Value Ratio

Active
$1,175,000
4
bds
|
4
ba
|
6,316
sqft
|
built
1947
6230 E 56th St, Indianapolis, IN 46226
$-1,684
Cash flow
-7.5%
Cash-on-Cash Return
4.5%
Cap rate
0.6%
Rent to Value Ratio

Active
$925,000
4
bds
|
4
ba
|
4,176
sqft
|
built
1910
2828 N Illinois St, Indianapolis, IN 46208
$-3,587
Cash flow
-20.2%
Cash-on-Cash Return
1.6%
Cap rate
0.2%
Rent to Value Ratio
Active
$250,000
3
bds
|
2
ba
|
1,524
sqft
|
built
1955
7406 E 33rd St, Indianapolis, IN 46226
$-339
Cash flow
-7.1%
Cash-on-Cash Return
4.6%
Cap rate
0.6%
Rent to Value Ratio

Active
$725,000
5
bds
|
5
ba
|
5,022
sqft
|
built
1988
10350 Courageous Dr, Indianapolis, IN 46236
$-448
Cash flow
-3.2%
Cash-on-Cash Return
5.5%
Cap rate
0.7%
Rent to Value Ratio
Active
$274,900
2
bds
|
2
ba
|
1,803
sqft
|
built
1935
1641 Winton Ave, Indianapolis, IN 46224
$-55
Cash flow
-1.0%
Cash-on-Cash Return
6.0%
Cap rate
0.7%
Rent to Value Ratio
Active
$129,000
2
bds
|
1
ba
|
672
sqft
|
built
1930
1445 W 34th St, Indianapolis, IN 46208
$86
Cash flow
3.5%
Cash-on-Cash Return
7.1%
Cap rate
0.9%
Rent to Value Ratio

Active
$300,000
4
bds
|
3
ba
|
1,517
sqft
|
built
1999
6368 Titania Dr, Indianapolis, IN 46236
$-324
Cash flow
-5.6%
Cash-on-Cash Return
5.0%
Cap rate
0.6%
Rent to Value Ratio

Active
$349,400
2
bds
|
2
ba
|
1,240
sqft
|
built
1910
430 N Park Ave, Indianapolis, IN 46202
$-755
Cash flow
-11.3%
Cash-on-Cash Return
3.7%
Cap rate
0.7%
Rent to Value Ratio
Active
$325,000
3
bds
|
2
ba
|
1,710
sqft
|
built
1948
2831 N Talbott St, Indianapolis, IN 46205
$-731
Cash flow
-11.7%
Cash-on-Cash Return
3.6%
Cap rate
0.4%
Rent to Value Ratio
Active
$327,900
4
bds
|
3
ba
|
2,821
sqft
|
built
2017
2615 Pumpkin Patch Ln, Indianapolis, IN 46229
$-127
Cash flow
-2.0%
Cash-on-Cash Return
5.7%
Cap rate
0.7%
Rent to Value Ratio
Active
$479,900
5
bds
|
3
ba
|
3,475
sqft
|
built
2022
5812 Flat Hill Dr, Indianapolis, IN 46239
$-250
Cash flow
-2.7%
Cash-on-Cash Return
5.5%
Cap rate
0.7%
Rent to Value Ratio
Active
$259,900
3
bds
|
2
ba
|
1,200
sqft
|
built
1951
4010 S Bazil Ave, Indianapolis, IN 46239
$-227
Cash flow
-4.6%
Cash-on-Cash Return
5.1%
Cap rate
0.6%
Rent to Value Ratio
Active
$265,000
3
bds
|
1
ba
|
1,139
sqft
|
built
1920
4406 Carrollton Ave, Indianapolis, IN 46205
$23
Cash flow
0.5%
Cash-on-Cash Return
6.2%
Cap rate
0.8%
Rent to Value Ratio
Active
$349,000
4
bds
|
2
ba
|
2,075
sqft
|
built
1946
8019 E Hanna Ave, Indianapolis, IN 46239
$-546
Cash flow
-8.2%
Cash-on-Cash Return
4.3%
Cap rate
0.5%
Rent to Value Ratio
Active
$225,000
3
bds
|
2
ba
|
1,060
sqft
|
built
1981
5331 Yucatan Dr, Indianapolis, IN 46237
$-49
Cash flow
-1.1%
Cash-on-Cash Return
5.9%
Cap rate
0.7%
Rent to Value Ratio
Active
$165,000
2
bds
|
1
ba
|
828
sqft
|
built
1950
1908 W Northgate St, Indianapolis, IN 46228
$328
Cash flow
10.4%
Cash-on-Cash Return
8.5%
Cap rate
1.0%
Rent to Value Ratio
Active
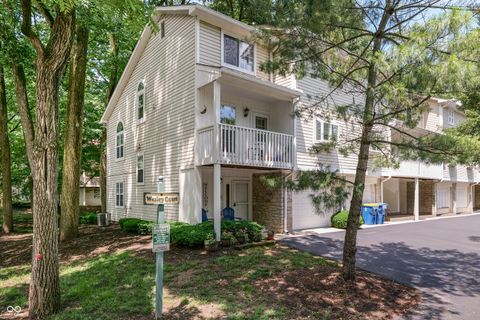
$300,000
3
bds
|
4
ba
|
1,886
sqft
|
built
1995
6920 Wesley Ct, Indianapolis, IN 46220
$-434
Cash flow
-7.5%
Cash-on-Cash Return
4.4%
Cap rate
0.7%
Rent to Value Ratio