Indianapolis, IN Investment Properties for Sale
Browse homes for sale and investment properties in Indianapolis, IN. Refine your search by price, property type, or more.
Best cash flowing properties in Indianapolis, IN

Active
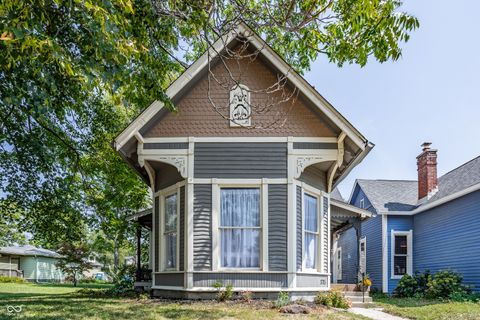
$62,000
1
bds
|
1
ba
|
624
sqft
|
built
1920
114 S Catherwood Ave, Indianapolis, IN 46219
$759
Cash flow
14.3%
Cash-on-Cash Return
14.7%
Cap rate
1.8%
Rent to Value Ratio

Active
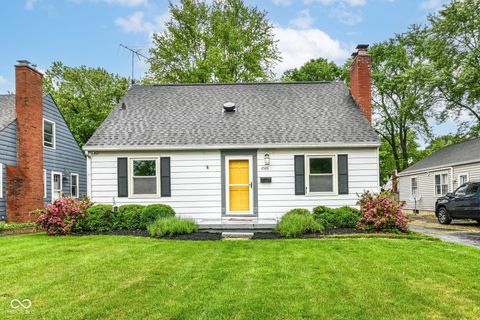
$94,900
2
bds
|
1
ba
|
1,260
sqft
|
built
1947
3101 N Temple Ave, Indianapolis, IN 46218
$402
Cash flow
22.1%
Cash-on-Cash Return
11.3%
Cap rate
1.4%
Rent to Value Ratio
2,136 out of 2,292 properties for sale in Indianapolis, IN
Limited Results Shown
Create a free account, or log in to reveal all property listings and enjoy the complete experience.
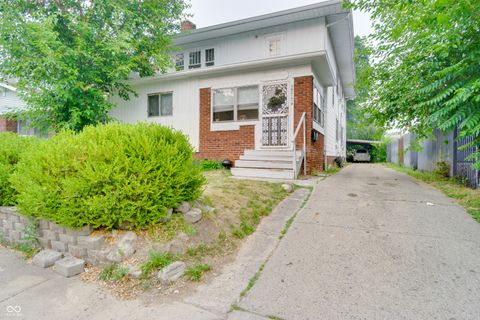
Active
$239,900
4
bds
|
2
ba
|
3,270
sqft
|
built
1941
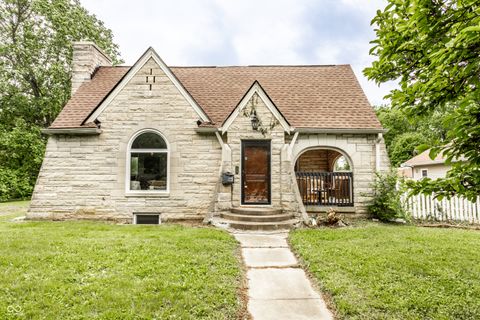
4435 E 38th St, Indianapolis, IN 46218
$151
Cash flow
3.3%
Cash-on-Cash Return
6.9%
Cap rate
0.8%
Rent to Value Ratio
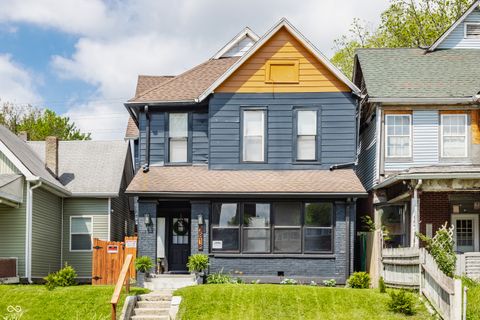
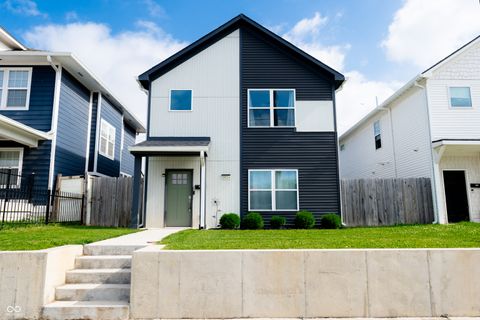
Active
$329,900
4
bds
|
2
ba
|
1,831
sqft
|
built
2000
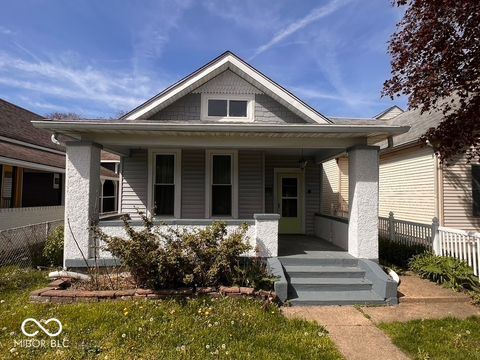
1140 Hoyt Ave, Indianapolis, IN 46203
$242
Cash flow
3.8%
Cash-on-Cash Return
7.0%
Cap rate
0.8%
Rent to Value Ratio
Active
$298,000
6
bds
|
4
ba
|
3,334
sqft
|
built
2002
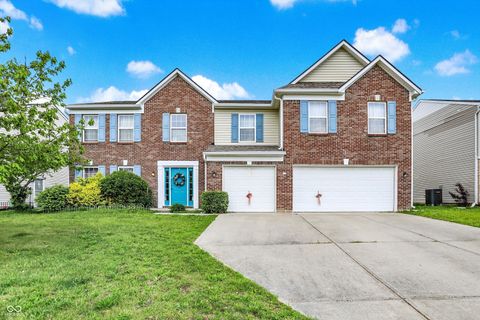
10828 Young Lake Dr, Indianapolis, IN 46229
$172
Cash flow
3.0%
Cash-on-Cash Return
6.8%
Cap rate
0.8%
Rent to Value Ratio

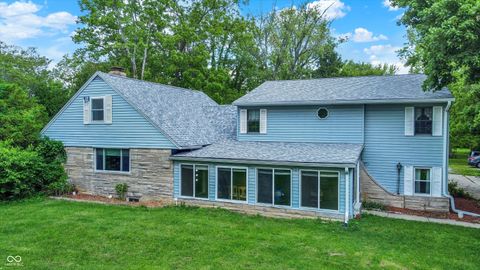
Active
$400,000
4
bds
|
3
ba
|
4,120
sqft
|
built
1991
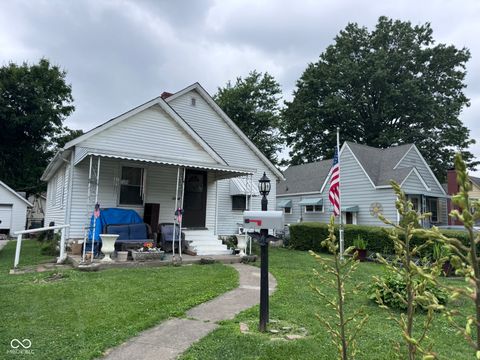
7720 Langwood Dr, Indianapolis, IN 46268
$-337
Cash flow
-4.4%
Cash-on-Cash Return
5.1%
Cap rate
0.6%
Rent to Value Ratio
Active
$185,000
3
bds
|
1
ba
|
1,347
sqft
|
built
1940
1768 N Lynhurst Dr, Indianapolis, IN 46224
$87
Cash flow
2.5%
Cash-on-Cash Return
6.7%
Cap rate
0.8%
Rent to Value Ratio
Active
$625,000
4
bds
|
4
ba
|
2,558
sqft
|
built
1920
1207 Pickwick Pl, Indianapolis, IN 46208
$-812
Cash flow
-6.8%
Cash-on-Cash Return
4.6%
Cap rate
0.6%
Rent to Value Ratio
Active
$169,900
2
bds
|
2
ba
|
1,159
sqft
|
built
2005
5019 Amber Creek Pl, Indianapolis, IN 46237
$-115
Cash flow
-3.5%
Cash-on-Cash Return
5.3%
Cap rate
0.8%
Rent to Value Ratio
Active
$279,900
3
bds
|
2
ba
|
2,263
sqft
|
built
1953
3147 Bonham Dr, Indianapolis, IN 46222
$-357
Cash flow
-6.7%
Cash-on-Cash Return
4.7%
Cap rate
0.6%
Rent to Value Ratio
Active
$399,900
4
bds
|
3
ba
|
2,975
sqft
|
built
1994
6465 Robinsrock Dr, Indianapolis, IN 46268
$-416
Cash flow
-5.4%
Cash-on-Cash Return
5.0%
Cap rate
0.6%
Rent to Value Ratio
Active
$229,900
3
bds
|
3
ba
|
1,455
sqft
|
built
1989
9477 Aberdare Dr, Indianapolis, IN 46250
$-221
Cash flow
-5.0%
Cash-on-Cash Return
5.0%
Cap rate
0.8%
Rent to Value Ratio
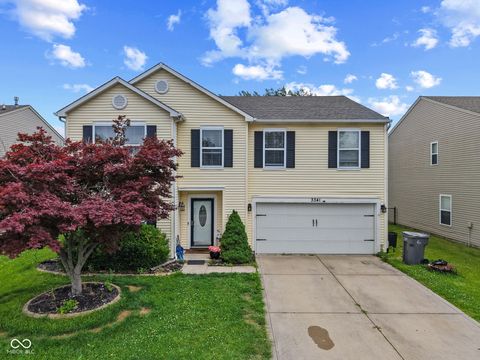
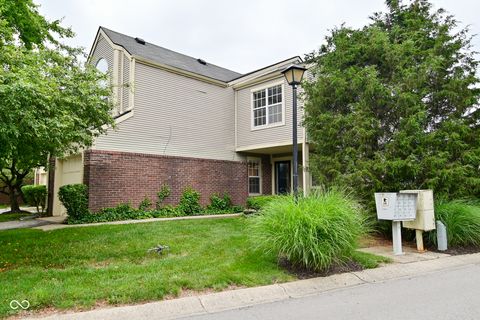
Active
$310,000
3
bds
|
3
ba
|
2,630
sqft
|
built
2000
3341 Carica Dr, Indianapolis, IN 46203
$-108
Cash flow
-1.8%
Cash-on-Cash Return
5.7%
Cap rate
0.7%
Rent to Value Ratio

Active
$375,000
4
bds
|
3
ba
|
2,980
sqft
|
built
2020
5303 Rum Cherry Way, Indianapolis, IN 46237
$-205
Cash flow
-2.9%
Cash-on-Cash Return
5.6%
Cap rate
0.7%
Rent to Value Ratio
Active
$62,000
1
bds
|
1
ba
|
624
sqft
|
built
1920
114 S Catherwood Ave, Indianapolis, IN 46219
$759
Cash flow
14.3%
Cash-on-Cash Return
14.7%
Cap rate
1.8%
Rent to Value Ratio

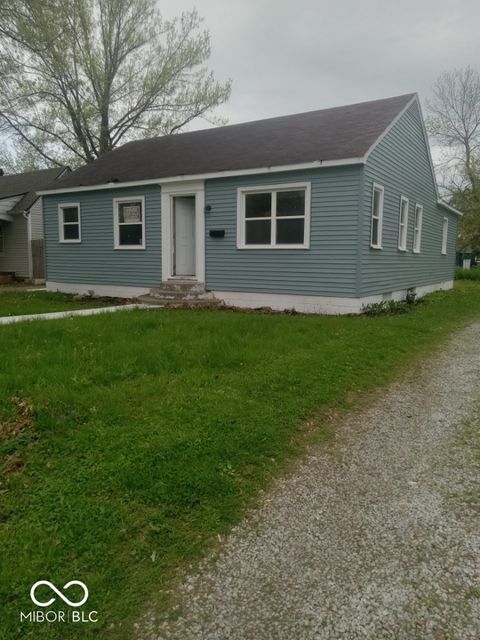
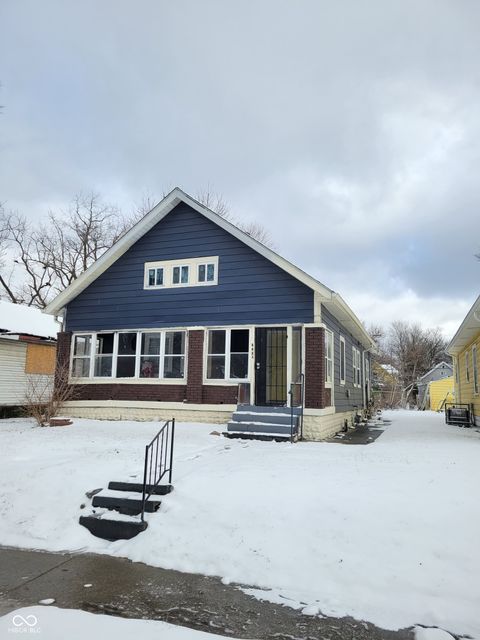
Active
$145,000
3
bds
|
1
ba
|
1,104
sqft
|
built
1970
533 Lynn St, Indianapolis, IN 46222
$140
Cash flow
5.0%
Cash-on-Cash Return
7.4%
Cap rate
0.9%
Rent to Value Ratio

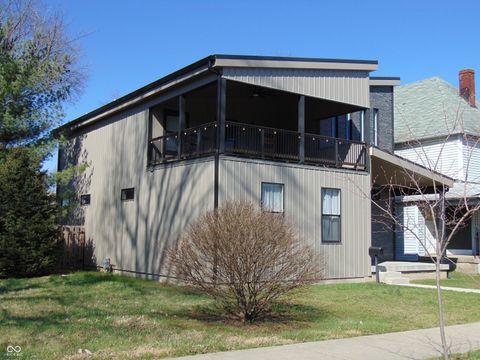
Active
$195,000
3
bds
|
2
ba
|
1,154
sqft
|
built
1910
728 E Beecher St, Indianapolis, IN 46203
$-328
Cash flow
-8.8%
Cash-on-Cash Return
4.2%
Cap rate
0.5%
Rent to Value Ratio
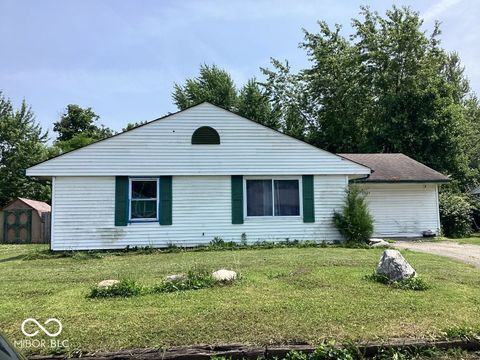
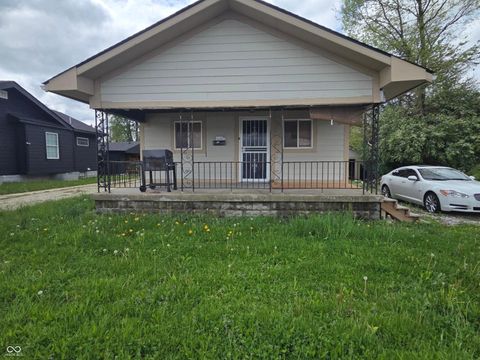
Active
$145,000
4
bds
|
1
ba
|
1,467
sqft
|
built
1963
9925 Catalina Dr, Indianapolis, IN 46235
$209
Cash flow
7.5%
Cash-on-Cash Return
8.0%
Cap rate
1.0%
Rent to Value Ratio
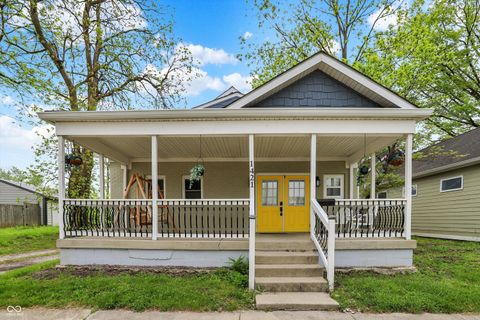
Active
$385,000
3
bds
|
3
ba
|
1,690
sqft
|
built
1885
1421 Laurel St, Indianapolis, IN 46203
$-906
Cash flow
-12.3%
Cash-on-Cash Return
3.4%
Cap rate
0.4%
Rent to Value Ratio

Active
$160,000
0
bds
|
0
ba
|
0
sqft
|
built
1928
1105 N Parker Ave, Indianapolis, IN 46201
$-490
Cash flow
-16.0%
Cash-on-Cash Return
2.6%
Cap rate
0.3%
Rent to Value Ratio
Active
$209,900
2
bds
|
2
ba
|
1,326
sqft
|
built
1890
12003 Broadway St, Indianapolis, IN 46236
$-199
Cash flow
-4.9%
Cash-on-Cash Return
5.1%
Cap rate
0.6%
Rent to Value Ratio

Active
$190,000
3
bds
|
2
ba
|
1,152
sqft
|
built
1971
3026 Stuart St, Indianapolis, IN 46218
$-233
Cash flow
-6.4%
Cash-on-Cash Return
4.8%
Cap rate
0.6%
Rent to Value Ratio

Active
$250,000
4
bds
|
2
ba
|
1,957
sqft
|
built
1922
3134 N College Ave, Indianapolis, IN 46205
$-63
Cash flow
-1.3%
Cash-on-Cash Return
6.0%
Cap rate
0.7%
Rent to Value Ratio
Active
$670,000
3
bds
|
4
ba
|
3,149
sqft
|
built
1999
626 N Senate Ave, Indianapolis, IN 46202
$-1,621
Cash flow
-12.6%
Cash-on-Cash Return
3.4%
Cap rate
0.5%
Rent to Value Ratio
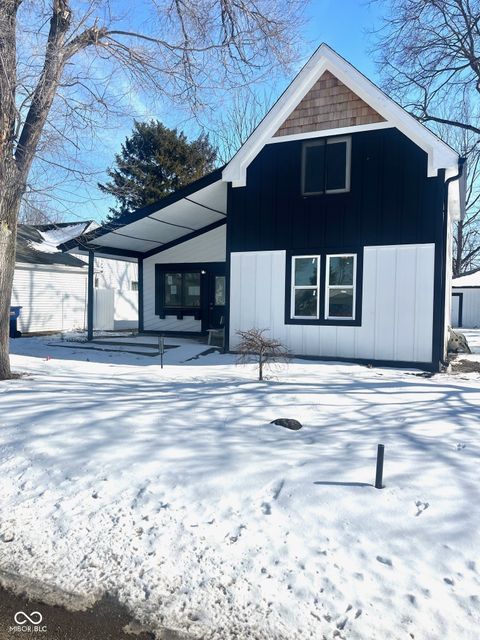
Active
$300,000
3
bds
|
1
ba
|
1,040
sqft
|
built
1947
5636 Crittenden Ave, Indianapolis, IN 46220
$-324
Cash flow
-5.6%
Cash-on-Cash Return
5.0%
Cap rate
0.6%
Rent to Value Ratio
Active
$485,000
4
bds
|
0
ba
|
0
sqft
|
built
1910
15 W 28th St, Indianapolis, IN 46208
$-1,566
Cash flow
-16.8%
Cash-on-Cash Return
2.4%
Cap rate
0.3%
Rent to Value Ratio

Active
$469,900
3
bds
|
0
ba
|
0
sqft
|
built
1910
2519 N College Ave, Indianapolis, IN 46205
$-1,349
Cash flow
-15.0%
Cash-on-Cash Return
2.8%
Cap rate
0.3%
Rent to Value Ratio
Active
$219,000
3
bds
|
0
ba
|
0
sqft
|
built
1925
3619 Salem St, Indianapolis, IN 46208
$-315
Cash flow
-7.5%
Cash-on-Cash Return
4.5%
Cap rate
0.5%
Rent to Value Ratio
Active
$94,900
2
bds
|
1
ba
|
1,260
sqft
|
built
1947
3101 N Temple Ave, Indianapolis, IN 46218
$402
Cash flow
22.1%
Cash-on-Cash Return
11.3%
Cap rate
1.4%
Rent to Value Ratio
Active
$750,000
0
bds
|
0
ba
|
0
sqft
|
built
1900
2818 N Capitol Ave, Indianapolis, IN 46208
$-3,088
Cash flow
-21.5%
Cash-on-Cash Return
1.3%
Cap rate
0.2%
Rent to Value Ratio
Active
$150,000
3
bds
|
2
ba
|
1,236
sqft
|
built
1940
3626 N Denny St, Indianapolis, IN 46218
$114
Cash flow
4.0%
Cash-on-Cash Return
7.2%
Cap rate
0.9%
Rent to Value Ratio
Active
$499,900
4
bds
|
5
ba
|
2,640
sqft
|
built
2020
2528 Carrollton Ave, Indianapolis, IN 46205
$-195
Cash flow
-2.0%
Cash-on-Cash Return
5.8%
Cap rate
0.7%
Rent to Value Ratio

Active
$400,000
4
bds
|
3
ba
|
2,804
sqft
|
built
1874
5312 E Southern Ave, Indianapolis, IN 46203
$-846
Cash flow
-11.0%
Cash-on-Cash Return
3.7%
Cap rate
0.4%
Rent to Value Ratio

Active
$595,000
4
bds
|
2
ba
|
2,668
sqft
|
built
1890
783 Woodruff Place Middle Dr, Indianapolis, IN 46201
$-1,381
Cash flow
-12.1%
Cash-on-Cash Return
3.5%
Cap rate
0.4%
Rent to Value Ratio
Active
$360,000
3
bds
|
3
ba
|
2,070
sqft
|
built
2022
2014 W Michigan St, Indianapolis, IN 46222
$53
Cash flow
0.8%
Cash-on-Cash Return
6.4%
Cap rate
0.8%
Rent to Value Ratio

Active
$329,000
4
bds
|
3
ba
|
3,082
sqft
|
built
1986
2747 E Midland Rd, Indianapolis, IN 46227
$-200
Cash flow
-3.2%
Cash-on-Cash Return
5.5%
Cap rate
0.7%
Rent to Value Ratio
Active
$600,000
6
bds
|
0
ba
|
0
sqft
|
built
1956
6430 E Southport Rd, Indianapolis, IN 46237
$-648
Cash flow
-5.6%
Cash-on-Cash Return
5.0%
Cap rate
0.6%
Rent to Value Ratio
Active
$180,000
3
bds
|
2
ba
|
1,528
sqft
|
built
1955
2309 N Dearborn St, Indianapolis, IN 46218
$26
Cash flow
0.8%
Cash-on-Cash Return
6.4%
Cap rate
0.8%
Rent to Value Ratio
Active
$114,900
2
bds
|
1
ba
|
938
sqft
|
built
1928
3031 E 38th St, Indianapolis, IN 46218
$159
Cash flow
7.2%
Cash-on-Cash Return
7.9%
Cap rate
1.0%
Rent to Value Ratio
Active
$287,500
2
bds
|
2
ba
|
1,254
sqft
|
built
1910
925 Fayette St, Indianapolis, IN 46202
$86
Cash flow
1.6%
Cash-on-Cash Return
6.6%
Cap rate
0.8%
Rent to Value Ratio
Active
$527,000
3
bds
|
3
ba
|
1,790
sqft
|
built
1955
1715 N Alabama St, Indianapolis, IN 46202
$9
Cash flow
0.1%
Cash-on-Cash Return
6.3%
Cap rate
0.8%
Rent to Value Ratio
Active
$309,900
3
bds
|
2
ba
|
1,848
sqft
|
built
1951
2526 Dell Zell Dr, Indianapolis, IN 46220
$-100
Cash flow
-1.7%
Cash-on-Cash Return
5.9%
Cap rate
0.7%
Rent to Value Ratio