Indianapolis, IN Investment Properties for Sale
Browse homes for sale and investment properties in Indianapolis, IN. Refine your search by price, property type, or more.
Best cash flowing properties in Indianapolis, IN

Active
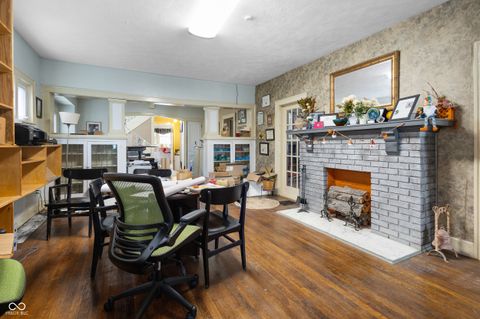
$62,000
1
bds
|
1
ba
|
624
sqft
|
built
1920
114 S Catherwood Ave, Indianapolis, IN 46219
$759
Cash flow
14.3%
Cash-on-Cash Return
14.7%
Cap rate
1.8%
Rent to Value Ratio
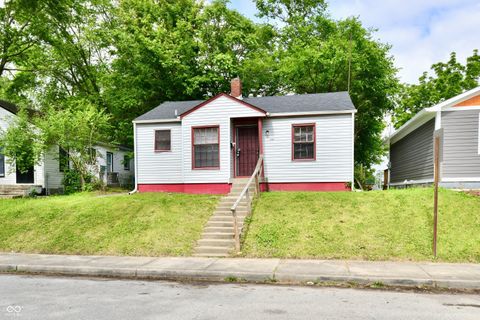
Active
$105,000
2
bds
|
1
ba
|
1,574
sqft
|
built
1950
2310 E Raymond St, Indianapolis, IN 46203
$418
Cash flow
20.8%
Cash-on-Cash Return
11.0%
Cap rate
1.3%
Rent to Value Ratio
2,136 out of 2,292 properties for sale in Indianapolis, IN
Limited Results Shown
Create a free account, or log in to reveal all property listings and enjoy the complete experience.

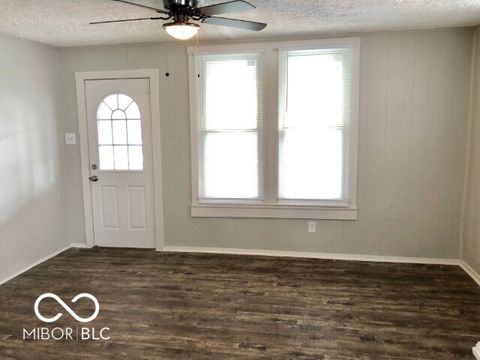
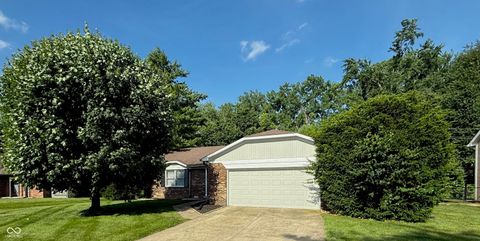
Active
$318,000
4
bds
|
3
ba
|
2,390
sqft
|
built
2019
4046 Stubbington Ln, Indianapolis, IN 46239
$11
Cash flow
0.2%
Cash-on-Cash Return
6.3%
Cap rate
0.8%
Rent to Value Ratio
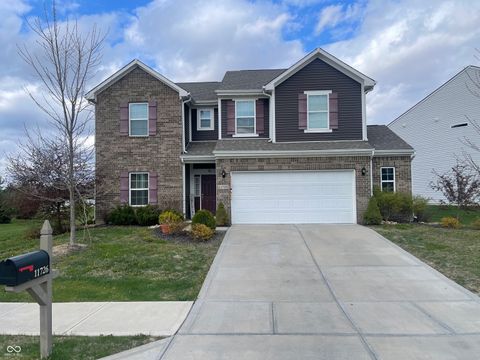
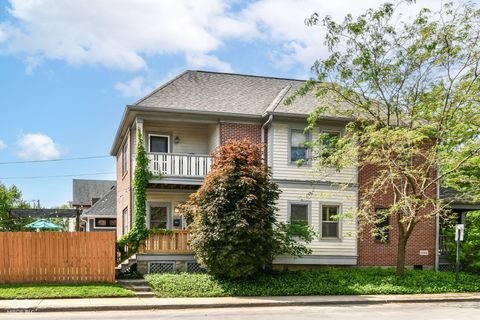
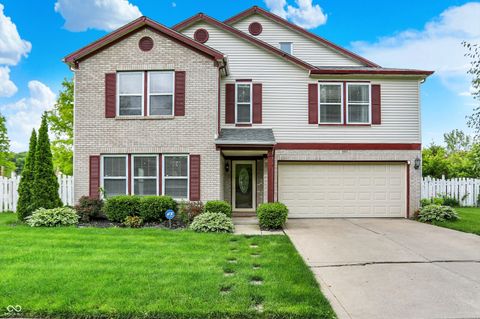
Active
$319,999
4
bds
|
3
ba
|
2,338
sqft
|
built
2019
11726 Zander Dr, Indianapolis, IN 46235
$27
Cash flow
0.4%
Cash-on-Cash Return
6.4%
Cap rate
0.8%
Rent to Value Ratio

Active
$322,500
2
bds
|
3
ba
|
1,403
sqft
|
built
2017
64 Central Greens Blvd, Indianapolis, IN 46222
$-129
Cash flow
-2.1%
Cash-on-Cash Return
5.8%
Cap rate
0.7%
Rent to Value Ratio

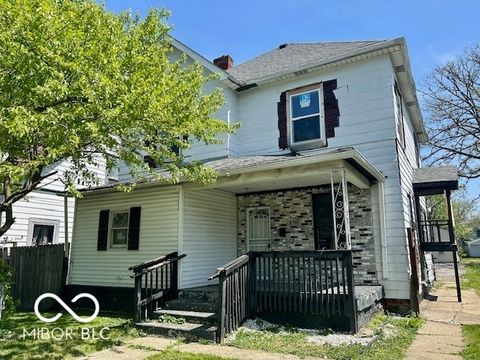
Active
$110,000
3
bds
|
1
ba
|
836
sqft
|
built
1910
2221 Langley Ave, Indianapolis, IN 46218
$254
Cash flow
12.0%
Cash-on-Cash Return
9.0%
Cap rate
1.1%
Rent to Value Ratio
Active
$695,000
4
bds
|
5
ba
|
3,384
sqft
|
built
2013
6519 Rothchild Blvd, Indianapolis, IN 46278
$-927
Cash flow
-7.0%
Cash-on-Cash Return
4.7%
Cap rate
0.6%
Rent to Value Ratio

Active
$375,000
4
bds
|
3
ba
|
2,980
sqft
|
built
2020
5303 Rum Cherry Way, Indianapolis, IN 46237
$-205
Cash flow
-2.9%
Cash-on-Cash Return
5.6%
Cap rate
0.7%
Rent to Value Ratio
Active
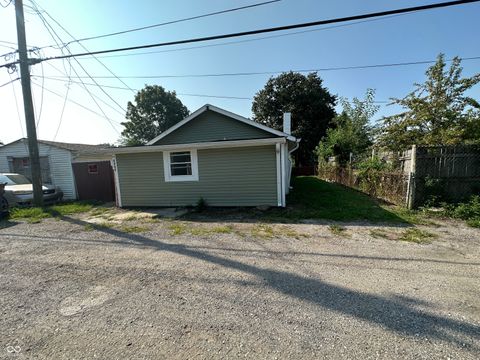
$62,000
1
bds
|
1
ba
|
624
sqft
|
built
1920
114 S Catherwood Ave, Indianapolis, IN 46219
$759
Cash flow
14.3%
Cash-on-Cash Return
14.7%
Cap rate
1.8%
Rent to Value Ratio

Active
$145,000
3
bds
|
1
ba
|
1,104
sqft
|
built
1970
533 Lynn St, Indianapolis, IN 46222
$140
Cash flow
5.0%
Cash-on-Cash Return
7.4%
Cap rate
0.9%
Rent to Value Ratio

Active
$195,000
3
bds
|
2
ba
|
1,154
sqft
|
built
1910
728 E Beecher St, Indianapolis, IN 46203
$-328
Cash flow
-8.8%
Cash-on-Cash Return
4.2%
Cap rate
0.5%
Rent to Value Ratio
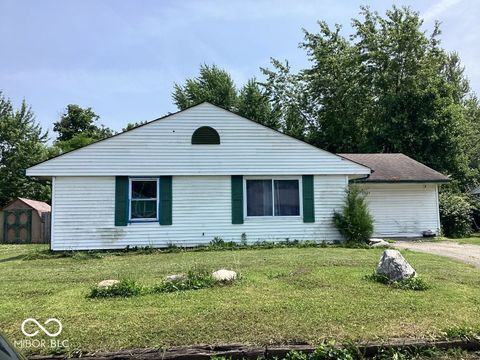
Active
$145,000
4
bds
|
1
ba
|
1,467
sqft
|
built
1963
9925 Catalina Dr, Indianapolis, IN 46235
$209
Cash flow
7.5%
Cash-on-Cash Return
8.0%
Cap rate
1.0%
Rent to Value Ratio
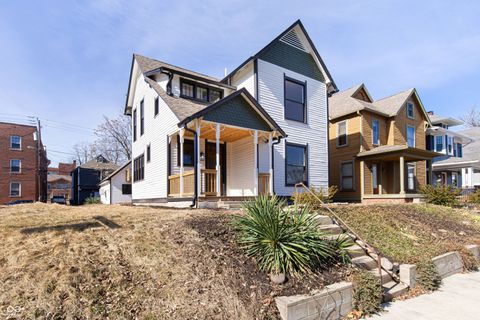
Active
$385,000
3
bds
|
3
ba
|
1,690
sqft
|
built
1885
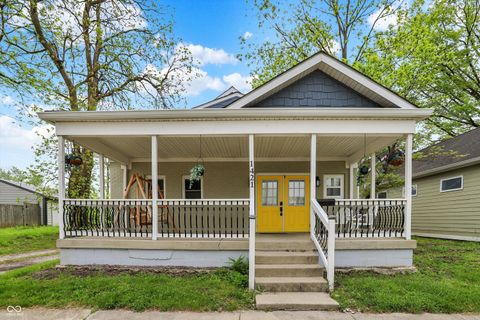
1421 Laurel St, Indianapolis, IN 46203
$-906
Cash flow
-12.3%
Cash-on-Cash Return
3.4%
Cap rate
0.4%
Rent to Value Ratio

Active
$160,000
0
bds
|
0
ba
|
0
sqft
|
built
1928
1105 N Parker Ave, Indianapolis, IN 46201
$-490
Cash flow
-16.0%
Cash-on-Cash Return
2.6%
Cap rate
0.3%
Rent to Value Ratio
Active
$209,900
2
bds
|
2
ba
|
1,326
sqft
|
built
1890
12003 Broadway St, Indianapolis, IN 46236
$-199
Cash flow
-4.9%
Cash-on-Cash Return
5.1%
Cap rate
0.6%
Rent to Value Ratio

Active
$190,000
3
bds
|
2
ba
|
1,152
sqft
|
built
1971
3026 Stuart St, Indianapolis, IN 46218
$-233
Cash flow
-6.4%
Cash-on-Cash Return
4.8%
Cap rate
0.6%
Rent to Value Ratio

Active
$250,000
4
bds
|
2
ba
|
1,957
sqft
|
built
1922
3134 N College Ave, Indianapolis, IN 46205
$-63
Cash flow
-1.3%
Cash-on-Cash Return
6.0%
Cap rate
0.7%
Rent to Value Ratio
Active
$670,000
3
bds
|
4
ba
|
3,149
sqft
|
built
1999
626 N Senate Ave, Indianapolis, IN 46202
$-1,621
Cash flow
-12.6%
Cash-on-Cash Return
3.4%
Cap rate
0.5%
Rent to Value Ratio
Active
$300,000
3
bds
|
1
ba
|
1,040
sqft
|
built
1947
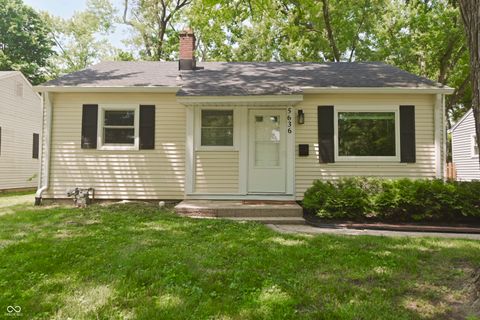
5636 Crittenden Ave, Indianapolis, IN 46220
$-324
Cash flow
-5.6%
Cash-on-Cash Return
5.0%
Cap rate
0.6%
Rent to Value Ratio
Active
$485,000
4
bds
|
0
ba
|
0
sqft
|
built
1910
15 W 28th St, Indianapolis, IN 46208
$-1,566
Cash flow
-16.8%
Cash-on-Cash Return
2.4%
Cap rate
0.3%
Rent to Value Ratio

Active
$364,900
3
bds
|
3
ba
|
1,868
sqft
|
built
1953
4359 Winthrop Ave, Indianapolis, IN 46205
$-111
Cash flow
-1.6%
Cash-on-Cash Return
5.9%
Cap rate
0.7%
Rent to Value Ratio

Active
$219,900
3
bds
|
2
ba
|
1,368
sqft
|
built
1959
8230 E 11th St, Indianapolis, IN 46219
$-44
Cash flow
-1.0%
Cash-on-Cash Return
6.0%
Cap rate
0.7%
Rent to Value Ratio

Active
$375,000
2
bds
|
1
ba
|
1,144
sqft
|
built
1924
5259 Broadway St, Indianapolis, IN 46220
$-371
Cash flow
-5.2%
Cash-on-Cash Return
5.1%
Cap rate
0.6%
Rent to Value Ratio
Active
$125,000
2
bds
|
1
ba
|
720
sqft
|
built
1946
2966 N Olney St, Indianapolis, IN 46218
$37
Cash flow
1.5%
Cash-on-Cash Return
6.6%
Cap rate
0.8%
Rent to Value Ratio
Active
$175,000
3
bds
|
1
ba
|
1,352
sqft
|
built
2005
302 S Randolph St, Indianapolis, IN 46201
$-155
Cash flow
-4.6%
Cash-on-Cash Return
5.2%
Cap rate
0.6%
Rent to Value Ratio
Active
$309,000
1
bds
|
2
ba
|
1,094
sqft
|
built
1996
635 E 10th St, Indianapolis, IN 46202
$-95
Cash flow
-1.6%
Cash-on-Cash Return
5.9%
Cap rate
0.7%
Rent to Value Ratio

Active
$635,000
2
bds
|
2
ba
|
1,863
sqft
|
built
1922
630 N College Ave, Indianapolis, IN 46204
$-1,650
Cash flow
-13.6%
Cash-on-Cash Return
3.1%
Cap rate
0.6%
Rent to Value Ratio

Active
$259,900
3
bds
|
3
ba
|
1,494
sqft
|
built
2004
3327 Brandenburg Blvd, Indianapolis, IN 46239
$0
Cash flow
0.0%
Cash-on-Cash Return
6.3%
Cap rate
0.8%
Rent to Value Ratio
Active
$274,000
3
bds
|
2
ba
|
1,570
sqft
|
built
1919
1124 E 35th St, Indianapolis, IN 46205
$157
Cash flow
3.0%
Cash-on-Cash Return
7.0%
Cap rate
0.8%
Rent to Value Ratio
Active
$224,900
3
bds
|
2
ba
|
1,776
sqft
|
built
1910
221 N Munsie St, Indianapolis, IN 46229
$68
Cash flow
1.6%
Cash-on-Cash Return
6.6%
Cap rate
0.8%
Rent to Value Ratio

Active
$149,900
2
bds
|
1
ba
|
768
sqft
|
built
1942
2835 S Lyons Ave, Indianapolis, IN 46241
$-162
Cash flow
-5.6%
Cash-on-Cash Return
5.0%
Cap rate
0.6%
Rent to Value Ratio
Active
$445,000
3
bds
|
2
ba
|
2,280
sqft
|
built
1939
3940 E 57th St, Indianapolis, IN 46220
$-598
Cash flow
-7.0%
Cash-on-Cash Return
4.7%
Cap rate
0.6%
Rent to Value Ratio
Active
$349,999
3
bds
|
3
ba
|
2,282
sqft
|
built
1986
11710 E 75th St, Indianapolis, IN 46236
$36
Cash flow
0.5%
Cash-on-Cash Return
6.4%
Cap rate
0.8%
Rent to Value Ratio
Active
$329,000
3
bds
|
2
ba
|
1,861
sqft
|
built
1987
1348 Secretariat Ln, Indianapolis, IN 46217
$-338
Cash flow
-5.4%
Cash-on-Cash Return
5.0%
Cap rate
0.6%
Rent to Value Ratio

Active
$127,500
2
bds
|
1
ba
|
954
sqft
|
built
1924
4931 Orion Ave, Indianapolis, IN 46201
$300
Cash flow
12.3%
Cash-on-Cash Return
9.1%
Cap rate
1.1%
Rent to Value Ratio
Active
$105,000
4
bds
|
2
ba
|
1,876
sqft
|
built
1876
2701 N Gale St, Indianapolis, IN 46218
$280
Cash flow
13.9%
Cash-on-Cash Return
9.5%
Cap rate
1.1%
Rent to Value Ratio

Active
$135,883
3
bds
|
1
ba
|
720
sqft
|
built
1953
929 Olin Ave, Indianapolis, IN 46222
$257
Cash flow
9.9%
Cash-on-Cash Return
8.5%
Cap rate
1.0%
Rent to Value Ratio
Active
$725,000
3
bds
|
4
ba
|
2,892
sqft
|
built
1895
2110 N Talbott St, Indianapolis, IN 46202
$-1,094
Cash flow
-7.9%
Cash-on-Cash Return
4.5%
Cap rate
0.5%
Rent to Value Ratio
Active
$105,000
2
bds
|
1
ba
|
1,574
sqft
|
built
1950
2310 E Raymond St, Indianapolis, IN 46203
$418
Cash flow
20.8%
Cash-on-Cash Return
11.0%
Cap rate
1.3%
Rent to Value Ratio
Active
$380,000
5
bds
|
3
ba
|
3,898
sqft
|
built
1999
9001 Harrison Run Ct, Indianapolis, IN 46256
$-85
Cash flow
-1.2%
Cash-on-Cash Return
6.0%
Cap rate
0.7%
Rent to Value Ratio

Active
$256,750
3
bds
|
2
ba
|
1,368
sqft
|
built
2016
914 Baden Manor Dr, Indianapolis, IN 46217
$-197
Cash flow
-4.0%
Cash-on-Cash Return
5.3%
Cap rate
0.7%
Rent to Value Ratio

Active
$250,000
3
bds
|
1
ba
|
1,328
sqft
|
built
1950
80 S Mickley Ave, Indianapolis, IN 46241
$-63
Cash flow
-1.3%
Cash-on-Cash Return
6.0%
Cap rate
0.7%
Rent to Value Ratio