Indianapolis, IN Investment Properties for Sale
Browse homes for sale and investment properties in Indianapolis, IN. Refine your search by price, property type, or more.
Best cash flowing properties in Indianapolis, IN
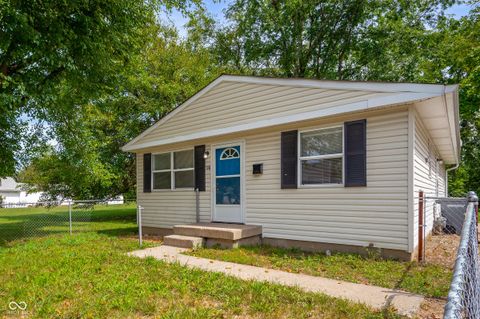
Active
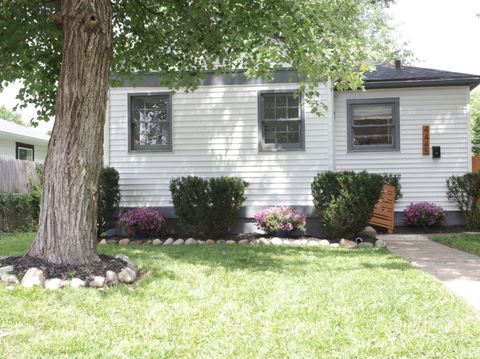
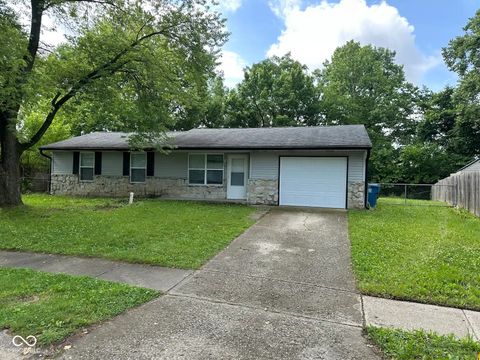
$149,000
3
bds
|
2
ba
|
1,104
sqft
|
built
1970
1141 Madeira St, Indianapolis, IN 46203
$341
Cash flow
11.9%
Cash-on-Cash Return
8.9%
Cap rate
1.1%
Rent to Value Ratio
Active
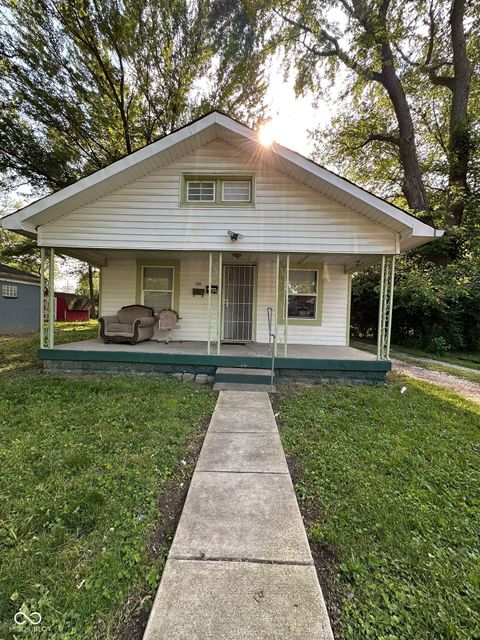
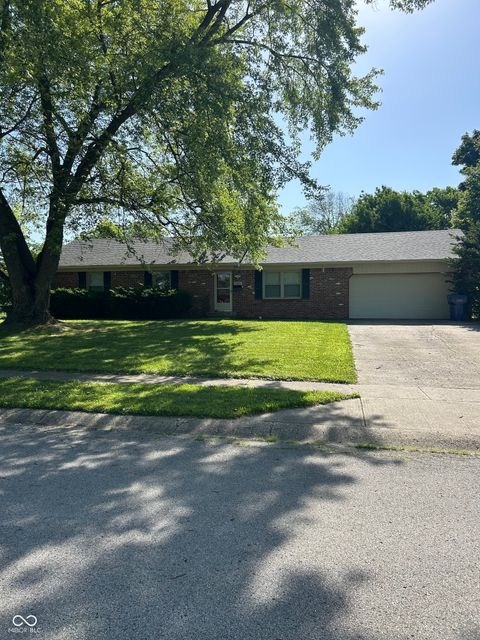
$84,900
1
bds
|
0
ba
|
0
sqft
|
built
1916
1513 N Kealing Ave, Indianapolis, IN 46201
$255
Cash flow
15.7%
Cash-on-Cash Return
9.8%
Cap rate
1.2%
Rent to Value Ratio
2,139 out of 2,296 properties for sale in Indianapolis, IN
Limited Results Shown
Create a free account, or log in to reveal all property listings and enjoy the complete experience.
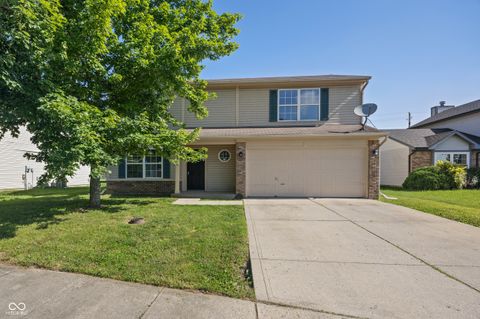
Active
$232,900
4
bds
|
2
ba
|
1,920
sqft
|
built
1976
7966 Chiltern Dr, Indianapolis, IN 46268
$49
Cash flow
1.1%
Cash-on-Cash Return
6.4%
Cap rate
0.8%
Rent to Value Ratio
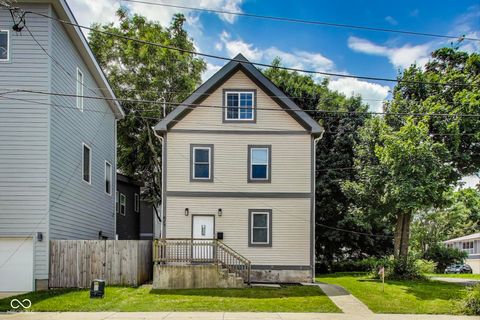
Active
$324,900
3
bds
|
2
ba
|
1,582
sqft
|
built
1956
4609 Andover Rd, Indianapolis, IN 46226
$-422
Cash flow
-6.8%
Cash-on-Cash Return
4.6%
Cap rate
0.6%
Rent to Value Ratio
Active
$185,000
2
bds
|
1
ba
|
924
sqft
|
built
1945
1433 N Colorado Ave, Indianapolis, IN 46201
$18
Cash flow
0.5%
Cash-on-Cash Return
6.3%
Cap rate
0.8%
Rent to Value Ratio
Active
$275,000
1
bds
|
2
ba
|
965
sqft
|
built
2006
355 E Ohio St, Indianapolis, IN 46204
$-429
Cash flow
-8.1%
Cash-on-Cash Return
4.3%
Cap rate
0.7%
Rent to Value Ratio
Active
$205,000
3
bds
|
3
ba
|
1,433
sqft
|
built
1954
3322 N Riley Ave, Indianapolis, IN 46218
$-15
Cash flow
-0.4%
Cash-on-Cash Return
6.1%
Cap rate
0.7%
Rent to Value Ratio
Active
$284,900
3
bds
|
1
ba
|
1,980
sqft
|
built
1943
315 W 43rd St, Indianapolis, IN 46208
$-217
Cash flow
-4.0%
Cash-on-Cash Return
5.2%
Cap rate
0.6%
Rent to Value Ratio
Active
$149,000
3
bds
|
2
ba
|
1,104
sqft
|
built
1970
1141 Madeira St, Indianapolis, IN 46203
$341
Cash flow
11.9%
Cash-on-Cash Return
8.9%
Cap rate
1.1%
Rent to Value Ratio
Active
$240,000
3
bds
|
3
ba
|
1,428
sqft
|
built
2005
2306 Brightwell Pl, Indianapolis, IN 46260
$-351
Cash flow
-7.6%
Cash-on-Cash Return
4.4%
Cap rate
0.7%
Rent to Value Ratio
Active
$299,900
3
bds
|
2
ba
|
1,824
sqft
|
built
1921
2543 Union St, Indianapolis, IN 46225
$-777
Cash flow
-13.5%
Cash-on-Cash Return
3.0%
Cap rate
0.4%
Rent to Value Ratio
Active
$189,000
3
bds
|
1
ba
|
1,164
sqft
|
built
1956
115 Hugo St, Indianapolis, IN 46229
$136
Cash flow
3.8%
Cash-on-Cash Return
7.0%
Cap rate
0.8%
Rent to Value Ratio

Active
$299,000
4
bds
|
3
ba
|
2,020
sqft
|
built
1995
6214 Weller Cir, Indianapolis, IN 46268
$-36
Cash flow
-0.6%
Cash-on-Cash Return
6.0%
Cap rate
0.7%
Rent to Value Ratio
Active
$285,000
3
bds
|
2
ba
|
1,560
sqft
|
built
1979
6120 E Southport Rd, Indianapolis, IN 46237
$-218
Cash flow
-4.0%
Cash-on-Cash Return
5.2%
Cap rate
0.6%
Rent to Value Ratio
Active
$265,000
3
bds
|
2
ba
|
912
sqft
|
built
1954
4445 Kingsley Dr, Indianapolis, IN 46205
$-322
Cash flow
-6.3%
Cash-on-Cash Return
4.7%
Cap rate
0.6%
Rent to Value Ratio
Active
$84,900
1
bds
|
0
ba
|
0
sqft
|
built
1916
1513 N Kealing Ave, Indianapolis, IN 46201
$255
Cash flow
15.7%
Cash-on-Cash Return
9.8%
Cap rate
1.2%
Rent to Value Ratio
Active
$185,000
2
bds
|
1
ba
|
1,354
sqft
|
built
1925
1728 N Somerset Ave, Indianapolis, IN 46222
$-189
Cash flow
-5.3%
Cash-on-Cash Return
4.9%
Cap rate
0.6%
Rent to Value Ratio
Active
$225,000
3
bds
|
3
ba
|
1,776
sqft
|
built
1998
10222 Arapahoe Dr, Indianapolis, IN 46235
$89
Cash flow
2.1%
Cash-on-Cash Return
6.6%
Cap rate
0.8%
Rent to Value Ratio
Active
$350,000
4
bds
|
4
ba
|
2,421
sqft
|
built
1905
629 E 25th St, Indianapolis, IN 46205
$-206
Cash flow
-3.1%
Cash-on-Cash Return
5.4%
Cap rate
0.7%
Rent to Value Ratio
Active
$164,900
3
bds
|
2
ba
|
888
sqft
|
built
1983
4405 Phoenix Dr, Indianapolis, IN 46241
$121
Cash flow
3.8%
Cash-on-Cash Return
7.0%
Cap rate
0.8%
Rent to Value Ratio
Active
$224,900
3
bds
|
2
ba
|
1,350
sqft
|
built
1987
5453 David St, Indianapolis, IN 46226
$-48
Cash flow
-1.1%
Cash-on-Cash Return
5.9%
Cap rate
0.7%
Rent to Value Ratio