Indianapolis, IN Investment Properties for Sale
Browse homes for sale and investment properties in Indianapolis, IN. Refine your search by price, property type, or more.
Best cash flowing properties in Indianapolis, IN

Active
$89,900
2
bds
|
1
ba
|
1,120
sqft
|
built
1920
2821 E 13th St, Indianapolis, IN 46201
$290
Cash flow
16.8%
Cash-on-Cash Return
10.1%
Cap rate
1.2%
Rent to Value Ratio

Active
$140,000
0
bds
|
0
ba
|
0
sqft
|
built
1941
4920 E 34th St, Indianapolis, IN 46218
$235
Cash flow
8.8%
Cash-on-Cash Return
8.3%
Cap rate
1.0%
Rent to Value Ratio
2,139 out of 2,296 properties for sale in Indianapolis, IN
Limited Results Shown
Create a free account, or log in to reveal all property listings and enjoy the complete experience.
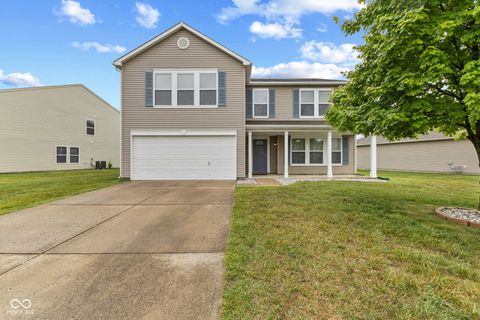
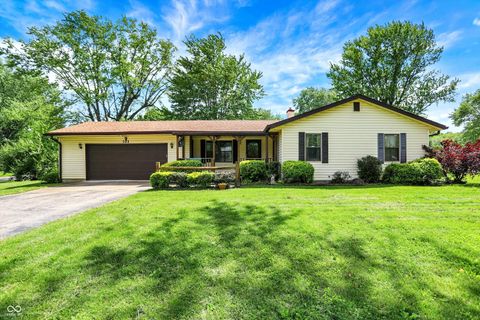
Active
$390,900
4
bds
|
3
ba
|
3,420
sqft
|
built
1977
8528 Quail Hollow Rd, Indianapolis, IN 46260
$-474
Cash flow
-6.3%
Cash-on-Cash Return
4.8%
Cap rate
0.7%
Rent to Value Ratio

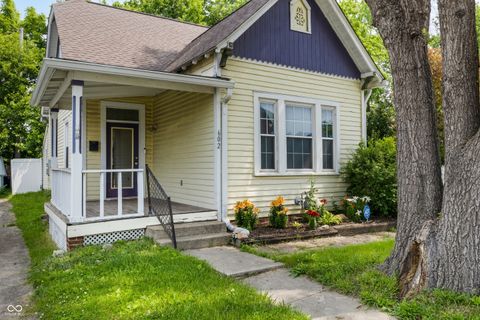
Active
$159,900
3
bds
|
2
ba
|
1,102
sqft
|
built
1931
2146 Gent Ave, Indianapolis, IN 46202
$131
Cash flow
4.3%
Cash-on-Cash Return
7.2%
Cap rate
0.9%
Rent to Value Ratio

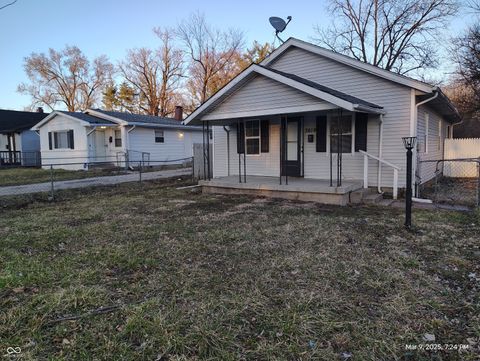
Active
$174,900
3
bds
|
1
ba
|
1,073
sqft
|
built
1963
3509 N Wittfield St, Indianapolis, IN 46235
$122
Cash flow
3.6%
Cash-on-Cash Return
7.1%
Cap rate
0.9%
Rent to Value Ratio
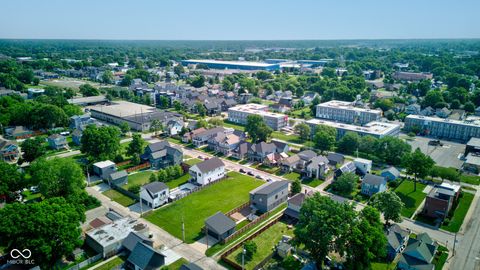
Active
$620,000
5
bds
|
5
ba
|
5,212
sqft
|
built
1999
6610 Royal Oakland Dr, Indianapolis, IN 46236
$-270
Cash flow
-2.3%
Cash-on-Cash Return
5.7%
Cap rate
0.7%
Rent to Value Ratio

Active
$200,450
2
bds
|
2
ba
|
1,147
sqft
|
built
2002
3908 Roundwood Dr, Indianapolis, IN 46235
$58
Cash flow
1.5%
Cash-on-Cash Return
6.6%
Cap rate
0.8%
Rent to Value Ratio
Active
$325,000
3
bds
|
0
ba
|
0
sqft
|
built
1929
5713 Bluff Rd, Indianapolis, IN 46217
$-593
Cash flow
-9.5%
Cash-on-Cash Return
4.1%
Cap rate
0.5%
Rent to Value Ratio

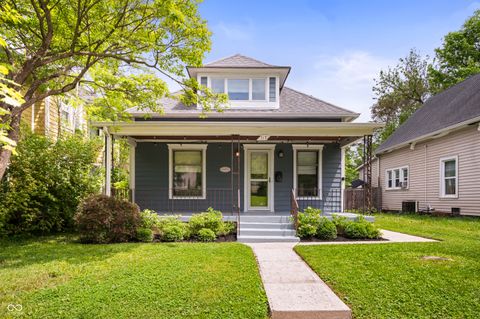
Active
$150,000
3
bds
|
1
ba
|
1,176
sqft
|
built
1910
57 N Tremont St, Indianapolis, IN 46222
$183
Cash flow
6.4%
Cash-on-Cash Return
7.7%
Cap rate
0.9%
Rent to Value Ratio
Active
$349,900
2
bds
|
3
ba
|
1,281
sqft
|
built
2022
2125 Coretta Way, Indianapolis, IN 46202
$-5
Cash flow
-0.1%
Cash-on-Cash Return
6.2%
Cap rate
0.8%
Rent to Value Ratio
Active
$140,000
0
bds
|
0
ba
|
0
sqft
|
built
1941
4920 E 34th St, Indianapolis, IN 46218
$235
Cash flow
8.8%
Cash-on-Cash Return
8.3%
Cap rate
1.0%
Rent to Value Ratio
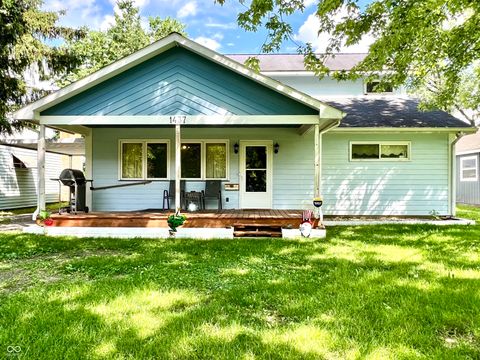
Active
$240,000
3
bds
|
2
ba
|
2,300
sqft
|
built
1955
1437 E Pleasant Run Parkway South Dr, Indianapolis, IN 46203
$-149
Cash flow
-3.2%
Cash-on-Cash Return
5.5%
Cap rate
0.7%
Rent to Value Ratio
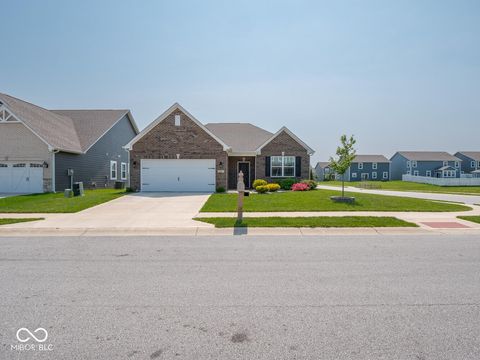
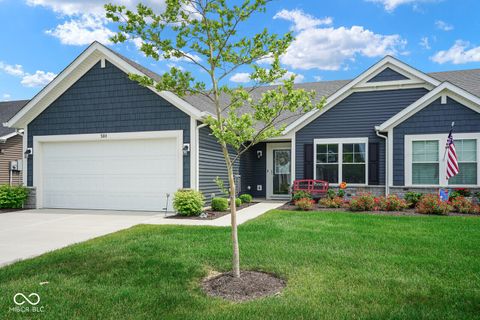
Active
$319,990
3
bds
|
2
ba
|
1,650
sqft
|
built
2021
9001 Fitzgerald Dr, Indianapolis, IN 46239
$-334
Cash flow
-5.4%
Cash-on-Cash Return
5.0%
Cap rate
0.6%
Rent to Value Ratio
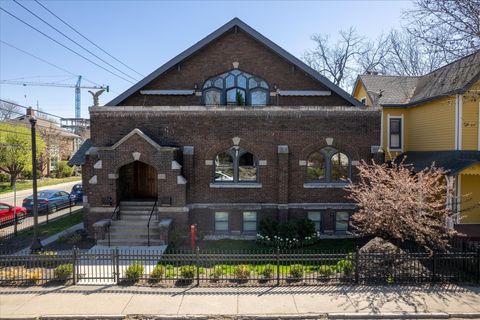
Active
$1,050,000
3
bds
|
3
ba
|
3,293
sqft
|
built
1907
749 N Park Ave, Indianapolis, IN 46202
$-2,318
Cash flow
-11.5%
Cash-on-Cash Return
3.6%
Cap rate
0.5%
Rent to Value Ratio
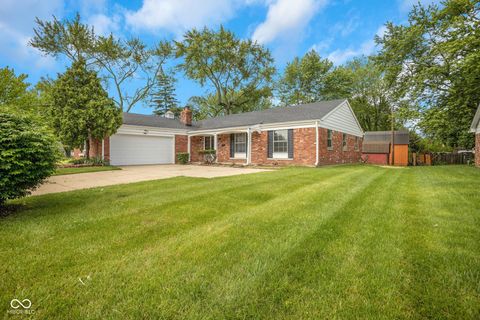
Active
$294,900
4
bds
|
2
ba
|
1,824
sqft
|
built
1968
3148 Arbutus Dr, Indianapolis, IN 46224
$-298
Cash flow
-5.3%
Cash-on-Cash Return
5.1%
Cap rate
0.6%
Rent to Value Ratio

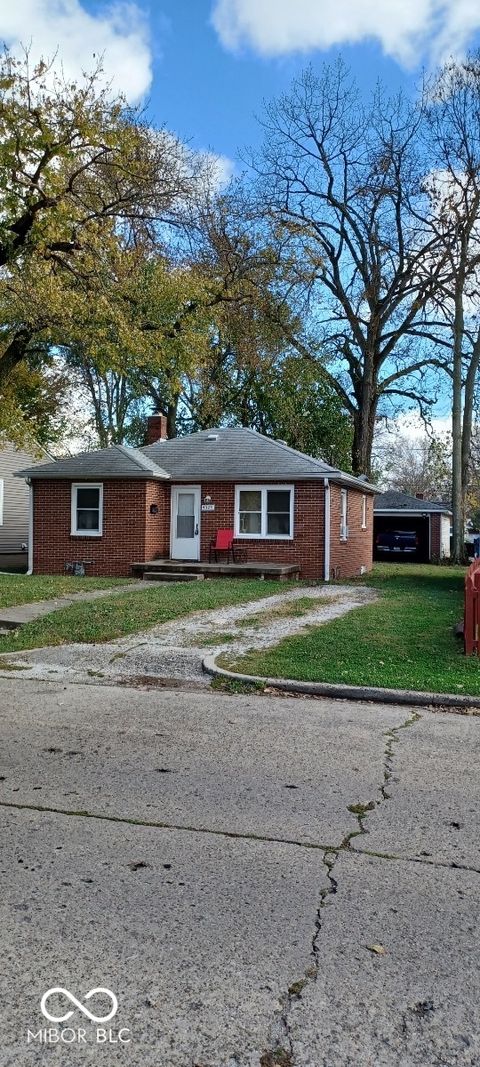
Active
$140,000
2
bds
|
1
ba
|
902
sqft
|
built
1908
1035 S Tremont St, Indianapolis, IN 46221
$97
Cash flow
3.6%
Cash-on-Cash Return
7.1%
Cap rate
0.9%
Rent to Value Ratio
Active
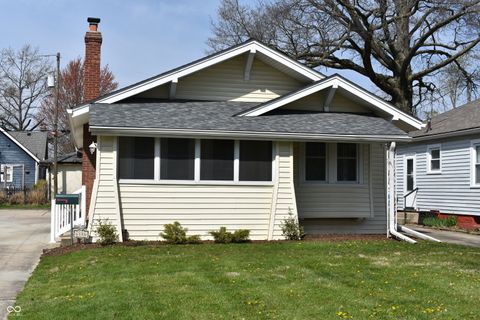
$89,900
2
bds
|
1
ba
|
1,120
sqft
|
built
1920
2821 E 13th St, Indianapolis, IN 46201
$290
Cash flow
16.8%
Cash-on-Cash Return
10.1%
Cap rate
1.2%
Rent to Value Ratio
Active
$360,000
5
bds
|
3
ba
|
3,502
sqft
|
built
2002
5637 Woodland Trace Blvd, Indianapolis, IN 46237
$-189
Cash flow
-2.7%
Cash-on-Cash Return
5.6%
Cap rate
0.7%
Rent to Value Ratio
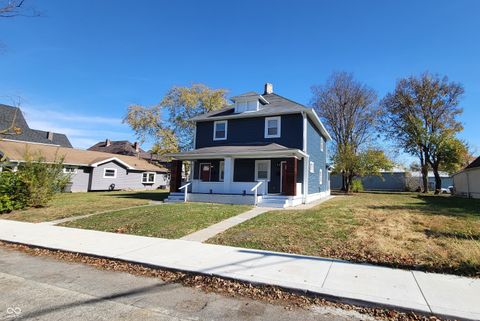
Active
$129,900
3
bds
|
2
ba
|
1,188
sqft
|
built
1930
3619 N Hawthorne Ln, Indianapolis, IN 46218
$219
Cash flow
8.8%
Cash-on-Cash Return
8.3%
Cap rate
1.0%
Rent to Value Ratio
Active
$285,000
3
bds
|
3
ba
|
2,044
sqft
|
built
1921
602 Prospect St, Indianapolis, IN 46203
$-108
Cash flow
-2.0%
Cash-on-Cash Return
5.8%
Cap rate
0.7%
Rent to Value Ratio
Active
$767,500
4
bds
|
4
ba
|
3,747
sqft
|
built
2018
1622 Cornell Ave, Indianapolis, IN 46202
$-488
Cash flow
-3.3%
Cash-on-Cash Return
5.5%
Cap rate
0.7%
Rent to Value Ratio
Active
$339,500
4
bds
|
3
ba
|
2,316
sqft
|
built
1968
839 Fernwood Ct, Indianapolis, IN 46234
$-100
Cash flow
-1.5%
Cash-on-Cash Return
5.9%
Cap rate
0.7%
Rent to Value Ratio

Active
$499,900
4
bds
|
4
ba
|
4,055
sqft
|
built
1993
7341 Campfire Run, Indianapolis, IN 46236
$-477
Cash flow
-5.0%
Cash-on-Cash Return
5.1%
Cap rate
0.6%
Rent to Value Ratio
Active
$305,000
4
bds
|
3
ba
|
2,370
sqft
|
built
1974
1612 Westbay Ct, Indianapolis, IN 46260
$-74
Cash flow
-1.3%
Cash-on-Cash Return
6.0%
Cap rate
0.7%
Rent to Value Ratio
Active
$475,000
4
bds
|
4
ba
|
3,500
sqft
|
built
1890
19 E Regent St, Indianapolis, IN 46225
$-1,514
Cash flow
-16.6%
Cash-on-Cash Return
2.4%
Cap rate
0.3%
Rent to Value Ratio

Active
$500,000
4
bds
|
4
ba
|
2,817
sqft
|
built
1985
8310 Fall Creek Rd, Indianapolis, IN 46256
$-678
Cash flow
-7.1%
Cash-on-Cash Return
4.6%
Cap rate
0.6%
Rent to Value Ratio
Active
$164,900
3
bds
|
2
ba
|
1,100
sqft
|
built
2017
317 N Bradley Ave, Indianapolis, IN 46201
$-33
Cash flow
-1.0%
Cash-on-Cash Return
6.0%
Cap rate
0.7%
Rent to Value Ratio
Active
$220,000
3
bds
|
1
ba
|
1,168
sqft
|
built
1955
101 Heiny Rd, Indianapolis, IN 46217
$-114
Cash flow
-2.7%
Cash-on-Cash Return
5.6%
Cap rate
0.7%
Rent to Value Ratio
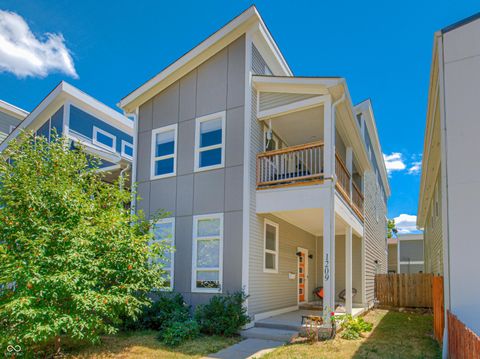
Active
$420,000
4
bds
|
3
ba
|
2,332
sqft
|
built
2017
1209 Cottage Ave, Indianapolis, IN 46203
$222
Cash flow
2.8%
Cash-on-Cash Return
6.9%
Cap rate
0.8%
Rent to Value Ratio
Active
$290,000
2
bds
|
2
ba
|
1,599
sqft
|
built
2022
7184 Lillian Pl, Indianapolis, IN 46229
$-469
Cash flow
-8.4%
Cash-on-Cash Return
4.3%
Cap rate
0.6%
Rent to Value Ratio
Active
$159,900
2
bds
|
1
ba
|
720
sqft
|
built
1949
4529 Crittenden Ave, Indianapolis, IN 46205
$-7
Cash flow
-0.2%
Cash-on-Cash Return
6.2%
Cap rate
0.8%
Rent to Value Ratio
Active
$266,000
3
bds
|
2
ba
|
1,255
sqft
|
built
1987
7850 Park North Bnd, Indianapolis, IN 46260
$-38
Cash flow
-0.7%
Cash-on-Cash Return
6.1%
Cap rate
0.8%
Rent to Value Ratio
Active
$237,000
2
bds
|
2
ba
|
1,219
sqft
|
built
1922
2320 Spann Ave, Indianapolis, IN 46203
$143
Cash flow
3.1%
Cash-on-Cash Return
7.0%
Cap rate
0.8%
Rent to Value Ratio

Active
$419,900
3
bds
|
0
ba
|
0
sqft
|
built
1909
4055 N College Ave, Indianapolis, IN 46205
$-1,226
Cash flow
-15.2%
Cash-on-Cash Return
2.8%
Cap rate
0.3%
Rent to Value Ratio
Active
$198,000
3
bds
|
2
ba
|
1,471
sqft
|
built
1945
1907 N Drexel Ave, Indianapolis, IN 46218
$-68
Cash flow
-1.8%
Cash-on-Cash Return
5.9%
Cap rate
0.7%
Rent to Value Ratio
Active
$345,000
4
bds
|
3
ba
|
2,842
sqft
|
built
2003
5236 Skipping Stone Dr, Indianapolis, IN 46237
$-312
Cash flow
-4.7%
Cash-on-Cash Return
5.2%
Cap rate
0.6%
Rent to Value Ratio
Active
$312,500
2
bds
|
1
ba
|
1,691
sqft
|
built
1924
6186 Ralston Ave, Indianapolis, IN 46220
$-389
Cash flow
-6.5%
Cash-on-Cash Return
4.8%
Cap rate
0.6%
Rent to Value Ratio
Active
$290,000
3
bds
|
2
ba
|
1,846
sqft
|
built
1932
117 S Spencer Ave, Indianapolis, IN 46219
$4
Cash flow
0.1%
Cash-on-Cash Return
6.3%
Cap rate
0.8%
Rent to Value Ratio

Active
$549,900
3
bds
|
3
ba
|
2,672
sqft
|
built
2016
1409 Spann Ave, Indianapolis, IN 46203
$-387
Cash flow
-3.7%
Cash-on-Cash Return
5.4%
Cap rate
0.7%
Rent to Value Ratio
Active
$1,200,000
4
bds
|
6
ba
|
7,186
sqft
|
built
2013
7610 Monte Carlo Way, Indianapolis, IN 46278
$-2,809
Cash flow
-12.2%
Cash-on-Cash Return
3.5%
Cap rate
0.4%
Rent to Value Ratio

Active
$485,000
4
bds
|
4
ba
|
3,605
sqft
|
built
1974
7242 Highburry Dr, Indianapolis, IN 46256
$-324
Cash flow
-3.5%
Cash-on-Cash Return
5.5%
Cap rate
0.7%
Rent to Value Ratio
Active
$327,000
2
bds
|
0
ba
|
0
sqft
|
built
1928
2141 Bellefontaine St, Indianapolis, IN 46202
$-879
Cash flow
-14.0%
Cash-on-Cash Return
3.0%
Cap rate
0.4%
Rent to Value Ratio