Indianapolis, IN Investment Properties for Sale
Browse homes for sale and investment properties in Indianapolis, IN. Refine your search by price, property type, or more.
Best cash flowing properties in Indianapolis, IN

Active
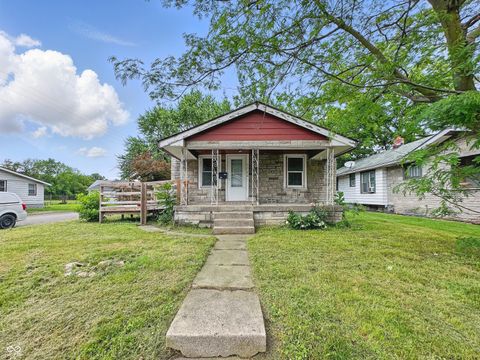
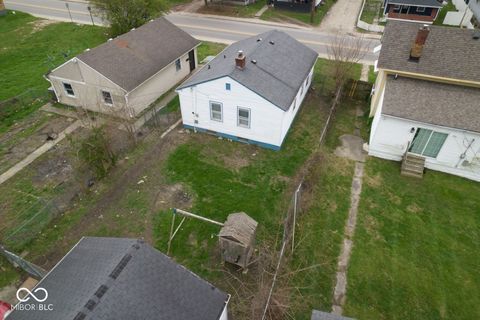
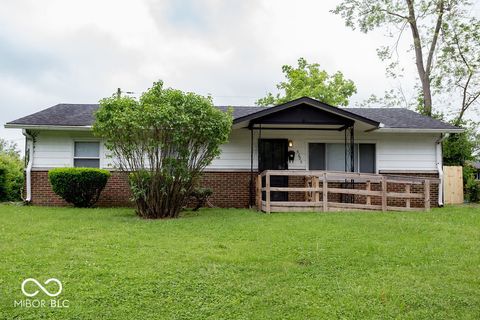
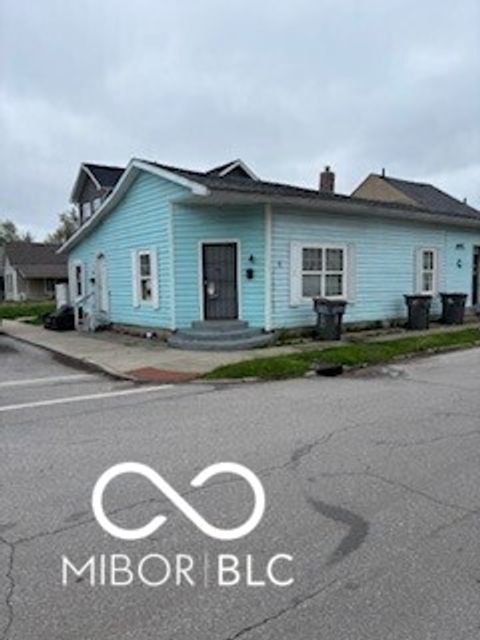
$110,000
2
bds
|
1
ba
|
816
sqft
|
built
1949
2219 N Webster Ave, Indianapolis, IN 46219
$599
Cash flow
28.4%
Cash-on-Cash Return
12.8%
Cap rate
1.5%
Rent to Value Ratio
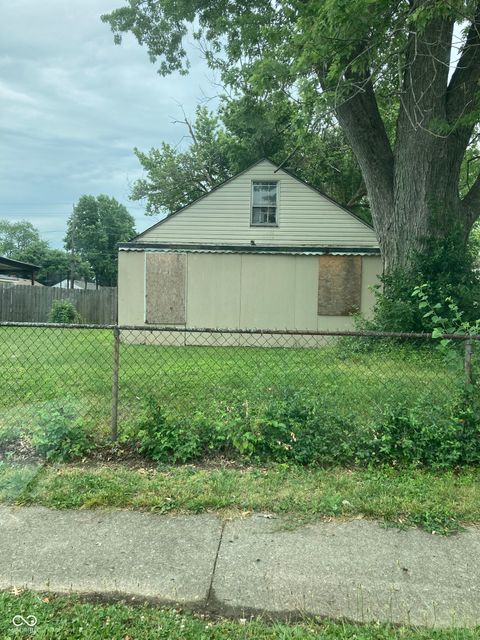
Active
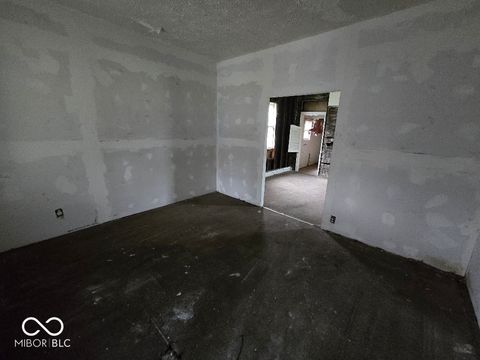
$88,500
2
bds
|
1
ba
|
864
sqft
|
built
1919
3526 E Vermont St, Indianapolis, IN 46201
$504
Cash flow
29.7%
Cash-on-Cash Return
13.1%
Cap rate
1.6%
Rent to Value Ratio
2,136 out of 2,292 properties for sale in Indianapolis, IN
Limited Results Shown
Create a free account, or log in to reveal all property listings and enjoy the complete experience.
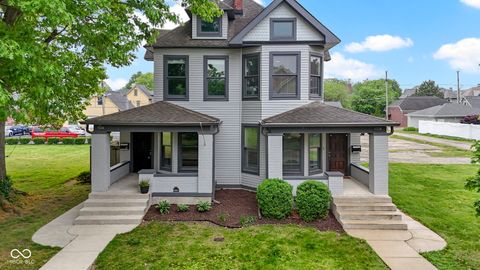
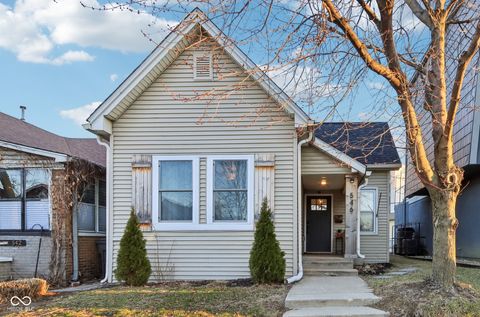
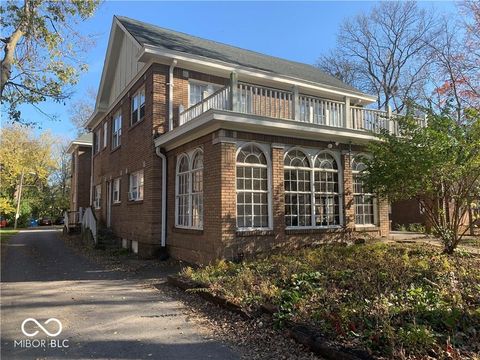
Active
$510,000
3
bds
|
4
ba
|
2,928
sqft
|
built
1902
1526 Carrollton Ave, Indianapolis, IN 46202
$-248
Cash flow
-2.5%
Cash-on-Cash Return
5.7%
Cap rate
0.7%
Rent to Value Ratio
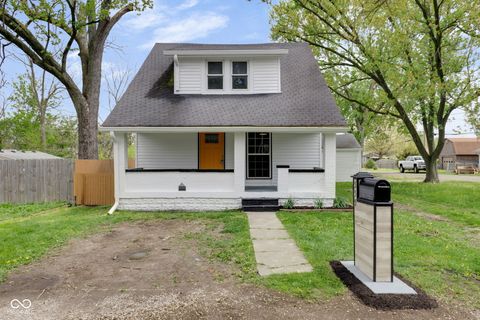
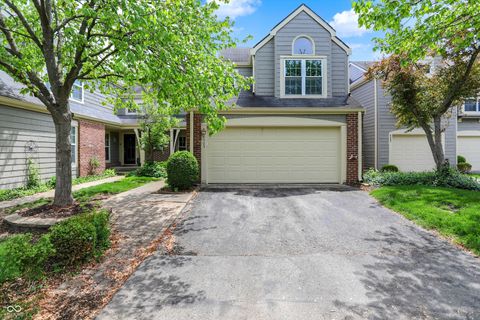
Active
$230,000
4
bds
|
2
ba
|
1,408
sqft
|
built
1928
555 S Auburn St, Indianapolis, IN 46241
$-373
Cash flow
-8.5%
Cash-on-Cash Return
4.3%
Cap rate
0.5%
Rent to Value Ratio
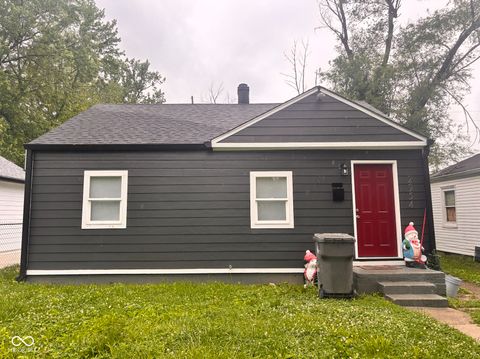
Active
$129,999
2
bds
|
1
ba
|
672
sqft
|
built
1950
2954 N Drexel Ave, Indianapolis, IN 46218
$80
Cash flow
3.2%
Cash-on-Cash Return
7.0%
Cap rate
0.8%
Rent to Value Ratio
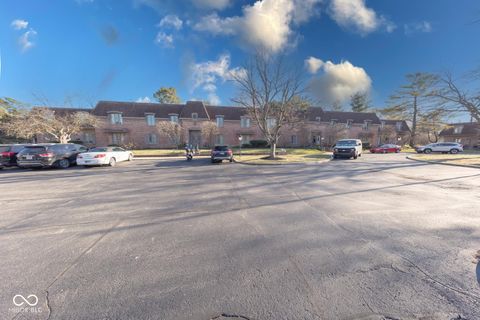
Active
$120,000
2
bds
|
2
ba
|
1,216
sqft
|
built
1966
7411 Country Brook Dr, Indianapolis, IN 46260
$-151
Cash flow
-6.6%
Cash-on-Cash Return
4.8%
Cap rate
1.0%
Rent to Value Ratio

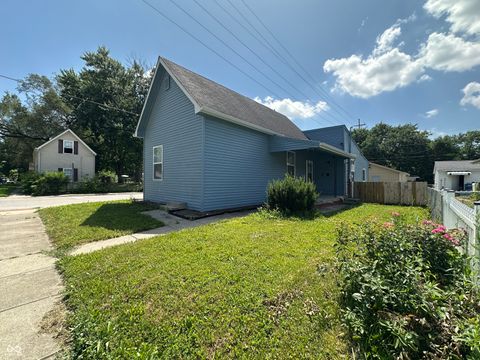
Active
$168,500
2
bds
|
1
ba
|
920
sqft
|
built
1920
936 N Oxford St, Indianapolis, IN 46201
$224
Cash flow
6.9%
Cash-on-Cash Return
7.9%
Cap rate
0.9%
Rent to Value Ratio
Active
$799,000
3
bds
|
3
ba
|
2,667
sqft
|
built
1954
7575 Central Ave, Indianapolis, IN 46240
$-997
Cash flow
-6.5%
Cash-on-Cash Return
4.8%
Cap rate
0.6%
Rent to Value Ratio
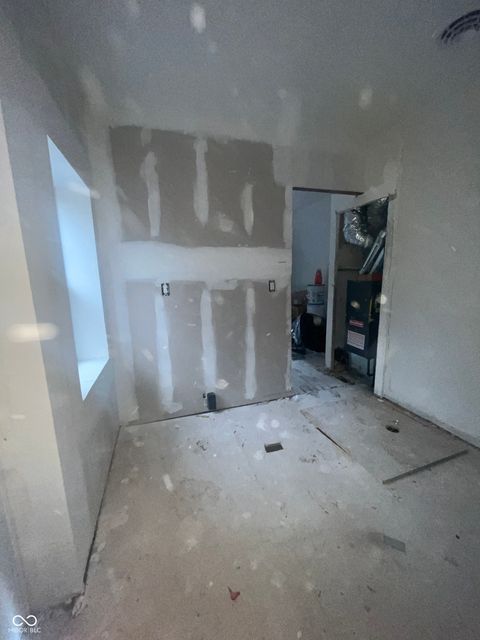
Active
$182,500
3
bds
|
2
ba
|
912
sqft
|
built
1962
3262 Orchard Ave, Indianapolis, IN 46218
$13
Cash flow
0.4%
Cash-on-Cash Return
6.4%
Cap rate
0.8%
Rent to Value Ratio
Active
$88,500
2
bds
|
1
ba
|
864
sqft
|
built
1919
3526 E Vermont St, Indianapolis, IN 46201
$504
Cash flow
29.7%
Cash-on-Cash Return
13.1%
Cap rate
1.6%
Rent to Value Ratio
Active
$110,000
2
bds
|
1
ba
|
816
sqft
|
built
1949
2219 N Webster Ave, Indianapolis, IN 46219
$599
Cash flow
28.4%
Cash-on-Cash Return
12.8%
Cap rate
1.5%
Rent to Value Ratio

Active
$375,000
4
bds
|
3
ba
|
2,589
sqft
|
built
2018
1909 Orange St, Indianapolis, IN 46203
$-95
Cash flow
-1.3%
Cash-on-Cash Return
6.0%
Cap rate
0.7%
Rent to Value Ratio
Active
$258,000
3
bds
|
2
ba
|
2,358
sqft
|
built
1954
3638 Redfern Dr, Indianapolis, IN 46237
$-174
Cash flow
-3.5%
Cash-on-Cash Return
5.5%
Cap rate
0.7%
Rent to Value Ratio

Active
$400,000
3
bds
|
2
ba
|
2,057
sqft
|
built
1985
5431 Nathan Pl, Indianapolis, IN 46237
$-708
Cash flow
-9.2%
Cash-on-Cash Return
4.1%
Cap rate
0.5%
Rent to Value Ratio
Active
$98,000
2
bds
|
1
ba
|
836
sqft
|
built
1950
3924 E 30th St, Indianapolis, IN 46218
$247
Cash flow
13.1%
Cash-on-Cash Return
9.3%
Cap rate
1.1%
Rent to Value Ratio

Active
$289,900
4
bds
|
4
ba
|
1,738
sqft
|
built
1990
1831 Beckenbauer Ln, Indianapolis, IN 46214
$-133
Cash flow
-2.4%
Cash-on-Cash Return
5.7%
Cap rate
0.7%
Rent to Value Ratio

Active
$330,000
4
bds
|
3
ba
|
2,396
sqft
|
built
2003
5502 Floating Leaf Dr, Indianapolis, IN 46237
$-365
Cash flow
-5.8%
Cash-on-Cash Return
4.9%
Cap rate
0.6%
Rent to Value Ratio
Active
$149,900
1
bds
|
0
ba
|
0
sqft
|
built
1910
2507 Rader St, Indianapolis, IN 46208
$45
Cash flow
1.6%
Cash-on-Cash Return
6.6%
Cap rate
0.8%
Rent to Value Ratio

Active
$330,000
3
bds
|
3
ba
|
2,689
sqft
|
built
1966
2016 Colt Rd, Indianapolis, IN 46227
$2
Cash flow
0.0%
Cash-on-Cash Return
6.3%
Cap rate
0.8%
Rent to Value Ratio
Active
$309,900
2
bds
|
2
ba
|
812
sqft
|
built
1925
546 E Merrill St, Indianapolis, IN 46203
$107
Cash flow
1.8%
Cash-on-Cash Return
6.7%
Cap rate
0.8%
Rent to Value Ratio
Active
$235,000
2
bds
|
3
ba
|
1,454
sqft
|
built
1985
6505 Miramar Ct, Indianapolis, IN 46250
$-270
Cash flow
-6.0%
Cash-on-Cash Return
4.9%
Cap rate
0.8%
Rent to Value Ratio
Active
$169,900
4
bds
|
2
ba
|
1,056
sqft
|
built
1957
5605 Glencoe St, Indianapolis, IN 46226
$79
Cash flow
2.4%
Cash-on-Cash Return
6.8%
Cap rate
0.8%
Rent to Value Ratio

Active
$96,500
3
bds
|
1
ba
|
772
sqft
|
built
1955
314 N Reisner St, Indianapolis, IN 46222
$462
Cash flow
25.0%
Cash-on-Cash Return
12.0%
Cap rate
1.5%
Rent to Value Ratio
Active
$119,900
2
bds
|
2
ba
|
1,274
sqft
|
built
1970
5525 Roxbury Ter, Indianapolis, IN 46226
$-286
Cash flow
-12.4%
Cash-on-Cash Return
3.4%
Cap rate
1.2%
Rent to Value Ratio
Active
$190,000
3
bds
|
2
ba
|
1,186
sqft
|
built
1910
1256 Kappes St, Indianapolis, IN 46221
$-26
Cash flow
-0.7%
Cash-on-Cash Return
6.1%
Cap rate
0.7%
Rent to Value Ratio
Active
$99,000
2
bds
|
0
ba
|
0
sqft
|
built
1948
2870 Stuart St, Indianapolis, IN 46218
$-103
Cash flow
-5.4%
Cash-on-Cash Return
5.0%
Cap rate
0.6%
Rent to Value Ratio

Active
$120,000
2
bds
|
1
ba
|
912
sqft
|
built
1920
1405 N Mount St, Indianapolis, IN 46222
$340
Cash flow
14.8%
Cash-on-Cash Return
9.7%
Cap rate
1.2%
Rent to Value Ratio
Active
$469,900
3
bds
|
3
ba
|
2,089
sqft
|
built
2000
1334 E Market St, Indianapolis, IN 46202
$-728
Cash flow
-8.1%
Cash-on-Cash Return
4.4%
Cap rate
0.5%
Rent to Value Ratio
Active
$115,000
2
bds
|
1
ba
|
1,053
sqft
|
built
1895
1332 W 26th St, Indianapolis, IN 46208
$366
Cash flow
16.6%
Cash-on-Cash Return
10.1%
Cap rate
1.2%
Rent to Value Ratio

Active
$362,000
3
bds
|
3
ba
|
2,414
sqft
|
built
1996
5014 Melbourne Rd, Indianapolis, IN 46228
$-165
Cash flow
-2.4%
Cash-on-Cash Return
5.7%
Cap rate
0.7%
Rent to Value Ratio

Active
$485,000
6
bds
|
5
ba
|
3,608
sqft
|
built
1973
660 Sun Valley Ct, Indianapolis, IN 46217
$-1,152
Cash flow
-12.4%
Cash-on-Cash Return
3.4%
Cap rate
0.4%
Rent to Value Ratio

Active
$295,000
4
bds
|
3
ba
|
2,024
sqft
|
built
1965
6801 Shalimar Ct, Indianapolis, IN 46214
$-160
Cash flow
-2.8%
Cash-on-Cash Return
5.6%
Cap rate
0.7%
Rent to Value Ratio
Active
$95,000
2
bds
|
1
ba
|
720
sqft
|
built
1950
2901 S Taft Ave, Indianapolis, IN 46241
$263
Cash flow
14.4%
Cash-on-Cash Return
9.6%
Cap rate
1.2%
Rent to Value Ratio

Active
$274,900
4
bds
|
3
ba
|
1,692
sqft
|
built
1991
10604 Creekside Woods Dr, Indianapolis, IN 46239
$-419
Cash flow
-8.0%
Cash-on-Cash Return
4.4%
Cap rate
0.5%
Rent to Value Ratio
Active
$369,000
2
bds
|
2
ba
|
1,936
sqft
|
built
2005
1074 Reserve Way, Indianapolis, IN 46220
$-506
Cash flow
-7.2%
Cash-on-Cash Return
4.6%
Cap rate
0.7%
Rent to Value Ratio
Active
$164,900
3
bds
|
0
ba
|
0
sqft
|
built
1920
1602 E Minnesota St, Indianapolis, IN 46203
$-102
Cash flow
-3.2%
Cash-on-Cash Return
5.5%
Cap rate
0.7%
Rent to Value Ratio
Active
$115,000
4
bds
|
1
ba
|
1,304
sqft
|
built
1930
2515 S Lockburn St, Indianapolis, IN 46241
$159
Cash flow
7.2%
Cash-on-Cash Return
7.9%
Cap rate
1.0%
Rent to Value Ratio

Active
$112,000
2
bds
|
1
ba
|
888
sqft
|
built
1955
4106 N Pasadena Ave, Indianapolis, IN 46226
$381
Cash flow
17.7%
Cash-on-Cash Return
10.4%
Cap rate
1.3%
Rent to Value Ratio
Active
$1,075,000
1
bds
|
0
ba
|
0
sqft
|
built
1920
3505 N Pennsylvania St, Indianapolis, IN 46205
$-4,715
Cash flow
-22.9%
Cash-on-Cash Return
1.0%
Cap rate
0.1%
Rent to Value Ratio

Active
$256,750
3
bds
|
2
ba
|
1,368
sqft
|
built
2016
914 Baden Manor Dr, Indianapolis, IN 46217
$-197
Cash flow
-4.0%
Cash-on-Cash Return
5.3%
Cap rate
0.7%
Rent to Value Ratio

Active
$250,000
3
bds
|
1
ba
|
1,328
sqft
|
built
1950
80 S Mickley Ave, Indianapolis, IN 46241
$-63
Cash flow
-1.3%
Cash-on-Cash Return
6.0%
Cap rate
0.7%
Rent to Value Ratio
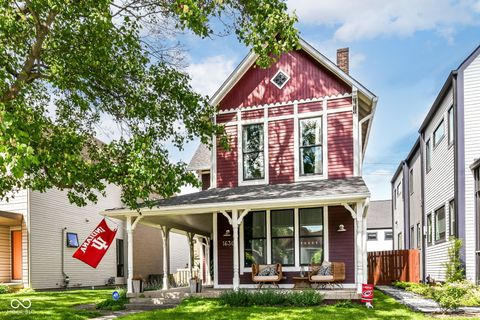
Active
$699,900
3
bds
|
3
ba
|
2,048
sqft
|
built
2010
1630 N New Jersey St, Indianapolis, IN 46202
$-1,515
Cash flow
-11.3%
Cash-on-Cash Return
3.7%
Cap rate
0.4%
Rent to Value Ratio