Indianapolis, IN Investment Properties for Sale
Browse homes for sale and investment properties in Indianapolis, IN. Refine your search by price, property type, or more.
Best cash flowing properties in Indianapolis, IN
Active
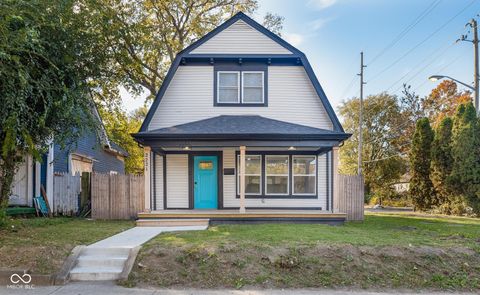
$99,900
3
bds
|
2
ba
|
1,632
sqft
|
built
1920
1354 Roache St, Indianapolis, IN 46208
$444
Cash flow
23.2%
Cash-on-Cash Return
11.6%
Cap rate
1.4%
Rent to Value Ratio
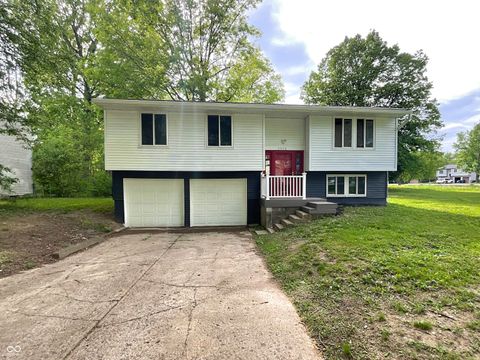
Active
$104,900
2
bds
|
1
ba
|
964
sqft
|
built
2017
2148 Singleton St, Indianapolis, IN 46203
$349
Cash flow
17.4%
Cash-on-Cash Return
10.3%
Cap rate
1.2%
Rent to Value Ratio
2,131 out of 2,287 properties for sale in Indianapolis, IN
Limited Results Shown
Create a free account, or log in to reveal all property listings and enjoy the complete experience.
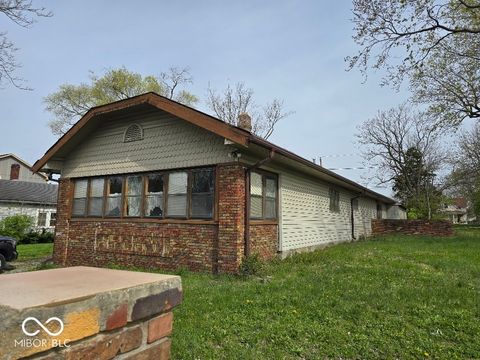
Active
$179,900
2
bds
|
3
ba
|
1,693
sqft
|
built
1920
1021 W 37th St, Indianapolis, IN 46208
$27
Cash flow
0.8%
Cash-on-Cash Return
6.4%
Cap rate
0.8%
Rent to Value Ratio
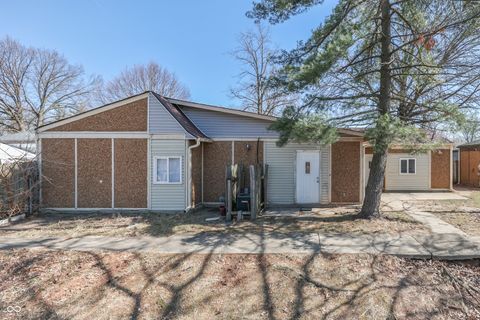
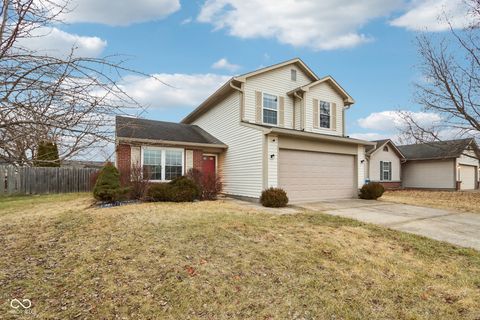
Active
$160,000
4
bds
|
2
ba
|
1,712
sqft
|
built
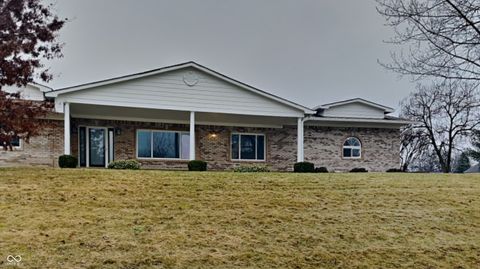
1973
3655 Yellow Poplar Ct, Indianapolis, IN 46222
$269
Cash flow
8.8%
Cash-on-Cash Return
8.3%
Cap rate
1.0%
Rent to Value Ratio
Active
$190,000
0
bds
|
0
ba
|
0
sqft
|
built
1913
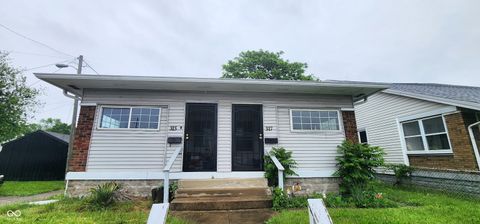
307 N Euclid Ave, Indianapolis, IN 46201
$-302
Cash flow
-8.3%
Cash-on-Cash Return
4.4%
Cap rate
0.5%
Rent to Value Ratio
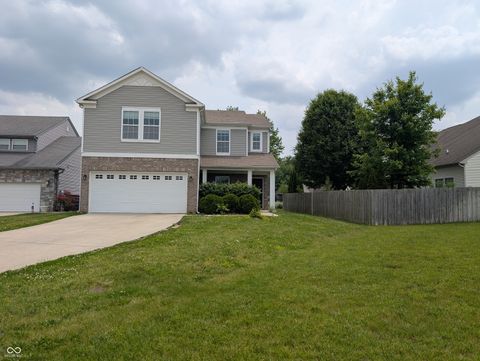
Active
$273,500
3
bds
|
2
ba
|
1,410
sqft
|
built
1999
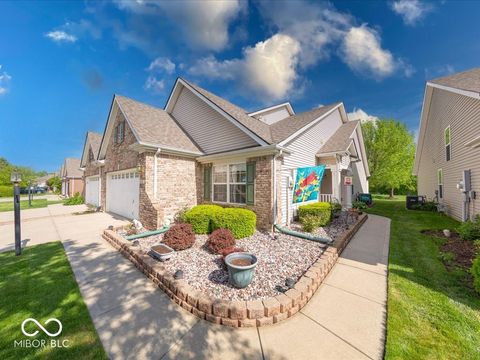
8234 Crosser Dr, Indianapolis, IN 46237
$-214
Cash flow
-4.1%
Cash-on-Cash Return
5.3%
Cap rate
0.7%
Rent to Value Ratio
Active
$180,000
2
bds
|
2
ba
|
836
sqft
|
built
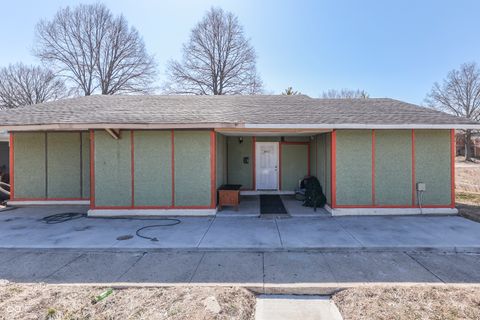
1911
1127 E Kelly St, Indianapolis, IN 46203
$164
Cash flow
4.8%
Cash-on-Cash Return
7.4%
Cap rate
0.9%
Rent to Value Ratio
Active
$225,000
3
bds
|
2
ba
|
1,656
sqft
|
built
1986
1661 S Talbott St, Indianapolis, IN 46225
$-71
Cash flow
-1.6%
Cash-on-Cash Return
5.9%
Cap rate
0.7%
Rent to Value Ratio
Active
$298,900
2
bds
|
3
ba
|
2,441
sqft
|
built
2003
6146 Franklin Villas Way, Indianapolis, IN 46237
$-280
Cash flow
-4.9%
Cash-on-Cash Return
5.1%
Cap rate
0.7%
Rent to Value Ratio

Active
$189,900
2
bds
|
2
ba
|
1,142
sqft
|
built
1988
9459 Wimbledon Ct, Indianapolis, IN 46250
$-34
Cash flow
-0.9%
Cash-on-Cash Return
6.0%
Cap rate
0.9%
Rent to Value Ratio
Active
$160,000
3
bds
|
2
ba
|
1,472
sqft
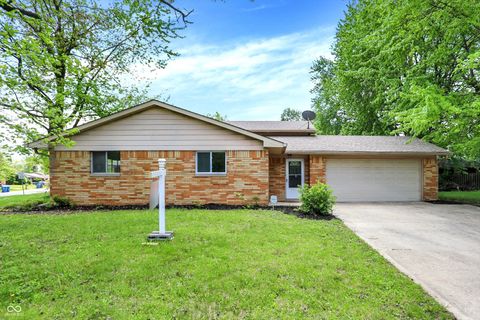
|
built
1973
3652 Yellow Poplar Ct, Indianapolis, IN 46222
$131
Cash flow
4.3%
Cash-on-Cash Return
7.2%
Cap rate
0.9%
Rent to Value Ratio
Active
$298,000
4
bds
|
3
ba
|
2,536
sqft
|
built
2004
8231 Golden Ridge Ln, Indianapolis, IN 46237
$-176
Cash flow
-3.1%
Cash-on-Cash Return
5.6%
Cap rate
0.7%
Rent to Value Ratio
Active
$549,900
3
bds
|
3
ba
|
2,109
sqft
|
built
1872
1471 N Delaware St, Indianapolis, IN 46202
$-111
Cash flow
-1.1%
Cash-on-Cash Return
6.0%
Cap rate
0.7%
Rent to Value Ratio
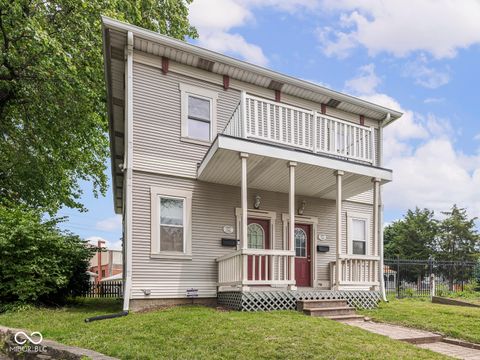
Active
$249,000
4
bds
|
4
ba
|
1,506
sqft
|
built
1907
2221 E Michigan St, Indianapolis, IN 46201
$287
Cash flow
6.0%
Cash-on-Cash Return
7.6%
Cap rate
0.9%
Rent to Value Ratio

Active
$385,000
3
bds
|
3
ba
|
1,959
sqft
|
built
1913
2936 Guilford Ave, Indianapolis, IN 46205
$-768
Cash flow
-10.4%
Cash-on-Cash Return
3.9%
Cap rate
0.5%
Rent to Value Ratio
Active
$220,000
3
bds
|
2
ba
|
1,541
sqft
|
built
1972
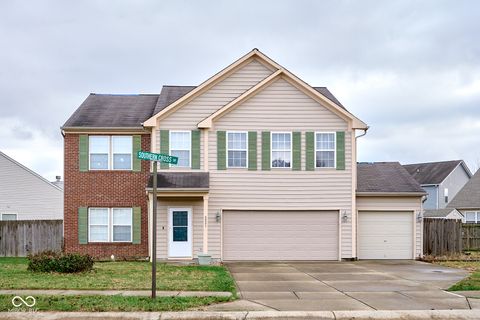
2928 Sheffield Dr, Indianapolis, IN 46229
$93
Cash flow
2.2%
Cash-on-Cash Return
6.8%
Cap rate
0.8%
Rent to Value Ratio

Active
$350,000
4
bds
|
4
ba
|
3,824
sqft
|
built
1986
8315 N Payne Rd, Indianapolis, IN 46268
$-240
Cash flow
-3.6%
Cash-on-Cash Return
5.4%
Cap rate
0.7%
Rent to Value Ratio
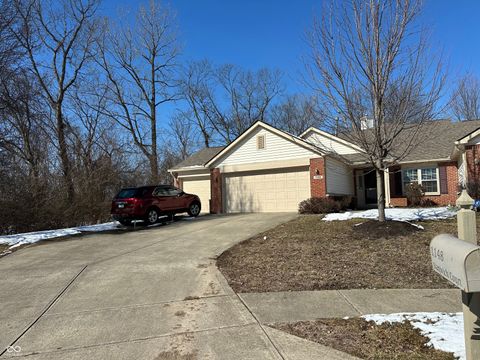
Active
$235,000
3
bds
|
3
ba
|
1,977
sqft
|
built
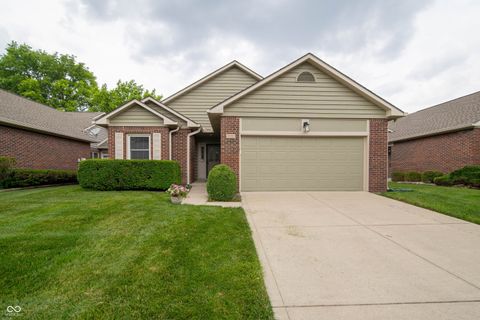
2001
1148 Nanwich Ct, Indianapolis, IN 46217
$-265
Cash flow
-5.9%
Cash-on-Cash Return
4.9%
Cap rate
0.8%
Rent to Value Ratio
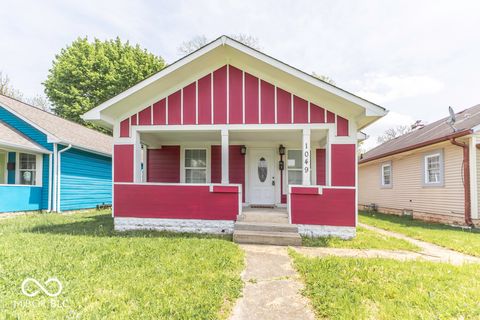
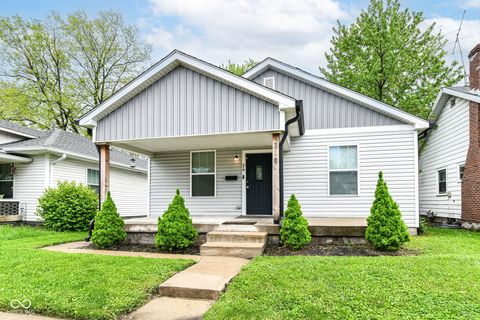
Active
$125,000
2
bds
|
1
ba
|
874
sqft
|
built
1920
1049 N Tremont St, Indianapolis, IN 46222
$313
Cash flow
13.1%
Cash-on-Cash Return
9.3%
Cap rate
1.1%
Rent to Value Ratio

Active
$324,000
2
bds
|
2
ba
|
1,946
sqft
|
built
2004
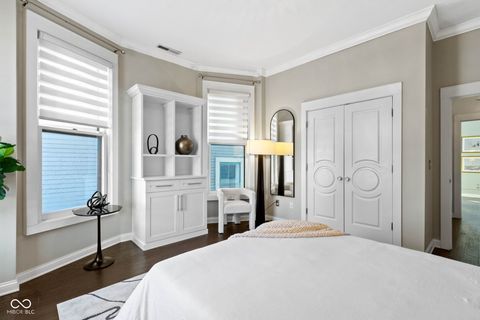
6595 Reserve Dr, Indianapolis, IN 46220
$-464
Cash flow
-7.5%
Cash-on-Cash Return
4.5%
Cap rate
0.7%
Rent to Value Ratio
Active
$389,900
3
bds
|
3
ba
|
2,781
sqft
|
built
1962
5939 Brendonridge Ct S, Indianapolis, IN 46226
$-104
Cash flow
-1.4%
Cash-on-Cash Return
5.9%
Cap rate
0.7%
Rent to Value Ratio
Active
$342,900
3
bds
|
2
ba
|
1,818
sqft
|
built
1988
5352 Steinmeier Dr N, Indianapolis, IN 46220
$-622
Cash flow
-9.5%
Cash-on-Cash Return
4.1%
Cap rate
0.6%
Rent to Value Ratio
Active
$224,999
3
bds
|
2
ba
|
2,152
sqft
|
built
1964
9157 Neptune Dr, Indianapolis, IN 46229
$205
Cash flow
4.8%
Cash-on-Cash Return
7.4%
Cap rate
0.9%
Rent to Value Ratio
Active
$215,600
4
bds
|
3
ba
|
1,494
sqft
|
built
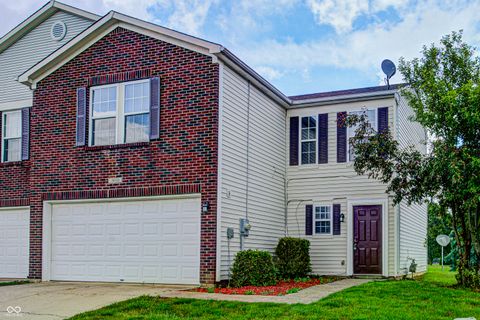
2005
8030 Cork Bend Ln, Indianapolis, IN 46239
$-72
Cash flow
-1.7%
Cash-on-Cash Return
5.9%
Cap rate
0.8%
Rent to Value Ratio
Active
$263,000
3
bds
|
3
ba
|
1,540
sqft
|
built
1996
6354 River Run Dr, Indianapolis, IN 46221
$-10
Cash flow
-0.2%
Cash-on-Cash Return
6.2%
Cap rate
0.8%
Rent to Value Ratio
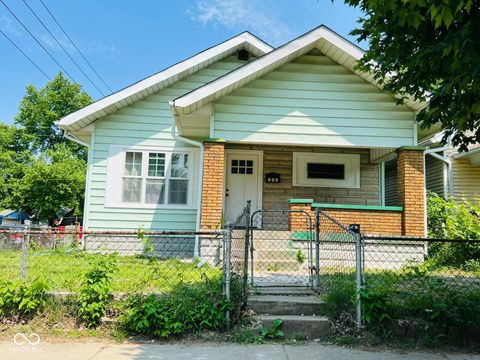
Active
$175,000
3
bds
|
1
ba
|
1,107
sqft
|
built
1915
547 N Livingston Ave, Indianapolis, IN 46222
$-86
Cash flow
-2.6%
Cash-on-Cash Return
5.7%
Cap rate
0.7%
Rent to Value Ratio
Active
$99,900
3
bds
|
2
ba
|
1,632
sqft
|
built
1920
1354 Roache St, Indianapolis, IN 46208
$444
Cash flow
23.2%
Cash-on-Cash Return
11.6%
Cap rate
1.4%
Rent to Value Ratio
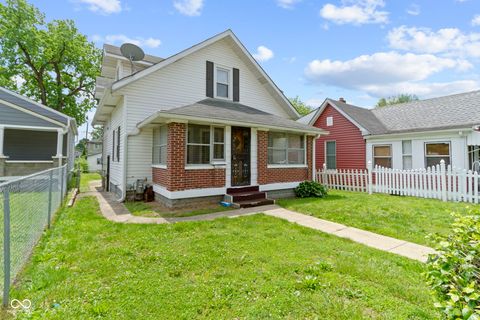
Active
$199,900
2
bds
|
1
ba
|
759
sqft
|
built
1928
1841 New St, Indianapolis, IN 46203
$60
Cash flow
1.6%
Cash-on-Cash Return
6.6%
Cap rate
0.8%
Rent to Value Ratio
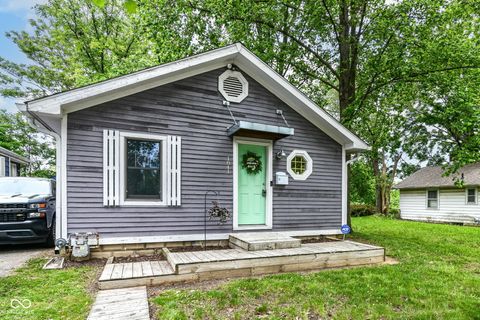
Active
$124,000
2
bds
|
1
ba
|
625
sqft
|
built
1947
2421 N Arsenal Ave, Indianapolis, IN 46218
$181
Cash flow
7.6%
Cash-on-Cash Return
8.0%
Cap rate
1.0%
Rent to Value Ratio
Active
$329,900
4
bds
|
2
ba
|
2,396
sqft
|
built
2004
8415 Fieldfare Way, Indianapolis, IN 46237
$-240
Cash flow
-3.8%
Cash-on-Cash Return
5.4%
Cap rate
0.7%
Rent to Value Ratio
Active
$245,000
3
bds
|
2
ba
|
1,690
sqft
|
built
1920
914 English Ave, Indianapolis, IN 46203
$-37
Cash flow
-0.8%
Cash-on-Cash Return
6.1%
Cap rate
0.7%
Rent to Value Ratio
Active
$420,000
5
bds
|
4
ba
|
3,720
sqft
|
built
1920
1826 N Dexter St, Indianapolis, IN 46202
$-261
Cash flow
-3.2%
Cash-on-Cash Return
5.5%
Cap rate
0.7%
Rent to Value Ratio
Active
$239,000
2
bds
|
2
ba
|
952
sqft
|
built
1930
319 S Randolph St, Indianapolis, IN 46201
$-6
Cash flow
-0.1%
Cash-on-Cash Return
6.2%
Cap rate
0.8%
Rent to Value Ratio
Active
$149,900
2
bds
|
0
ba
|
0
sqft
|
built
1950
315 S Rural St, Indianapolis, IN 46201
$-231
Cash flow
-8.0%
Cash-on-Cash Return
4.4%
Cap rate
0.5%
Rent to Value Ratio

Active
$465,000
2
bds
|
4
ba
|
2,586
sqft
|
built
2006
1529 N Alabama St, Indianapolis, IN 46202
$-837
Cash flow
-9.4%
Cash-on-Cash Return
4.1%
Cap rate
0.6%
Rent to Value Ratio
Active
$919,000
8
bds
|
5
ba
|
5,282
sqft
|
built
1964
6519 Creekside Ln, Indianapolis, IN 46220
$-2,038
Cash flow
-11.6%
Cash-on-Cash Return
3.6%
Cap rate
0.4%
Rent to Value Ratio
Active
$435,000
4
bds
|
3
ba
|
2,190
sqft
|
built
1989
12011 Glen Cove Dr, Indianapolis, IN 46236
$-159
Cash flow
-1.9%
Cash-on-Cash Return
5.8%
Cap rate
0.7%
Rent to Value Ratio
Active
$210,000
0
bds
|
0
ba
|
0
sqft
|
built
1900
1344 S Belmont Ave, Indianapolis, IN 46221
$-199
Cash flow
-4.9%
Cash-on-Cash Return
5.1%
Cap rate
0.6%
Rent to Value Ratio
Active
$120,000
2
bds
|
1
ba
|
966
sqft
|
built
1973
6458 Lupine Ter, Indianapolis, IN 46224
$-12
Cash flow
-0.5%
Cash-on-Cash Return
6.1%
Cap rate
0.9%
Rent to Value Ratio
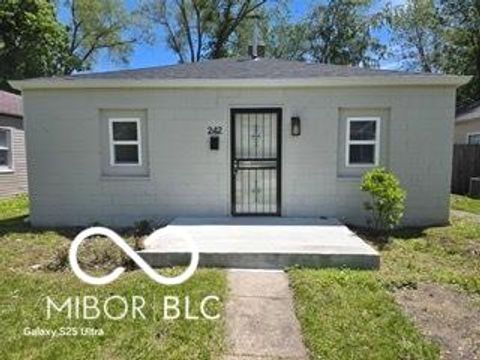
Active
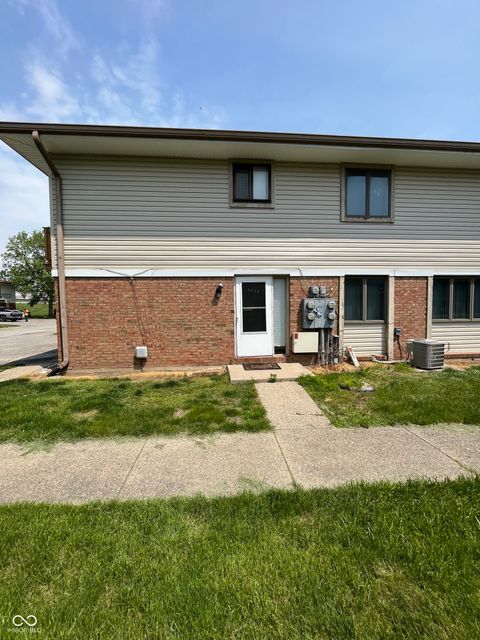
$104,900
2
bds
|
1
ba
|
964
sqft
|
built
2017
2148 Singleton St, Indianapolis, IN 46203
$349
Cash flow
17.4%
Cash-on-Cash Return
10.3%
Cap rate
1.2%
Rent to Value Ratio
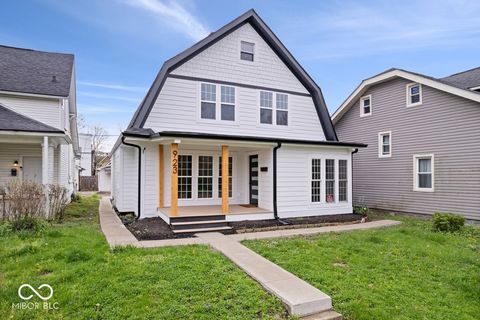
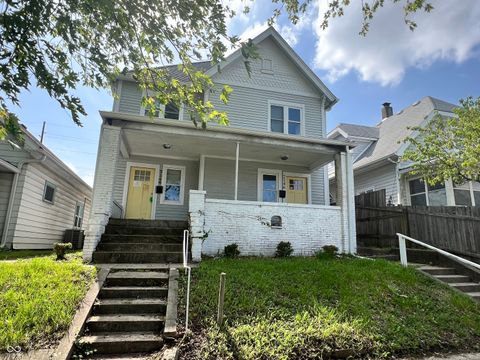
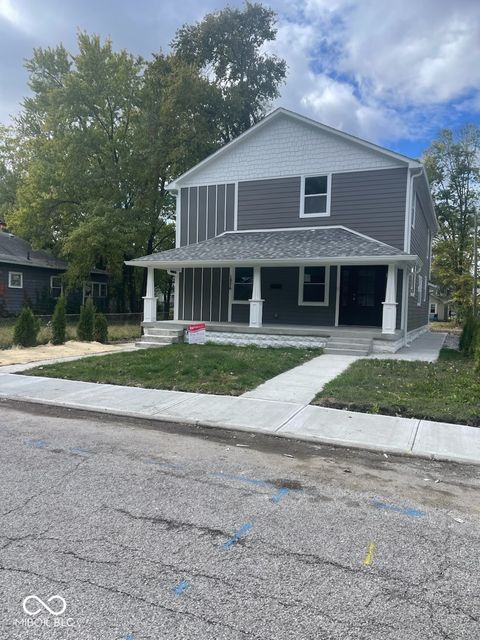
Active
$317,000
4
bds
|
3
ba
|
2,083
sqft
|
built
1915
923 E Pleasant Run Parkway South Dr, Indianapolis, IN 46203
$346
Cash flow
5.7%
Cash-on-Cash Return
7.6%
Cap rate
0.9%
Rent to Value Ratio

Active
$455,000
4
bds
|
4
ba
|
2,073
sqft
|
built
1924
3645 N Delaware St, Indianapolis, IN 46205
$-1,409
Cash flow
-16.2%
Cash-on-Cash Return
2.5%
Cap rate
0.3%
Rent to Value Ratio