Indianapolis, IN Investment Properties for Sale
Browse homes for sale and investment properties in Indianapolis, IN. Refine your search by price, property type, or more.
Best cash flowing properties in Indianapolis, IN

Active
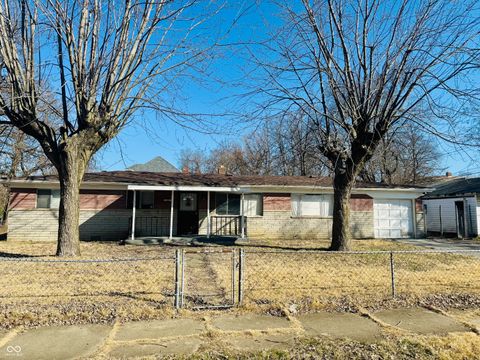
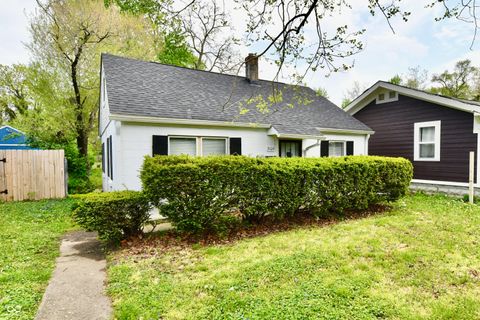
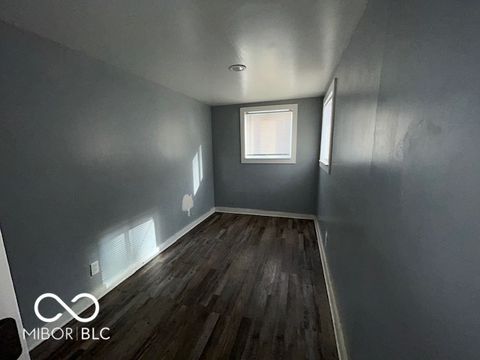
$57,800
bds
|
0
ba
|
0
sqft
|
built
1899
432 N Hamilton Ave, Indianapolis, IN 46201
$1,104
Cash flow
22.3%
Cash-on-Cash Return
22.9%
Cap rate
2.8%
Rent to Value Ratio
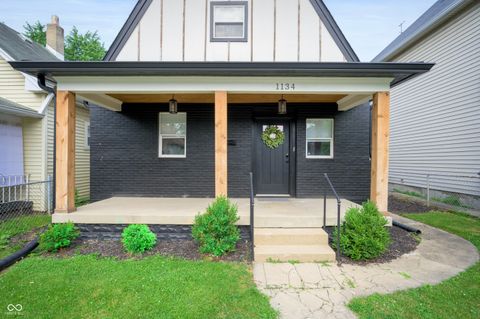
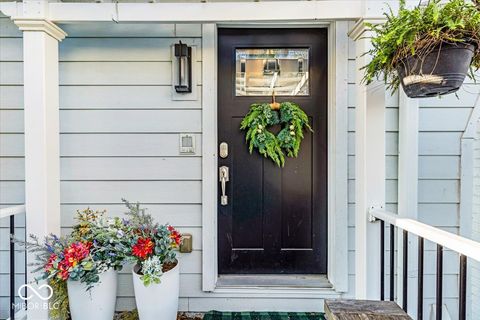
Active
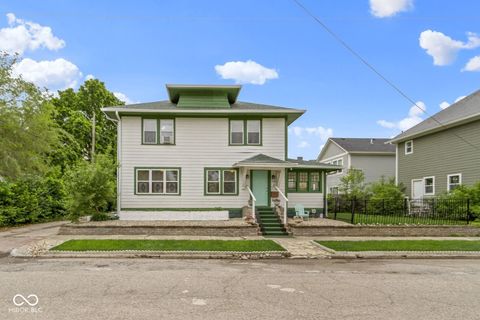
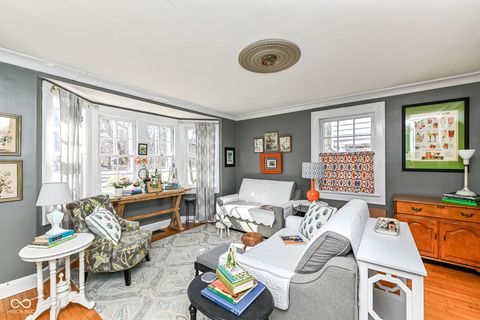
$249,000
3
bds
|
2
ba
|
1,536
sqft
|
built
1920
1134 Saint Peter St, Indianapolis, IN 46203
$425
Cash flow
8.9%
Cash-on-Cash Return
8.3%
Cap rate
1.0%
Rent to Value Ratio
2,136 out of 2,292 properties for sale in Indianapolis, IN
Limited Results Shown
Create a free account, or log in to reveal all property listings and enjoy the complete experience.
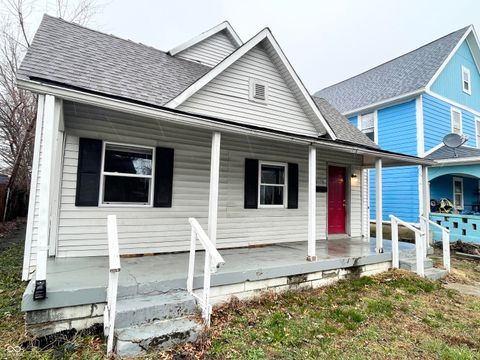
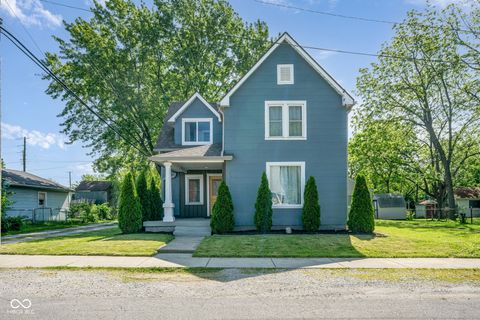
Active
$139,900
3
bds
|
1
ba
|
1,344
sqft
|
built
1920
2134 Pleasant St, Indianapolis, IN 46203
$-40
Cash flow
-1.5%
Cash-on-Cash Return
5.9%
Cap rate
0.7%
Rent to Value Ratio

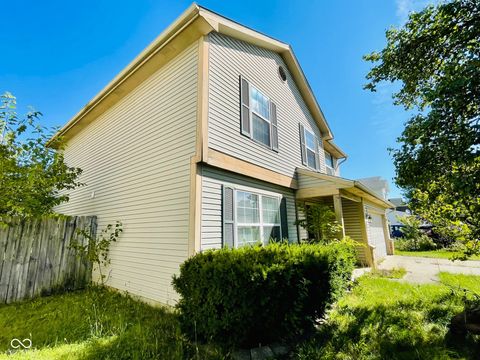
Active
$299,900
6
bds
|
2
ba
|
2,580
sqft
|
built
1959
8553 Broadway St, Indianapolis, IN 46240
$228
Cash flow
4.0%
Cash-on-Cash Return
7.2%
Cap rate
0.9%
Rent to Value Ratio

Active
$275,000
5
bds
|
3
ba
|
1,840
sqft
|
built
1935
6640 E Washington St, Indianapolis, IN 46219
$-56
Cash flow
-1.1%
Cash-on-Cash Return
6.0%
Cap rate
0.7%
Rent to Value Ratio
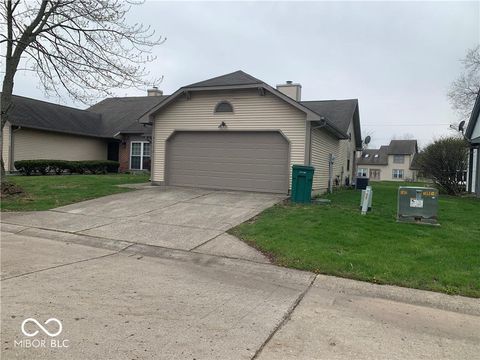
Active
$135,000
2
bds
|
2
ba
|
993
sqft
|
built
1987
4291 Village Parkway Cir W, Indianapolis, IN 46254
$-51
Cash flow
-2.0%
Cash-on-Cash Return
5.8%
Cap rate
1.0%
Rent to Value Ratio
Active
$189,900
2
bds
|
2
ba
|
1,046
sqft
|
built
1989
4112 Eagle Cove East Dr, Indianapolis, IN 46254
$-17
Cash flow
-0.5%
Cash-on-Cash Return
6.2%
Cap rate
0.9%
Rent to Value Ratio
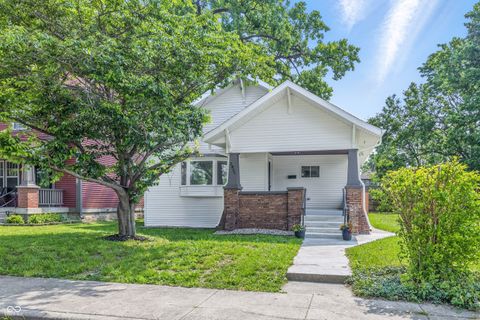
Active
$134,900
3
bds
|
2
ba
|
1,200
sqft
|
built
1961
260 W 33rd St, Indianapolis, IN 46208
$124
Cash flow
4.8%
Cash-on-Cash Return
7.4%
Cap rate
0.9%
Rent to Value Ratio
Active
$895,000
5
bds
|
3
ba
|
2,990
sqft
|
built
1932
2222 E 75th St, Indianapolis, IN 46240
$-1,913
Cash flow
-11.2%
Cash-on-Cash Return
3.7%
Cap rate
0.4%
Rent to Value Ratio
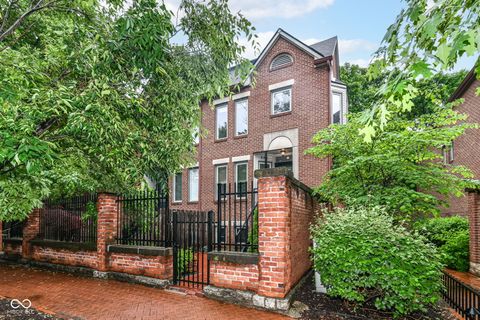
Active
$320,000
3
bds
|
3
ba
|
1,992
sqft
|
built
1915
2215 S Delaware St, Indianapolis, IN 46225
$-84
Cash flow
-1.4%
Cash-on-Cash Return
6.0%
Cap rate
0.7%
Rent to Value Ratio
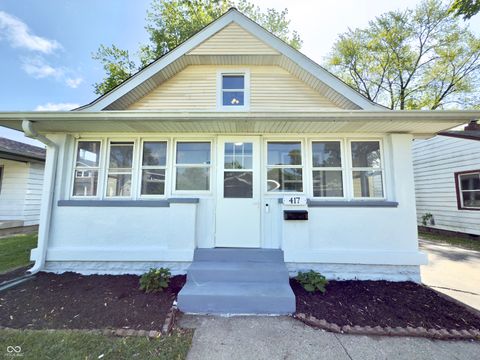
Active
$209,900
3
bds
|
2
ba
|
1,571
sqft
|
built
1930
417 S Oakland Ave, Indianapolis, IN 46201
$-337
Cash flow
-8.4%
Cash-on-Cash Return
4.3%
Cap rate
0.5%
Rent to Value Ratio

Active
$399,900
4
bds
|
3
ba
|
3,651
sqft
|
built
2016
8836 Hornady Ct, Indianapolis, IN 46239
$-185
Cash flow
-2.4%
Cash-on-Cash Return
5.7%
Cap rate
0.7%
Rent to Value Ratio
Active
$380,000
4
bds
|
3
ba
|
2,995
sqft
|
built
2019
4032 Stubbington Ln, Indianapolis, IN 46239
$-106
Cash flow
-1.5%
Cash-on-Cash Return
5.9%
Cap rate
0.7%
Rent to Value Ratio

Active
$775,000
5
bds
|
4
ba
|
4,036
sqft
|
built
1992
8845 Otter Cove Cir, Indianapolis, IN 46236
$-1,328
Cash flow
-8.9%
Cash-on-Cash Return
4.2%
Cap rate
0.5%
Rent to Value Ratio
Active
$394,000
3
bds
|
2
ba
|
1,722
sqft
|
built
1940
5938 Haverford Ave, Indianapolis, IN 46220
$-332
Cash flow
-4.4%
Cash-on-Cash Return
5.3%
Cap rate
0.6%
Rent to Value Ratio
Active
$288,000
3
bds
|
2
ba
|
1,318
sqft
|
built
2005
45 Golden Tree Ln, Indianapolis, IN 46227
$-286
Cash flow
-5.2%
Cash-on-Cash Return
5.1%
Cap rate
0.6%
Rent to Value Ratio
Active
$249,500
4
bds
|
2
ba
|
1,788
sqft
|
built
1976
7402 Broadview Dr, Indianapolis, IN 46227
$-61
Cash flow
-1.3%
Cash-on-Cash Return
6.0%
Cap rate
0.7%
Rent to Value Ratio
Active
$159,900
4
bds
|
2
ba
|
1,250
sqft
|
built
1955
3817 N Sheridan Ave, Indianapolis, IN 46226
$269
Cash flow
8.8%
Cash-on-Cash Return
8.3%
Cap rate
1.0%
Rent to Value Ratio

Active
$119,900
2
bds
|
2
ba
|
1,216
sqft
|
built
1966
7443 Country Brook Dr, Indianapolis, IN 46260
$110
Cash flow
4.8%
Cash-on-Cash Return
7.4%
Cap rate
1.3%
Rent to Value Ratio
Active
$340,000
3
bds
|
3
ba
|
2,948
sqft
|
built
1952
3805 Byram Ave, Indianapolis, IN 46208
$157
Cash flow
2.4%
Cash-on-Cash Return
6.8%
Cap rate
0.8%
Rent to Value Ratio
Active
$230,000
3
bds
|
3
ba
|
1,600
sqft
|
built
2006
4136 Orchard Valley Ln, Indianapolis, IN 46235
$16
Cash flow
0.4%
Cash-on-Cash Return
6.3%
Cap rate
0.8%
Rent to Value Ratio
Active
$285,000
4
bds
|
3
ba
|
2,360
sqft
|
built
2000
6213 Selago Dr, Indianapolis, IN 46203
$-277
Cash flow
-5.1%
Cash-on-Cash Return
5.1%
Cap rate
0.6%
Rent to Value Ratio
Active
$57,800
bds
|
0
ba
|
0
sqft
|
built
1899
432 N Hamilton Ave, Indianapolis, IN 46201
$1,104
Cash flow
22.3%
Cash-on-Cash Return
22.9%
Cap rate
2.8%
Rent to Value Ratio

Active
$180,000
3
bds
|
2
ba
|
1,856
sqft
|
built
1955
1921 W Michigan St, Indianapolis, IN 46222
$-457
Cash flow
-13.2%
Cash-on-Cash Return
3.2%
Cap rate
0.4%
Rent to Value Ratio

Active
$349,400
2
bds
|
2
ba
|
1,240
sqft
|
built
1910
430 N Park Ave, Indianapolis, IN 46202
$-755
Cash flow
-11.3%
Cash-on-Cash Return
3.7%
Cap rate
0.7%
Rent to Value Ratio

Active
$469,000
3
bds
|
2
ba
|
1,890
sqft
|
built
2019
6611 Ventnor Pl, Indianapolis, IN 46217
$-759
Cash flow
-8.4%
Cash-on-Cash Return
4.3%
Cap rate
0.5%
Rent to Value Ratio

Active
$290,000
3
bds
|
3
ba
|
2,030
sqft
|
built
2005
2887 Ludwig Dr, Indianapolis, IN 46239
$-171
Cash flow
-3.1%
Cash-on-Cash Return
5.6%
Cap rate
0.7%
Rent to Value Ratio
Active
$134,000
2
bds
|
1
ba
|
750
sqft
|
built
1947
3109 Forest Manor Ave, Indianapolis, IN 46218
$-10
Cash flow
-0.4%
Cash-on-Cash Return
6.2%
Cap rate
0.7%
Rent to Value Ratio

Active
$284,900
3
bds
|
2
ba
|
1,557
sqft
|
built
2019
11815 Adair Pl, Indianapolis, IN 46229
$-140
Cash flow
-2.6%
Cash-on-Cash Return
5.7%
Cap rate
0.7%
Rent to Value Ratio
Active
$120,000
3
bds
|
3
ba
|
1,664
sqft
|
built
1930
1459 W 33rd St, Indianapolis, IN 46208
$409
Cash flow
17.8%
Cash-on-Cash Return
10.4%
Cap rate
1.3%
Rent to Value Ratio
Active
$265,000
3
bds
|
2
ba
|
1,600
sqft
|
built
1920
236 W 33rd St, Indianapolis, IN 46208
$-555
Cash flow
-10.9%
Cash-on-Cash Return
3.7%
Cap rate
0.5%
Rent to Value Ratio

Active
$295,900
4
bds
|
3
ba
|
2,666
sqft
|
built
1962
5549 Hollister Dr, Indianapolis, IN 46224
$-165
Cash flow
-2.9%
Cash-on-Cash Return
5.6%
Cap rate
0.7%
Rent to Value Ratio

Active
$330,000
4
bds
|
3
ba
|
1,944
sqft
|
built
1973
1102 Fox Hill Dr, Indianapolis, IN 46228
$-136
Cash flow
-2.2%
Cash-on-Cash Return
5.8%
Cap rate
0.7%
Rent to Value Ratio

Active
$199,900
3
bds
|
3
ba
|
1,721
sqft
|
built
2005
7218 Forrester Ln, Indianapolis, IN 46217
$-131
Cash flow
-3.4%
Cash-on-Cash Return
5.5%
Cap rate
0.9%
Rent to Value Ratio
Active
$395,000
3
bds
|
3
ba
|
2,128
sqft
|
built
1925
5718 E Pleasant Run Parkway North Dr, Indianapolis, IN 46219
$-544
Cash flow
-7.2%
Cash-on-Cash Return
4.6%
Cap rate
0.6%
Rent to Value Ratio

Active
$115,000
3
bds
|
2
ba
|
1,078
sqft
|
built
1925
3109 E Saint Joseph St, Indianapolis, IN 46201
$159
Cash flow
7.2%
Cash-on-Cash Return
7.9%
Cap rate
1.0%
Rent to Value Ratio
Active
$260,000
4
bds
|
3
ba
|
1,966
sqft
|
built
1998
4322 Par Dr, Indianapolis, IN 46268
$-115
Cash flow
-2.3%
Cash-on-Cash Return
5.7%
Cap rate
0.7%
Rent to Value Ratio
Active
$249,000
3
bds
|
2
ba
|
1,536
sqft
|
built
1920
1134 Saint Peter St, Indianapolis, IN 46203
$425
Cash flow
8.9%
Cash-on-Cash Return
8.3%
Cap rate
1.0%
Rent to Value Ratio

Active
$525,000
3
bds
|
3
ba
|
2,472
sqft
|
built
2002
6760 Spirit Lake Dr, Indianapolis, IN 46220
$-1,580
Cash flow
-15.7%
Cash-on-Cash Return
2.7%
Cap rate
0.6%
Rent to Value Ratio
Active
$420,000
3
bds
|
3
ba
|
1,938
sqft
|
built
1984
558 E Vermont St, Indianapolis, IN 46202
$-314
Cash flow
-3.9%
Cash-on-Cash Return
5.4%
Cap rate
0.7%
Rent to Value Ratio

Active
$75,121
2
bds
|
1
ba
|
498
sqft
|
built
1910
226 Miley Ave, Indianapolis, IN 46222
$229
Cash flow
15.9%
Cash-on-Cash Return
9.9%
Cap rate
1.2%
Rent to Value Ratio
Active
$325,000
3
bds
|
2
ba
|
1,710
sqft
|
built
1948
2831 N Talbott St, Indianapolis, IN 46205
$-731
Cash flow
-11.7%
Cash-on-Cash Return
3.6%
Cap rate
0.4%
Rent to Value Ratio