Indianapolis, IN Investment Properties for Sale
Browse homes for sale and investment properties in Indianapolis, IN. Refine your search by price, property type, or more.
Best cash flowing properties in Indianapolis, IN
Active
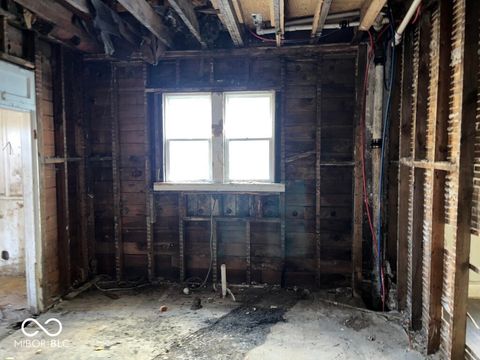
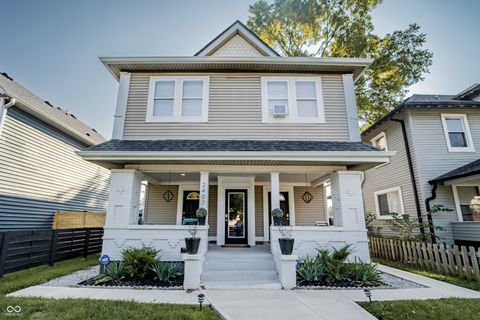
$89,900
3
bds
|
1
ba
|
1,736
sqft
|
built
1920
1210 N Rural St, Indianapolis, IN 46201
$359
Cash flow
20.8%
Cash-on-Cash Return
11.1%
Cap rate
1.3%
Rent to Value Ratio
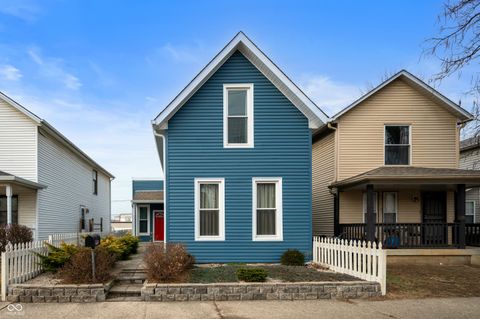
Active
$230,000
2
bds
|
2
ba
|
1,352
sqft
|
built
1895
1130 S Senate Ave, Indianapolis, IN 46225
$179
Cash flow
4.1%
Cash-on-Cash Return
7.2%
Cap rate
0.9%
Rent to Value Ratio
1,953 out of 2,093 properties for sale in Indianapolis, IN
Limited Results Shown
Create a free account, or log in to reveal all property listings and enjoy the complete experience.

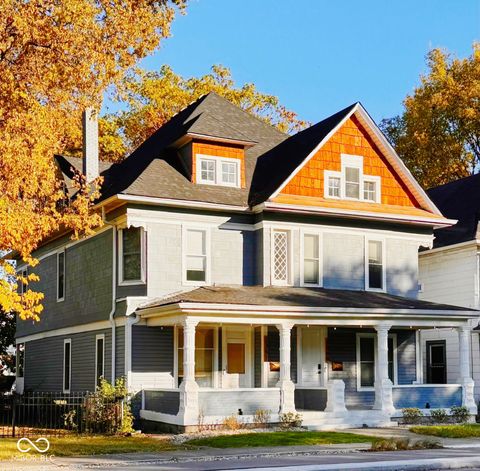
Active
$525,000
3
bds
|
3
ba
|
2,064
sqft
|
built
1900
1156 Spruce St, Indianapolis, IN 46203
$-947
Cash flow
-9.4%
Cash-on-Cash Return
4.1%
Cap rate
0.5%
Rent to Value Ratio
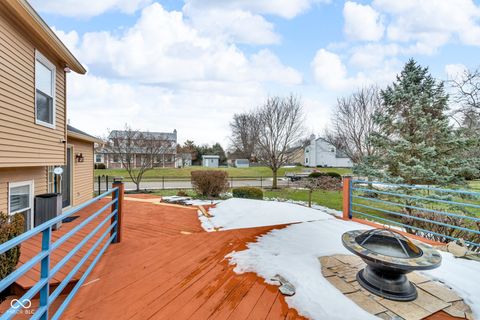
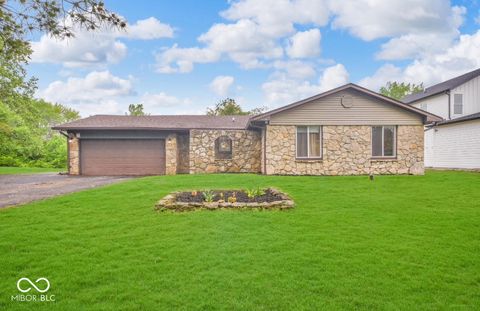
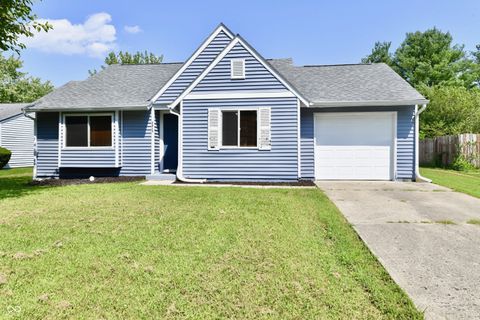
Active
$360,000
3
bds
|
3
ba
|
2,660
sqft
|
built
1992
4549 Pepper Ct, Indianapolis, IN 46237
$-188
Cash flow
-2.7%
Cash-on-Cash Return
5.6%
Cap rate
0.7%
Rent to Value Ratio
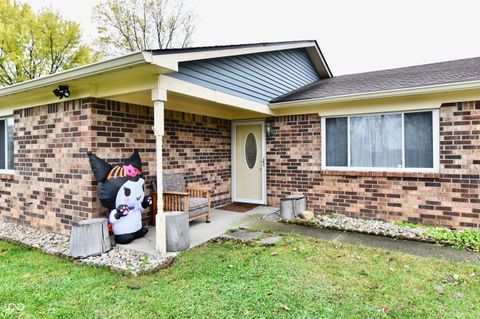
Active
$230,000
3
bds
|
2
ba
|
1,176
sqft
|
built
1975
7922 S Sherman Dr, Indianapolis, IN 46237
$-28
Cash flow
-0.6%
Cash-on-Cash Return
6.1%
Cap rate
0.7%
Rent to Value Ratio

Active
$1,795,000
4
bds
|
4
ba
|
5,207
sqft
|
built
2002
6560 Dawson Lake Dr, Indianapolis, IN 46220
$-4,155
Cash flow
-12.1%
Cash-on-Cash Return
3.5%
Cap rate
0.4%
Rent to Value Ratio

Active
$329,900
4
bds
|
3
ba
|
2,509
sqft
|
built
2013
8404 Alcona Dr, Indianapolis, IN 46237
$-240
Cash flow
-3.8%
Cash-on-Cash Return
5.4%
Cap rate
0.7%
Rent to Value Ratio
Active
$230,000
2
bds
|
2
ba
|
1,352
sqft
|
built
1895
1130 S Senate Ave, Indianapolis, IN 46225
$179
Cash flow
4.1%
Cash-on-Cash Return
7.2%
Cap rate
0.9%
Rent to Value Ratio

Active
$519,900
2
bds
|
3
ba
|
1,681
sqft
|
built
2008
355 E Ohio St, Indianapolis, IN 46204
$-1,368
Cash flow
-13.7%
Cash-on-Cash Return
3.1%
Cap rate
0.5%
Rent to Value Ratio

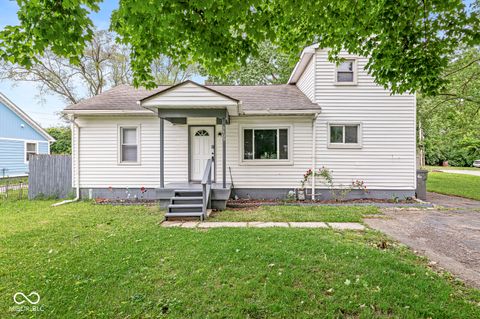
Active
$234,900
4
bds
|
2
ba
|
1,066
sqft
|
built
1911
424 S Parker Ave, Indianapolis, IN 46201
$-467
Cash flow
-10.4%
Cash-on-Cash Return
3.9%
Cap rate
0.5%
Rent to Value Ratio

Active
$349,900
1
bds
|
2
ba
|
1,162
sqft
|
built
1922
630 N College Ave, Indianapolis, IN 46204
$-682
Cash flow
-10.2%
Cash-on-Cash Return
3.9%
Cap rate
0.7%
Rent to Value Ratio

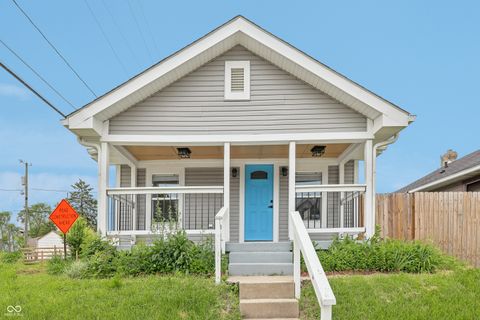
Active
$349,999
4
bds
|
4
ba
|
1,951
sqft
|
built
1910
625 N Parker Ave, Indianapolis, IN 46201
$-1,137
Cash flow
-16.9%
Cash-on-Cash Return
2.4%
Cap rate
0.3%
Rent to Value Ratio

Active
$765,000
4
bds
|
4
ba
|
3,938
sqft
|
built
1989
11319 Shoreview Ln, Indianapolis, IN 46236
$-1,293
Cash flow
-8.8%
Cash-on-Cash Return
4.2%
Cap rate
0.6%
Rent to Value Ratio

Pending
$475,000
3
bds
|
3
ba
|
2,260
sqft
|
built
2016
1453 English Ave, Indianapolis, IN 46201
$-755
Cash flow
-8.3%
Cash-on-Cash Return
4.4%
Cap rate
0.5%
Rent to Value Ratio

Active
$450,000
2
bds
|
2
ba
|
2,285
sqft
|
built
2005
141 S Meridian St, Indianapolis, IN 46225
$-889
Cash flow
-10.3%
Cash-on-Cash Return
3.9%
Cap rate
0.7%
Rent to Value Ratio

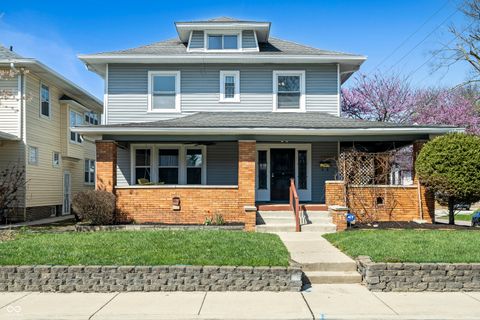
Active
$260,000
3
bds
|
0
ba
|
0
sqft
|
built
1890
1808 E Washington St, Indianapolis, IN 46201
$-529
Cash flow
-10.6%
Cash-on-Cash Return
3.8%
Cap rate
0.5%
Rent to Value Ratio
Active
$750,000
4
bds
|
0
ba
|
0
sqft
|
built
1914
2407 N Capitol Ave, Indianapolis, IN 46208
$-2,329
Cash flow
-16.2%
Cash-on-Cash Return
2.5%
Cap rate
0.3%
Rent to Value Ratio

Active
$685,000
5
bds
|
5
ba
|
5,851
sqft
|
built
1989
2308 Galahad Dr, Indianapolis, IN 46228
$-747
Cash flow
-5.7%
Cash-on-Cash Return
5.0%
Cap rate
0.6%
Rent to Value Ratio

Active
$465,000
6
bds
|
0
ba
|
0
sqft
|
built
1917
1315 Union St, Indianapolis, IN 46225
$-1,324
Cash flow
-14.9%
Cash-on-Cash Return
2.8%
Cap rate
0.3%
Rent to Value Ratio

Active
$309,900
3
bds
|
4
ba
|
1,960
sqft
|
built
1930
213 S State Ave, Indianapolis, IN 46201
$-859
Cash flow
-14.5%
Cash-on-Cash Return
2.9%
Cap rate
0.4%
Rent to Value Ratio

Active
$294,900
2
bds
|
2
ba
|
1,219
sqft
|
built
2002
450 E Ohio St, Indianapolis, IN 46204
$-525
Cash flow
-9.3%
Cash-on-Cash Return
4.1%
Cap rate
0.7%
Rent to Value Ratio

Pending
$329,900
4
bds
|
3
ba
|
2,144
sqft
|
built
1923
1321 Union St, Indianapolis, IN 46225
$-756
Cash flow
-12.0%
Cash-on-Cash Return
3.5%
Cap rate
0.4%
Rent to Value Ratio

Active
$600,000
4
bds
|
2
ba
|
1,600
sqft
|
built
1925
507 W 29th St, Indianapolis, IN 46208
$-2,373
Cash flow
-20.6%
Cash-on-Cash Return
1.5%
Cap rate
0.2%
Rent to Value Ratio

Active
$545,000
2
bds
|
0
ba
|
0
sqft
|
built
1910
3739 E Market St, Indianapolis, IN 46201
$-2,224
Cash flow
-21.3%
Cash-on-Cash Return
1.4%
Cap rate
0.2%
Rent to Value Ratio
Active
$215,000
3
bds
|
2
ba
|
1,104
sqft
|
built
1971
1809 N Harding St, Indianapolis, IN 46202
$-87
Cash flow
-2.1%
Cash-on-Cash Return
5.8%
Cap rate
0.7%
Rent to Value Ratio
Active
$259,900
3
bds
|
2
ba
|
1,336
sqft
|
built
1979
8102 Sycamore Springs Trl, Indianapolis, IN 46239
$-115
Cash flow
-2.3%
Cash-on-Cash Return
5.7%
Cap rate
0.7%
Rent to Value Ratio
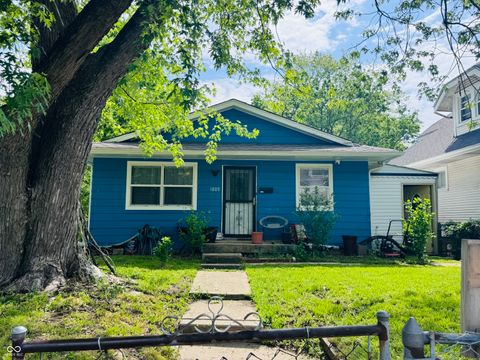
Active
$89,900
3
bds
|
1
ba
|
1,736
sqft
|
built
1920
1210 N Rural St, Indianapolis, IN 46201
$359
Cash flow
20.8%
Cash-on-Cash Return
11.1%
Cap rate
1.3%
Rent to Value Ratio
Active
$550,000
0
bds
|
0
ba
|
0
sqft
|
built
1914
2349 N Capitol Ave, Indianapolis, IN 46208
$-1,353
Cash flow
-12.8%
Cash-on-Cash Return
3.3%
Cap rate
0.4%
Rent to Value Ratio
Active
$205,000
3
bds
|
2
ba
|
1,210
sqft
|
built
1987
2813 Grassy Creek Dr, Indianapolis, IN 46229
$103
Cash flow
2.6%
Cash-on-Cash Return
6.9%
Cap rate
0.8%
Rent to Value Ratio
Active
$190,000
4
bds
|
2
ba
|
1,464
sqft
|
built
1951
3409 S Rural St, Indianapolis, IN 46237
$112
Cash flow
3.1%
Cash-on-Cash Return
7.0%
Cap rate
0.8%
Rent to Value Ratio
Active
$234,999
2
bds
|
1
ba
|
942
sqft
|
built
1940
301 Leeds Ave, Indianapolis, IN 46201
$-606
Cash flow
-13.5%
Cash-on-Cash Return
3.2%
Cap rate
0.4%
Rent to Value Ratio

Active
$315,000
3
bds
|
2
ba
|
1,744
sqft
|
built
1951
6204 Madison Ave, Indianapolis, IN 46227
$-472
Cash flow
-7.8%
Cash-on-Cash Return
4.5%
Cap rate
0.5%
Rent to Value Ratio

Active
$225,000
3
bds
|
2
ba
|
1,470
sqft
|
built
1962
2017 Schwier Ct, Indianapolis, IN 46229
$-71
Cash flow
-1.6%
Cash-on-Cash Return
5.9%
Cap rate
0.7%
Rent to Value Ratio

Active
$179,900
3
bds
|
2
ba
|
1,050
sqft
|
built
1957
267 S Grant Ave, Indianapolis, IN 46201
$27
Cash flow
0.8%
Cash-on-Cash Return
6.4%
Cap rate
0.8%
Rent to Value Ratio

Active
$215,000
2
bds
|
1
ba
|
1,000
sqft
|
built
1920
2035 S Pennsylvania St, Indianapolis, IN 46225
$-156
Cash flow
-3.8%
Cash-on-Cash Return
5.4%
Cap rate
0.7%
Rent to Value Ratio

Active
$649,900
3
bds
|
3
ba
|
2,869
sqft
|
built
1954
5543 N Pennsylvania St, Indianapolis, IN 46220
$-1,668
Cash flow
-13.4%
Cash-on-Cash Return
3.2%
Cap rate
0.4%
Rent to Value Ratio

Active
$349,900
4
bds
|
8
ba
|
2,688
sqft
|
built
1997
10629 Simsbury Ct, Indianapolis, IN 46236
$-373
Cash flow
-5.6%
Cash-on-Cash Return
5.0%
Cap rate
0.6%
Rent to Value Ratio

Active
$300,000
3
bds
|
1
ba
|
1,152
sqft
|
built
1994
2612 E Northgate St, Indianapolis, IN 46220
$-186
Cash flow
-3.2%
Cash-on-Cash Return
5.5%
Cap rate
0.7%
Rent to Value Ratio

Active
$275,000
2
bds
|
1
ba
|
885
sqft
|
built
1920
4345 Guilford Ave, Indianapolis, IN 46205
$-56
Cash flow
-1.1%
Cash-on-Cash Return
6.0%
Cap rate
0.7%
Rent to Value Ratio

Active
$224,900
2
bds
|
2
ba
|
1,008
sqft
|
built
1915
2909 E Michigan St, Indianapolis, IN 46201
$-484
Cash flow
-11.2%
Cash-on-Cash Return
3.7%
Cap rate
0.4%
Rent to Value Ratio

Active
$190,000
3
bds
|
1
ba
|
1,002
sqft
|
built
1940
1331 N Berwick Ave, Indianapolis, IN 46222
$-26
Cash flow
-0.7%
Cash-on-Cash Return
6.1%
Cap rate
0.7%
Rent to Value Ratio
Active
$355,000
5
bds
|
4
ba
|
3,078
sqft
|
built
1925
3970 Broadway St, Indianapolis, IN 46205
$-335
Cash flow
-4.9%
Cash-on-Cash Return
5.1%
Cap rate
0.6%
Rent to Value Ratio