Indianapolis, IN Investment Properties for Sale
Browse homes for sale and investment properties in Indianapolis, IN. Refine your search by price, property type, or more.
Best cash flowing properties in Indianapolis, IN
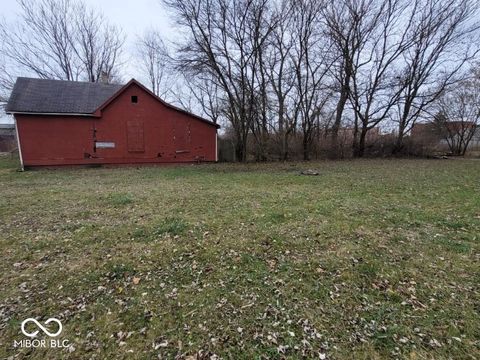
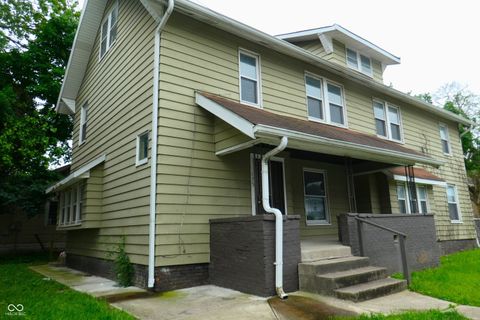
Active
$85,000
2
bds
|
1
ba
|
960
sqft
|
built
1955
1724 Sheldon St, Indianapolis, IN 46218
$384
Cash flow
23.6%
Cash-on-Cash Return
11.7%
Cap rate
1.4%
Rent to Value Ratio

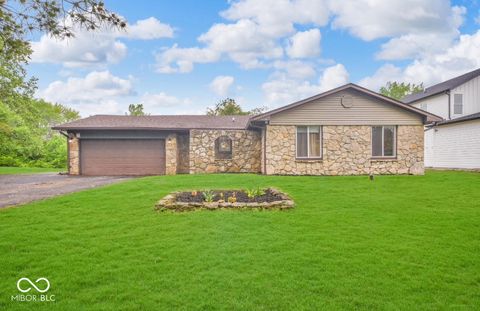
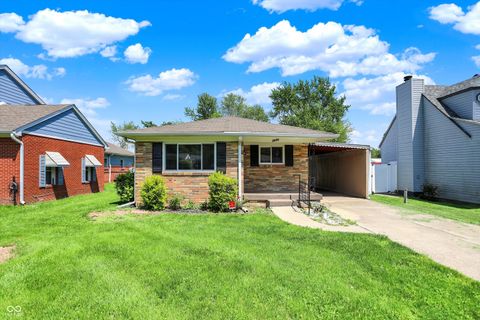
Active
$119,000
2
bds
|
1
ba
|
979
sqft
|
built
1948
3954 Fletcher Ave, Indianapolis, IN 46203
$207
Cash flow
9.1%
Cash-on-Cash Return
8.3%
Cap rate
1.0%
Rent to Value Ratio
2,131 out of 2,287 properties for sale in Indianapolis, IN
Limited Results Shown
Create a free account, or log in to reveal all property listings and enjoy the complete experience.
Active
$259,900
3
bds
|
2
ba
|
1,336
sqft
|
built
1979
8102 Sycamore Springs Trl, Indianapolis, IN 46239
$-115
Cash flow
-2.3%
Cash-on-Cash Return
5.7%
Cap rate
0.7%
Rent to Value Ratio

Active
$349,900
1
bds
|
2
ba
|
1,162
sqft
|
built
1922
630 N College Ave, Indianapolis, IN 46204
$-682
Cash flow
-10.2%
Cash-on-Cash Return
3.9%
Cap rate
0.7%
Rent to Value Ratio

Active
$519,900
2
bds
|
3
ba
|
1,681
sqft
|
built
2008
355 E Ohio St, Indianapolis, IN 46204
$-1,368
Cash flow
-13.7%
Cash-on-Cash Return
3.1%
Cap rate
0.5%
Rent to Value Ratio

Active
$213,000
1
bds
|
1
ba
|
815
sqft
|
built
2008
233 E Saint Joseph St, Indianapolis, IN 46202
$-529
Cash flow
-13.0%
Cash-on-Cash Return
3.3%
Cap rate
0.7%
Rent to Value Ratio
Active
$289,900
4
bds
|
2
ba
|
1,836
sqft
|
built
1941
155 N Franklin Rd, Indianapolis, IN 46219
$-271
Cash flow
-4.9%
Cash-on-Cash Return
5.1%
Cap rate
0.6%
Rent to Value Ratio

Active
$389,990
4
bds
|
3
ba
|
2,380
sqft
|
built
1920
3535 Birchwood Ave, Indianapolis, IN 46205
$-104
Cash flow
-1.4%
Cash-on-Cash Return
5.9%
Cap rate
0.7%
Rent to Value Ratio

Active
$294,900
2
bds
|
2
ba
|
1,219
sqft
|
built
2002
450 E Ohio St, Indianapolis, IN 46204
$-525
Cash flow
-9.3%
Cash-on-Cash Return
4.1%
Cap rate
0.7%
Rent to Value Ratio

Active
$230,500
2
bds
|
3
ba
|
1,357
sqft
|
built
1989
4059 Eagle Cove West Dr, Indianapolis, IN 46254
$-238
Cash flow
-5.4%
Cash-on-Cash Return
5.0%
Cap rate
0.7%
Rent to Value Ratio

Active
$327,000
3
bds
|
3
ba
|
1,808
sqft
|
built
2019
158 Handley St, Indianapolis, IN 46222
$-157
Cash flow
-2.5%
Cash-on-Cash Return
5.7%
Cap rate
0.7%
Rent to Value Ratio
Active
$149,900
2
bds
|
2
ba
|
1,482
sqft
|
built
1974
1632 Wellesley Ct, Indianapolis, IN 46219
$-127
Cash flow
-4.4%
Cash-on-Cash Return
5.3%
Cap rate
0.9%
Rent to Value Ratio

Active
$125,000
2
bds
|
1
ba
|
984
sqft
|
built
1983
2931 Eagles Crest Cir, Indianapolis, IN 46214
$88
Cash flow
3.7%
Cash-on-Cash Return
7.1%
Cap rate
1.1%
Rent to Value Ratio

Active
$309,000
3
bds
|
2
ba
|
2,324
sqft
|
built
2017
8737 Twain Ln, Indianapolis, IN 46239
$-116
Cash flow
-2.0%
Cash-on-Cash Return
5.8%
Cap rate
0.7%
Rent to Value Ratio

Active
$333,000
5
bds
|
2
ba
|
3,170
sqft
|
built
1935
1702 Barth Ave, Indianapolis, IN 46203
$-359
Cash flow
-5.6%
Cash-on-Cash Return
5.0%
Cap rate
0.6%
Rent to Value Ratio

Active
$209,900
2
bds
|
1
ba
|
792
sqft
|
built
1910
1613 E Ohio St, Indianapolis, IN 46201
$77
Cash flow
1.9%
Cash-on-Cash Return
6.7%
Cap rate
0.8%
Rent to Value Ratio
Active
$575,000
3
bds
|
3
ba
|
2,875
sqft
|
built
1949
7525 N Meridian St, Indianapolis, IN 46260
$-587
Cash flow
-5.3%
Cash-on-Cash Return
5.0%
Cap rate
0.6%
Rent to Value Ratio

Active
$209,500
3
bds
|
2
ba
|
1,460
sqft
|
built
1952
5757 E 21st St, Indianapolis, IN 46218
$-266
Cash flow
-6.6%
Cash-on-Cash Return
4.7%
Cap rate
0.6%
Rent to Value Ratio

Active
$525,000
3
bds
|
3
ba
|
2,064
sqft
|
built
1900
1156 Spruce St, Indianapolis, IN 46203
$-947
Cash flow
-9.4%
Cash-on-Cash Return
4.1%
Cap rate
0.5%
Rent to Value Ratio
Active
$299,900
3
bds
|
3
ba
|
2,024
sqft
|
built
1910
1205 N Oxford St, Indianapolis, IN 46201
$159
Cash flow
2.8%
Cash-on-Cash Return
6.9%
Cap rate
0.8%
Rent to Value Ratio
Active
$205,000
2
bds
|
2
ba
|
960
sqft
|
built
1910
1101 Roache St, Indianapolis, IN 46208
$34
Cash flow
0.9%
Cash-on-Cash Return
6.5%
Cap rate
0.8%
Rent to Value Ratio

Active
$233,000
3
bds
|
2
ba
|
1,944
sqft
|
built
1956
907 Monroe St, Indianapolis, IN 46229
$164
Cash flow
3.7%
Cash-on-Cash Return
7.1%
Cap rate
0.9%
Rent to Value Ratio
Active
$125,000
3
bds
|
1
ba
|
1,140
sqft
|
built
1953
3536 N Audubon Rd, Indianapolis, IN 46218
$106
Cash flow
4.4%
Cash-on-Cash Return
7.3%
Cap rate
0.9%
Rent to Value Ratio

Active
$329,000
4
bds
|
3
ba
|
2,446
sqft
|
built
1954
10036 E Troy Ave, Indianapolis, IN 46239
$-200
Cash flow
-3.2%
Cash-on-Cash Return
5.5%
Cap rate
0.7%
Rent to Value Ratio
Active
$189,900
3
bds
|
0
ba
|
0
sqft
|
built
1920
3469 N Capitol Ave, Indianapolis, IN 46208
$-232
Cash flow
-6.4%
Cash-on-Cash Return
4.8%
Cap rate
0.6%
Rent to Value Ratio

Active
$234,000
2
bds
|
1
ba
|
1,107
sqft
|
built
1947
1209 N Downey Ave, Indianapolis, IN 46219
$20
Cash flow
0.4%
Cash-on-Cash Return
6.4%
Cap rate
0.8%
Rent to Value Ratio

Active
$435,000
5
bds
|
3
ba
|
3,248
sqft
|
built
2021
8729 Dorill Creek Ln, Indianapolis, IN 46259
$-132
Cash flow
-1.6%
Cash-on-Cash Return
5.9%
Cap rate
0.7%
Rent to Value Ratio
Active
$119,000
2
bds
|
1
ba
|
979
sqft
|
built
1948
3954 Fletcher Ave, Indianapolis, IN 46203
$207
Cash flow
9.1%
Cash-on-Cash Return
8.3%
Cap rate
1.0%
Rent to Value Ratio
Active
$214,700
3
bds
|
1
ba
|
1,086
sqft
|
built
1967
3809 Wildwood Dr, Indianapolis, IN 46239
$-17
Cash flow
-0.4%
Cash-on-Cash Return
6.2%
Cap rate
0.7%
Rent to Value Ratio

Active
$398,900
3
bds
|
3
ba
|
1,926
sqft
|
built
1904
515 Orange St, Indianapolis, IN 46203
$-151
Cash flow
-2.0%
Cash-on-Cash Return
5.8%
Cap rate
0.7%
Rent to Value Ratio

Active
$279,900
3
bds
|
2
ba
|
1,815
sqft
|
built
1962
7206 Halden Pl, Indianapolis, IN 46214
$126
Cash flow
2.3%
Cash-on-Cash Return
6.8%
Cap rate
0.8%
Rent to Value Ratio

Active
$169,900
3
bds
|
1
ba
|
1,020
sqft
|
built
1919
625 N Grant Ave, Indianapolis, IN 46201
$-128
Cash flow
-3.9%
Cash-on-Cash Return
5.4%
Cap rate
0.6%
Rent to Value Ratio

Active
$390,000
6
bds
|
3
ba
|
2,631
sqft
|
built
1929
714 Berkley Rd, Indianapolis, IN 46208
$-104
Cash flow
-1.4%
Cash-on-Cash Return
5.9%
Cap rate
0.7%
Rent to Value Ratio
Active
$85,000
2
bds
|
1
ba
|
960
sqft
|
built
1955
1724 Sheldon St, Indianapolis, IN 46218
$384
Cash flow
23.6%
Cash-on-Cash Return
11.7%
Cap rate
1.4%
Rent to Value Ratio

Active
$257,900
3
bds
|
2
ba
|
1,558
sqft
|
built
1916
909 N Parker Ave, Indianapolis, IN 46201
$-104
Cash flow
-2.1%
Cash-on-Cash Return
5.8%
Cap rate
0.7%
Rent to Value Ratio

Active
$265,000
3
bds
|
2
ba
|
1,447
sqft
|
built
1952
212 W Banta Rd, Indianapolis, IN 46217
$-279
Cash flow
-5.5%
Cash-on-Cash Return
5.0%
Cap rate
0.6%
Rent to Value Ratio

Active
$224,900
2
bds
|
2
ba
|
1,008
sqft
|
built
1915
2909 E Michigan St, Indianapolis, IN 46201
$-484
Cash flow
-11.2%
Cash-on-Cash Return
3.7%
Cap rate
0.4%
Rent to Value Ratio
Active
$340,000
5
bds
|
3
ba
|
2,192
sqft
|
built
1995
6714 Colleens Way, Indianapolis, IN 46221
$-409
Cash flow
-6.3%
Cash-on-Cash Return
4.8%
Cap rate
0.6%
Rent to Value Ratio

Active
$179,000
2
bds
|
2
ba
|
1,197
sqft
|
built
2001
4630 Kelvington Dr, Indianapolis, IN 46254
$-9
Cash flow
-0.3%
Cash-on-Cash Return
6.2%
Cap rate
0.9%
Rent to Value Ratio

Active
$420,000
3
bds
|
3
ba
|
2,128
sqft
|
built
1962
7859 N Chester Ave, Indianapolis, IN 46240
$-192
Cash flow
-2.4%
Cash-on-Cash Return
5.7%
Cap rate
0.7%
Rent to Value Ratio

Active
$209,900
3
bds
|
2
ba
|
1,224
sqft
|
built
1981
7915 Broadview Dr, Indianapolis, IN 46227
$8
Cash flow
0.2%
Cash-on-Cash Return
6.3%
Cap rate
0.8%
Rent to Value Ratio

Active
$1,795,000
4
bds
|
4
ba
|
5,207
sqft
|
built
2002
6560 Dawson Lake Dr, Indianapolis, IN 46220
$-4,155
Cash flow
-12.1%
Cash-on-Cash Return
3.5%
Cap rate
0.4%
Rent to Value Ratio