Indianapolis, IN Investment Properties for Sale
Browse homes for sale and investment properties in Indianapolis, IN. Refine your search by price, property type, or more.
Best cash flowing properties in Indianapolis, IN
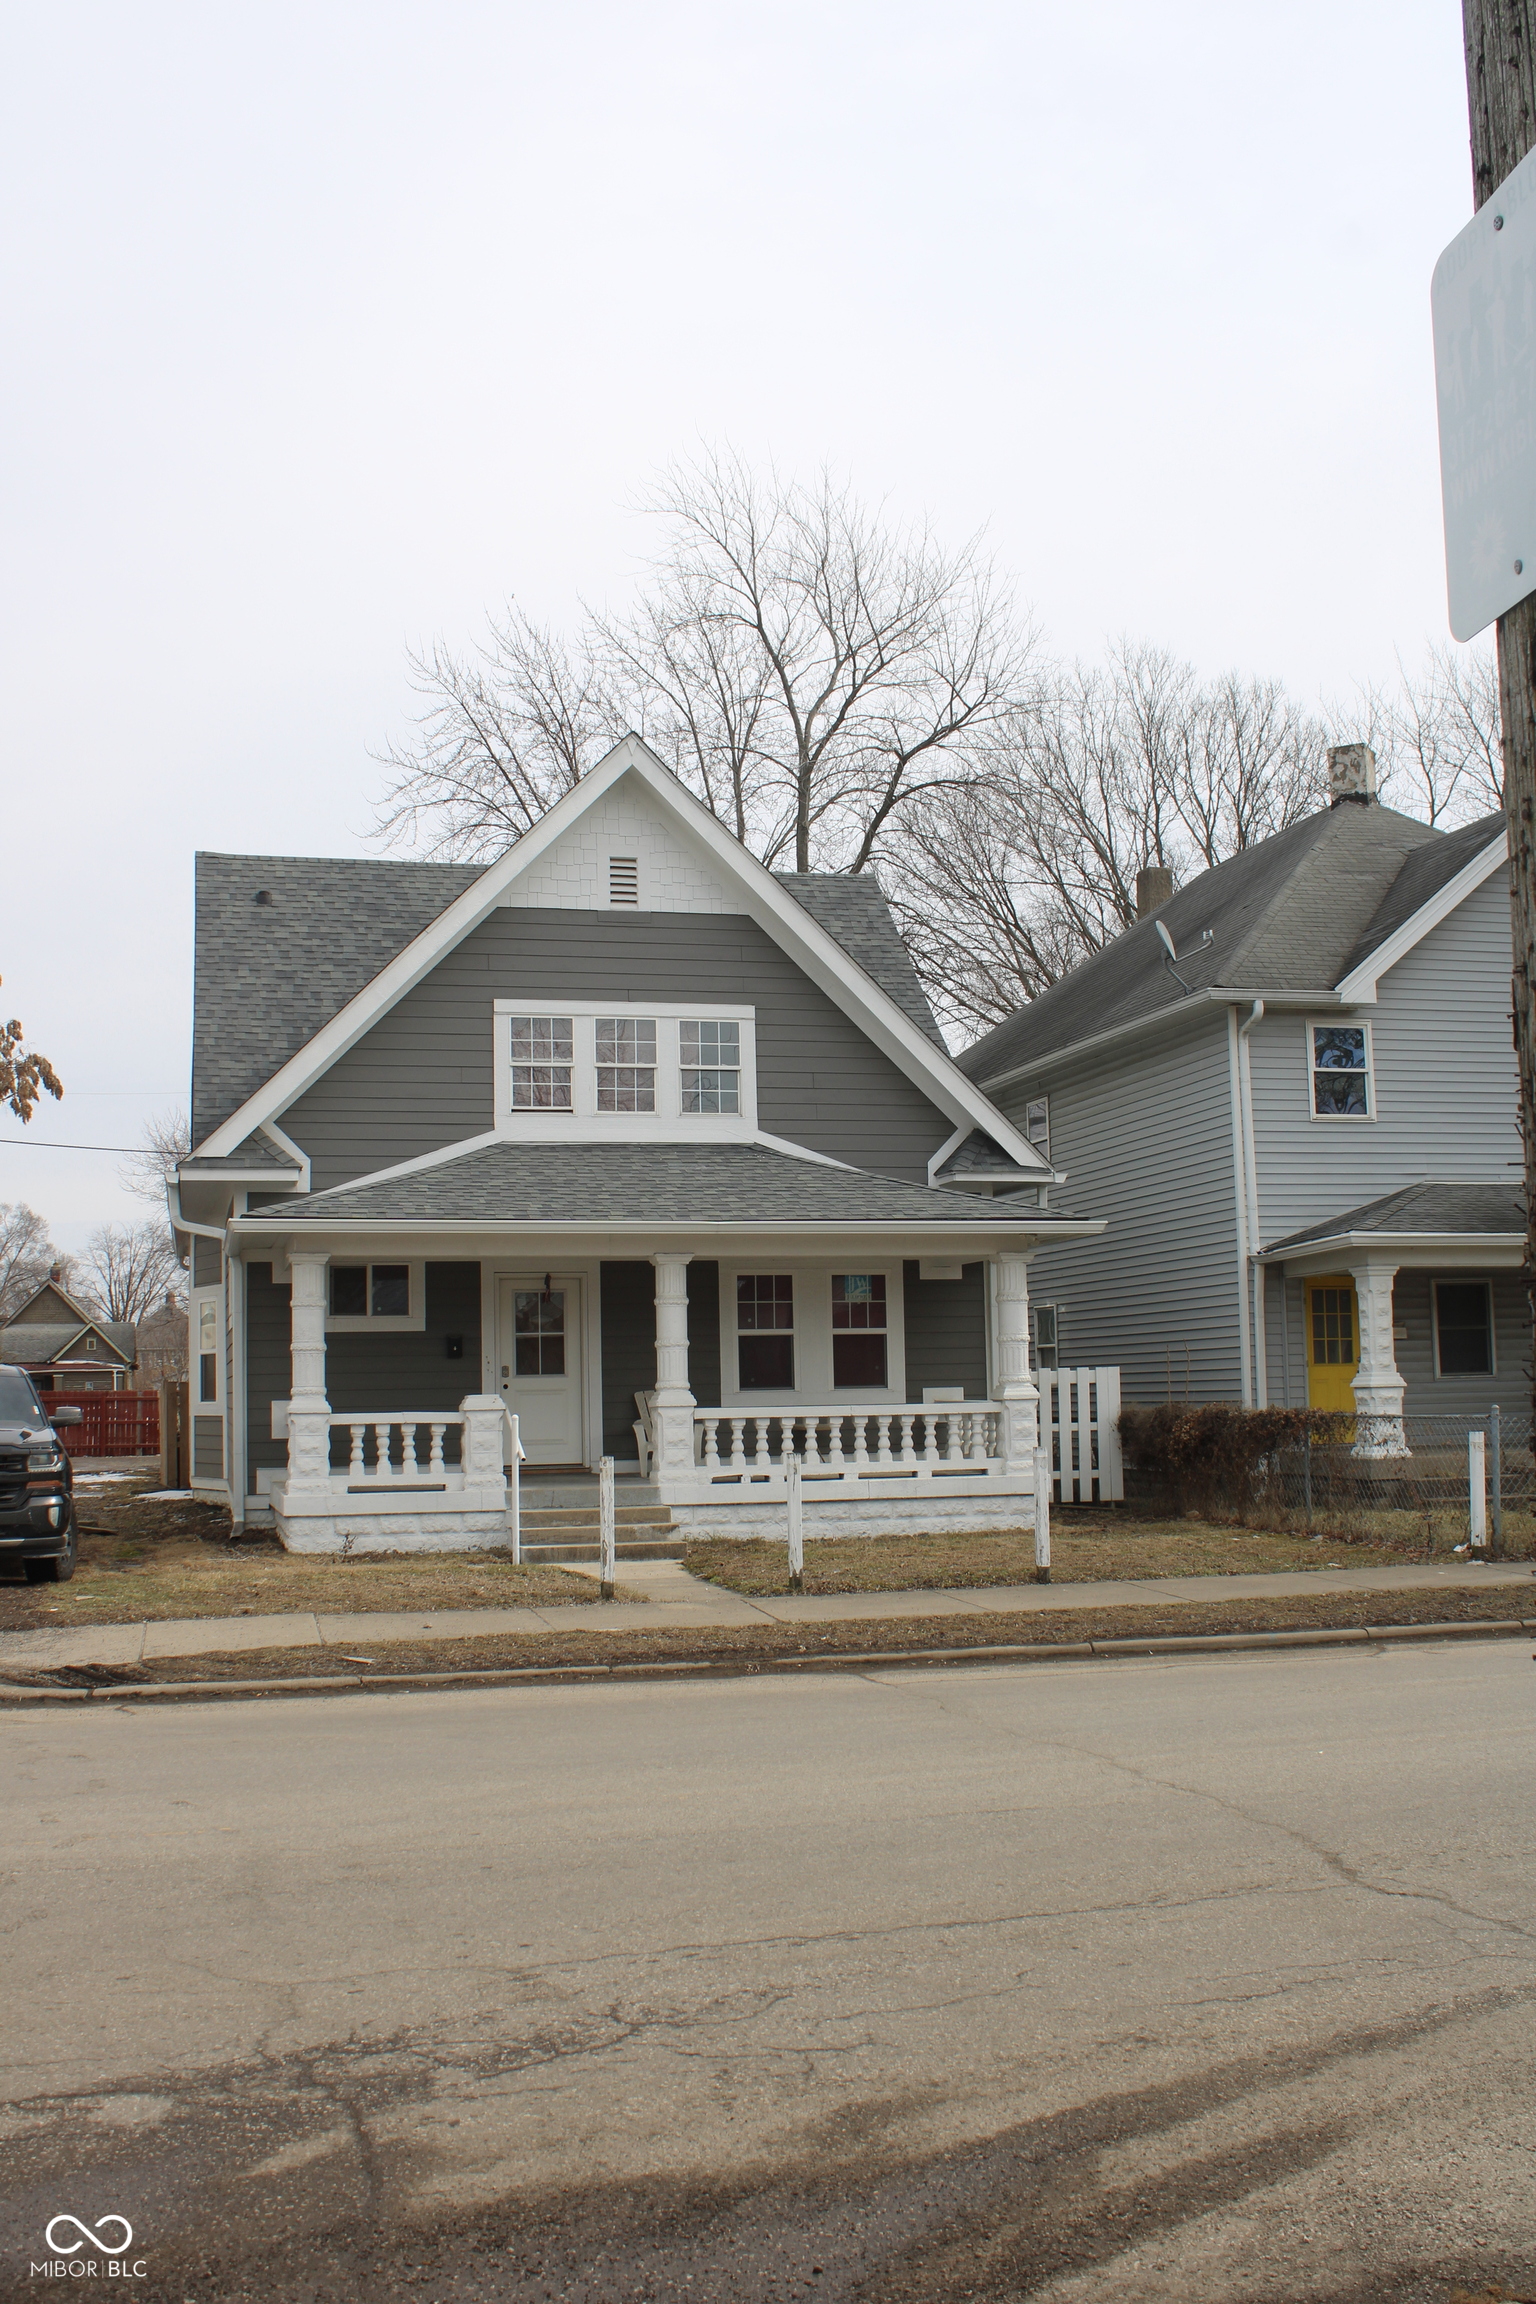
Pending
$100,000
2
bds
|
0
ba
|
1,032
sqft
|
built
1900
21 S Warman Ave, Indianapolis, IN 46222
$592
Cash flow
30.9%
Cash-on-Cash Return
13.2%
Cap rate
1.6%
Rent to Value Ratio
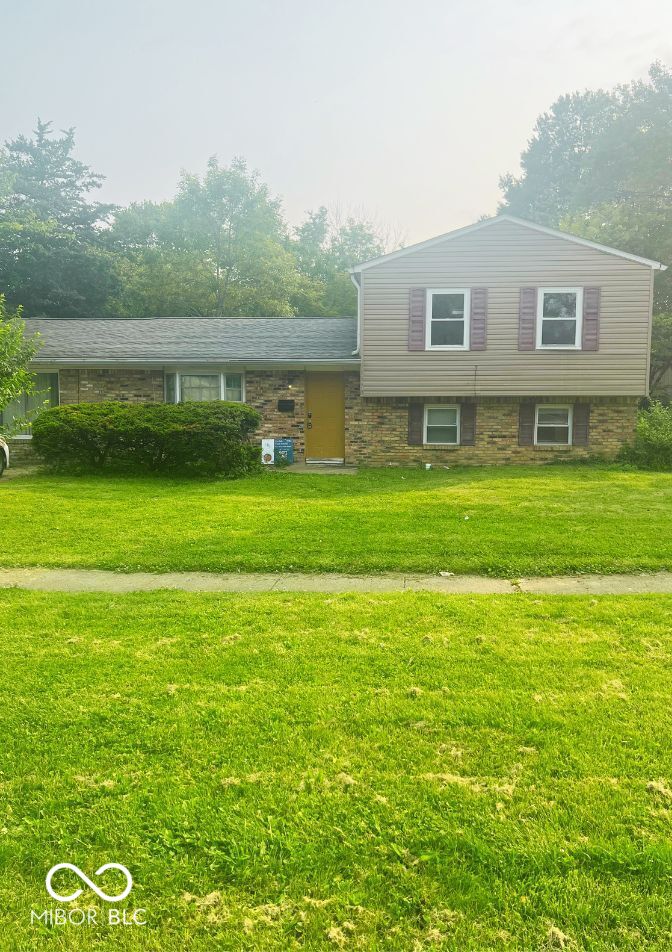
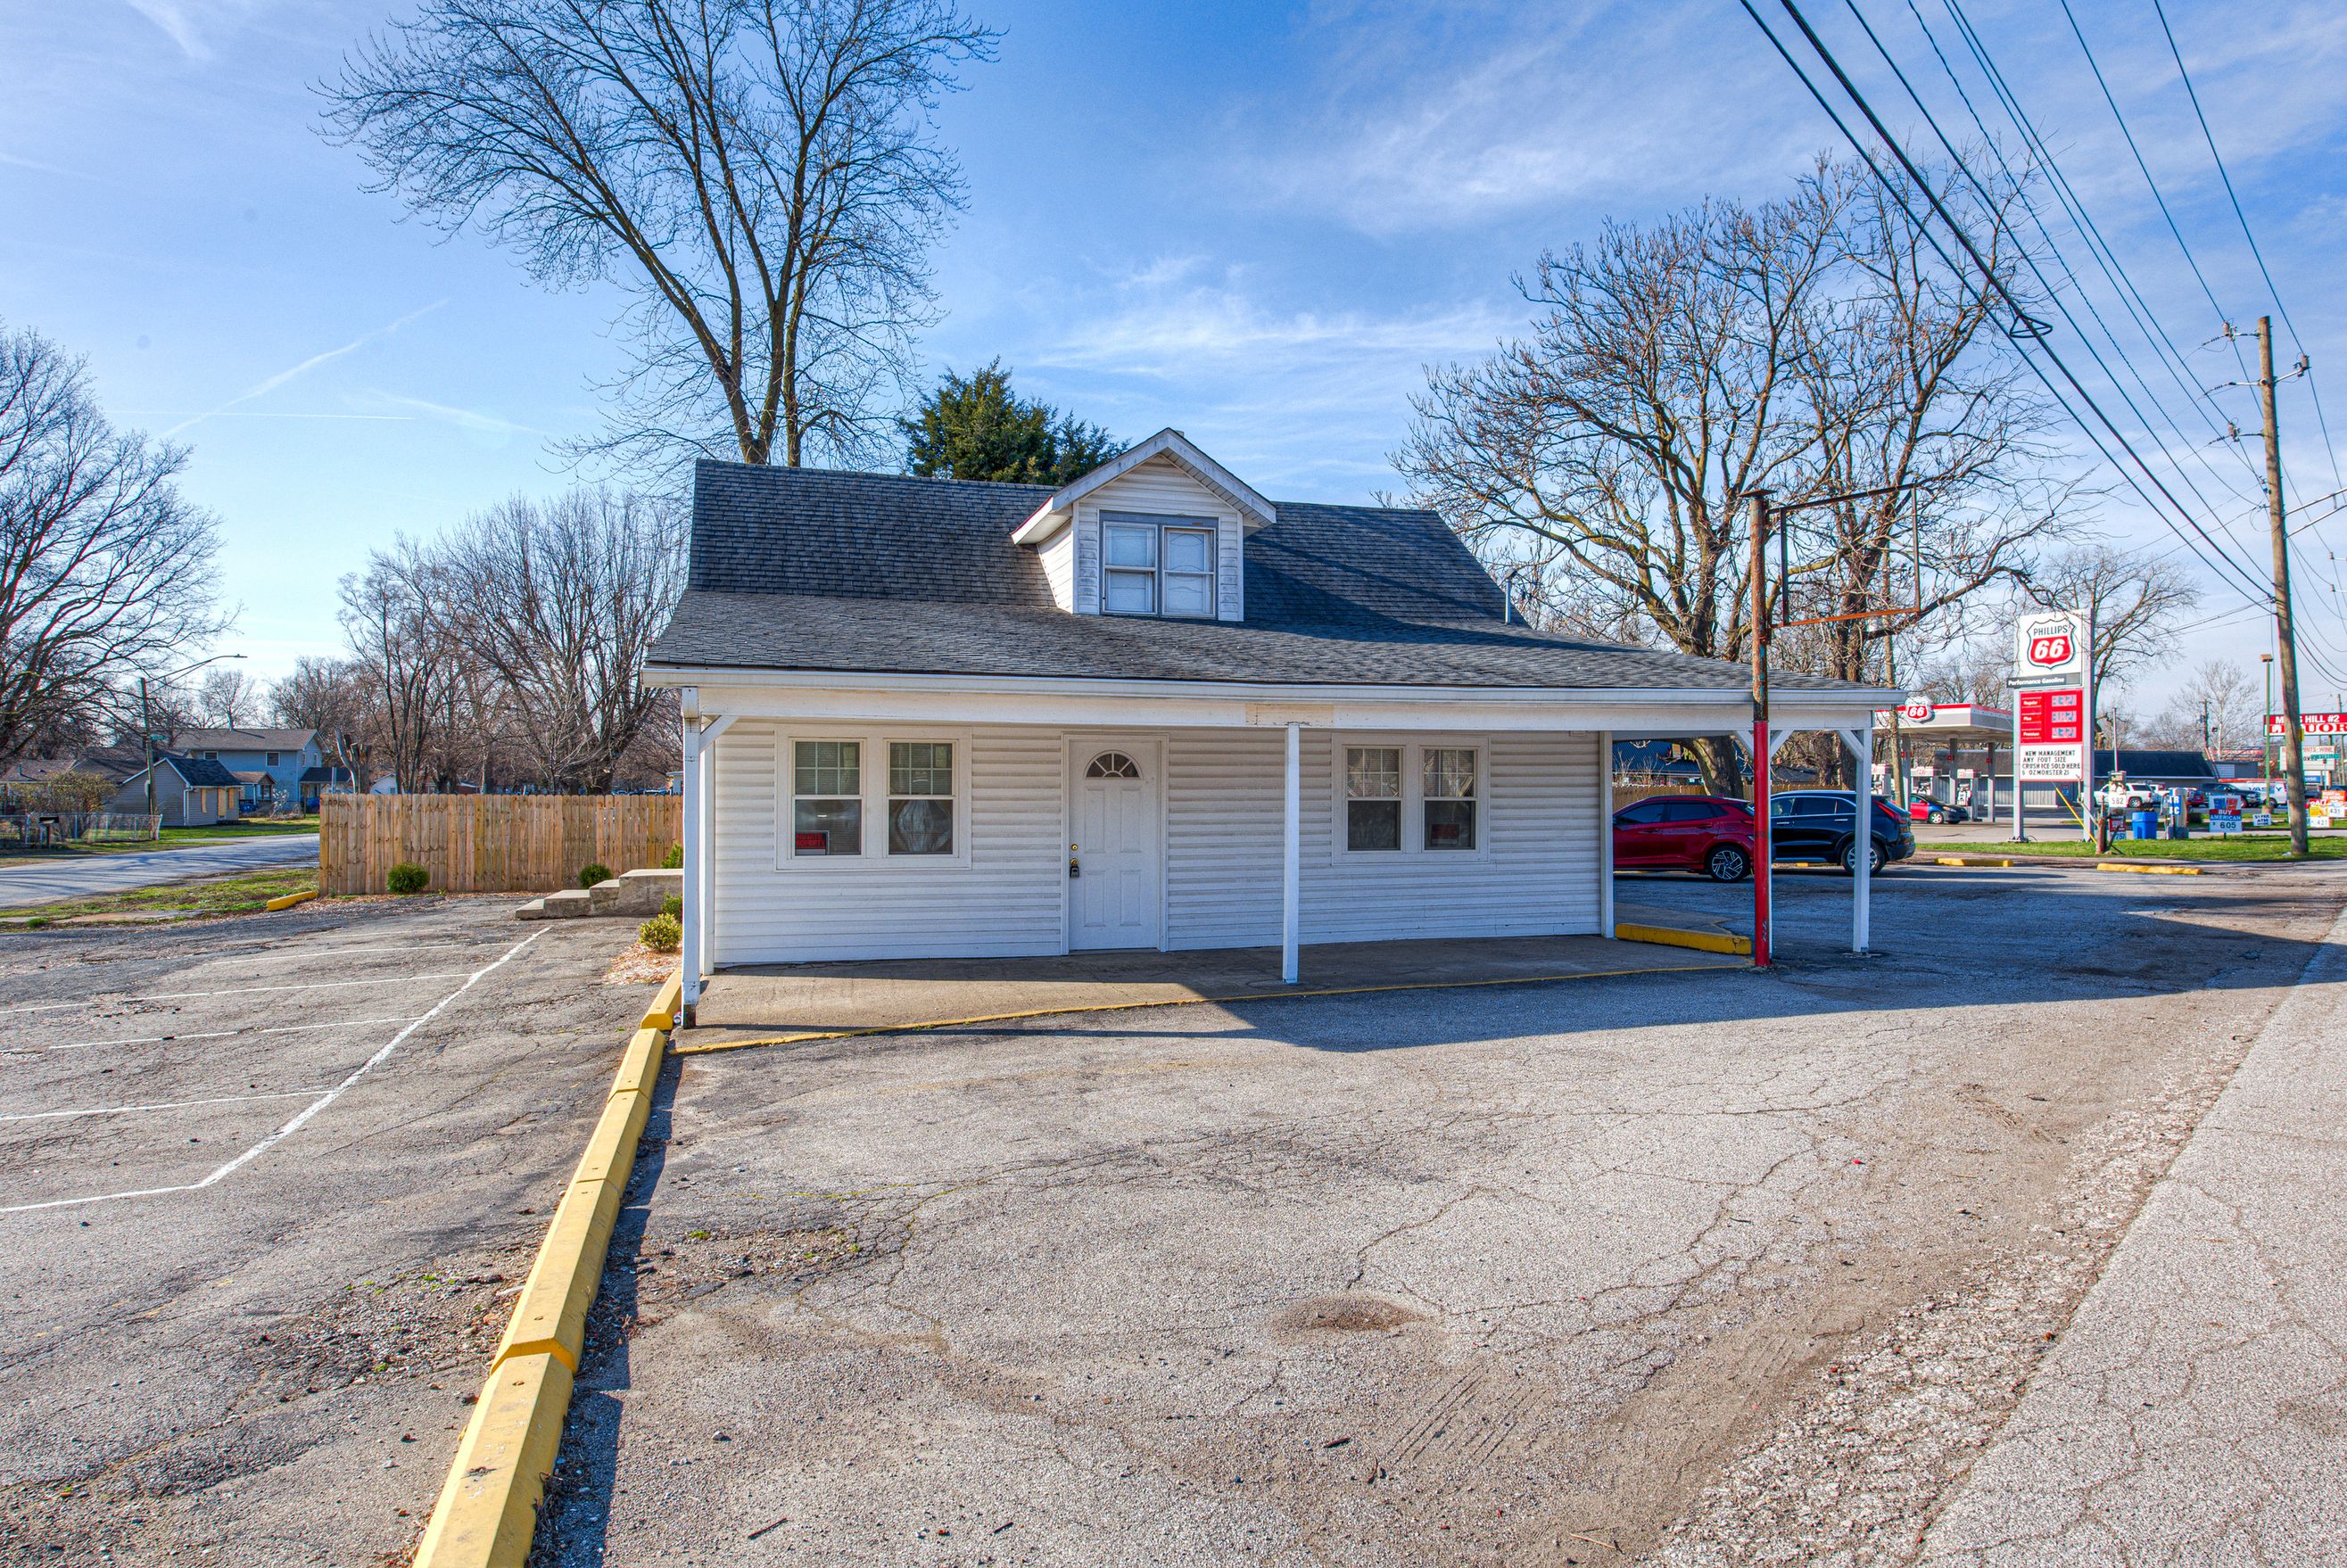
Active
$164,900
3
bds
|
2
ba
|
1,995
sqft
|
built
1960
3570 Decamp Dr, Indianapolis, IN 46226
$397
Cash flow
12.6%
Cash-on-Cash Return
9.0%
Cap rate
1.1%
Rent to Value Ratio
1,959 out of 2,099 properties for sale in Indianapolis, IN
Limited Results Shown
Create a free account, or log in to reveal all property listings and enjoy the complete experience.
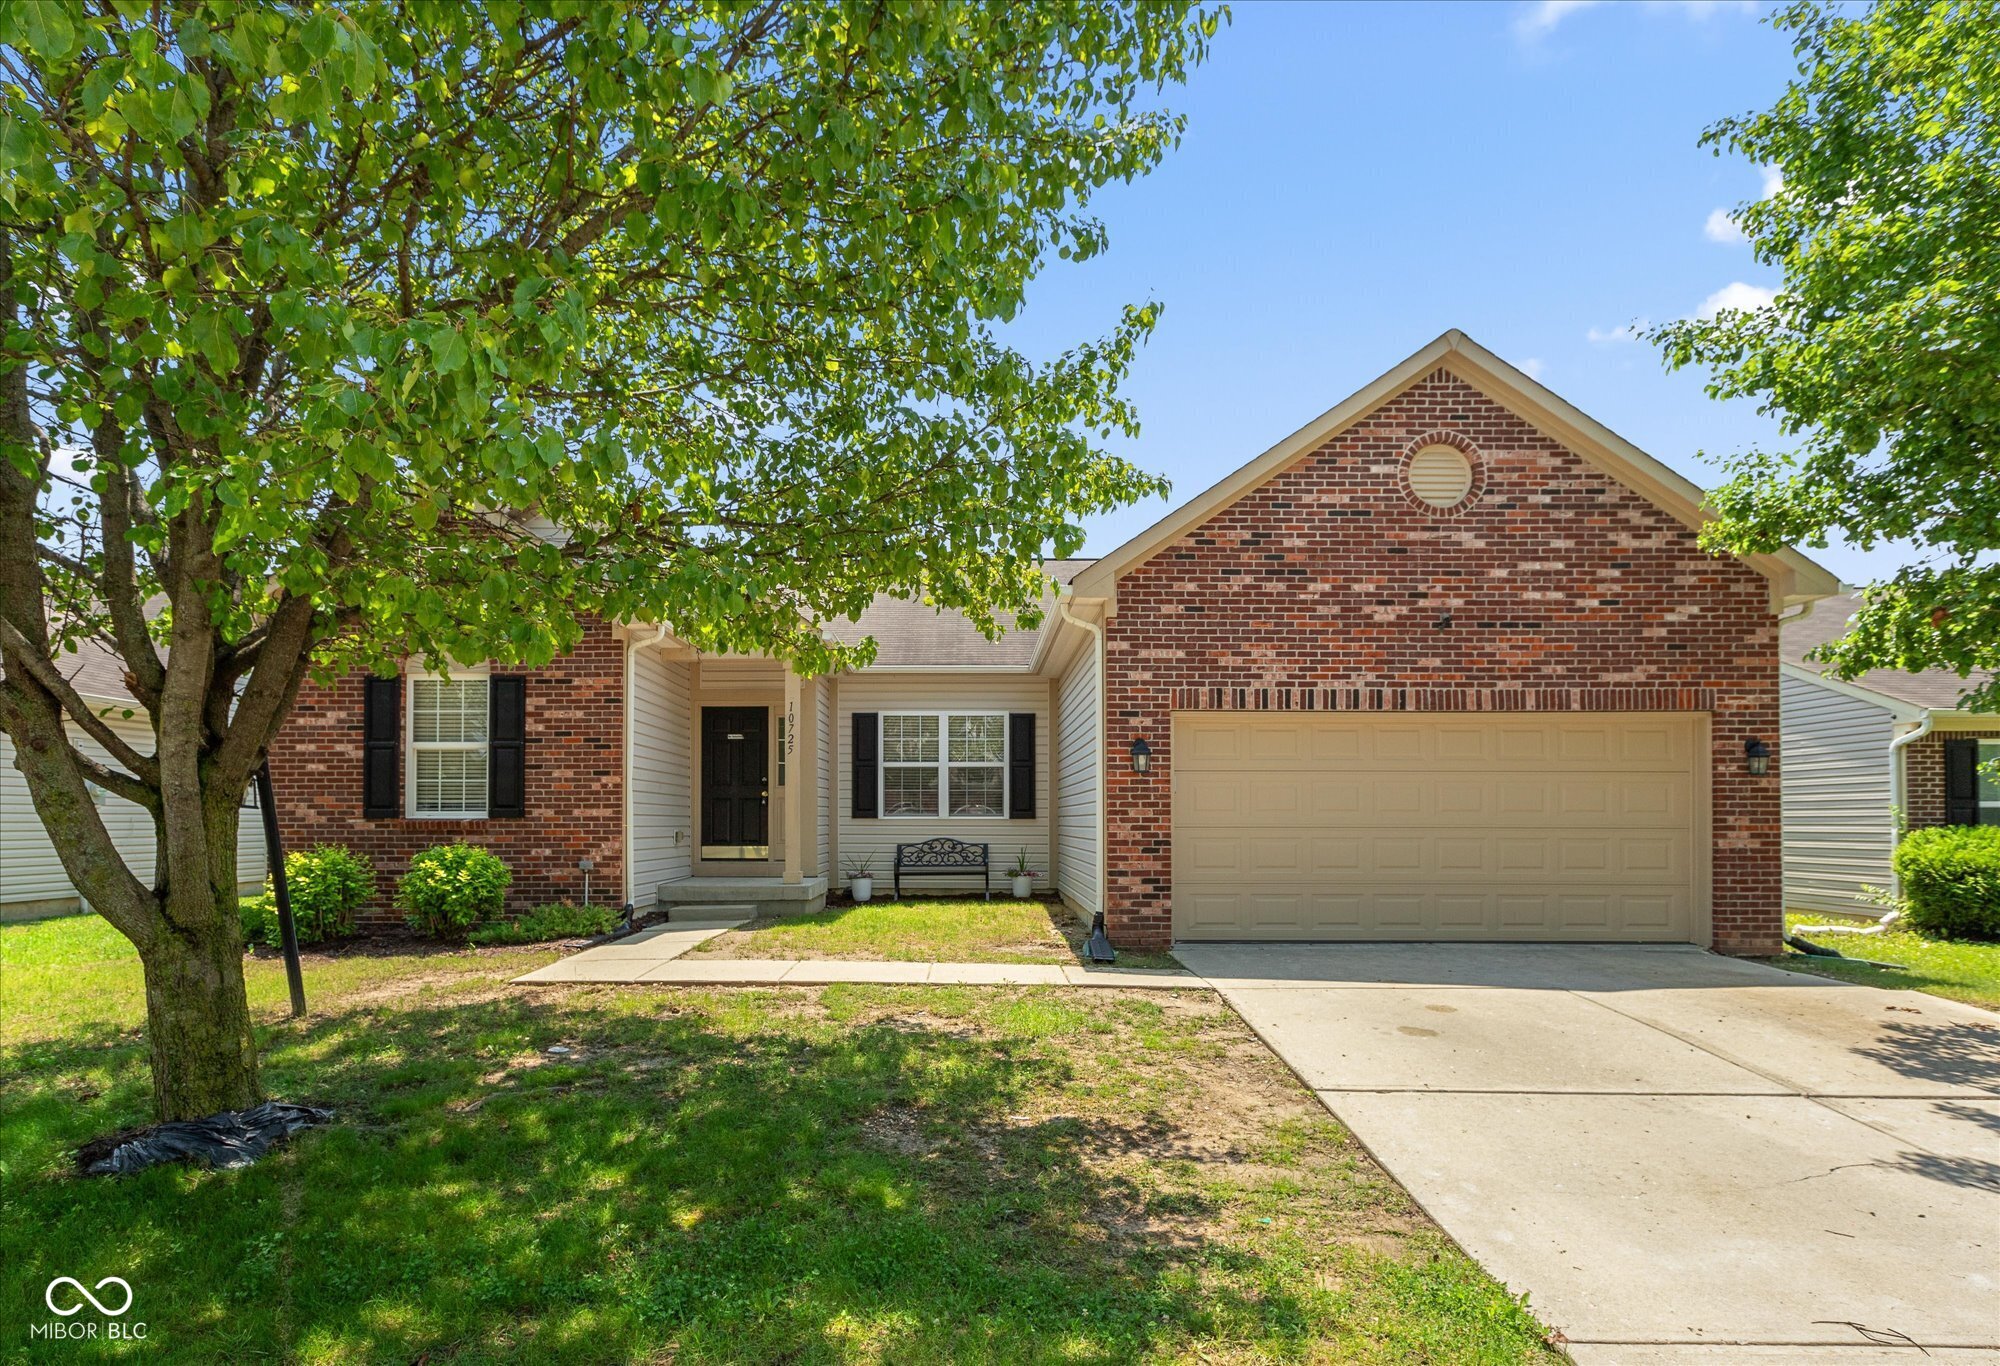
Active
$318,000
3
bds
|
3
ba
|
3,912
sqft
|
built
2007
10725 Tedder Lake Dr, Indianapolis, IN 46239
$-77
Cash flow
-1.3%
Cash-on-Cash Return
5.9%
Cap rate
0.7%
Rent to Value Ratio
Pending
$100,000
2
bds
|
0
ba
|
1,032
sqft
|
built
1900
21 S Warman Ave, Indianapolis, IN 46222
$592
Cash flow
30.9%
Cash-on-Cash Return
13.2%
Cap rate
1.6%
Rent to Value Ratio
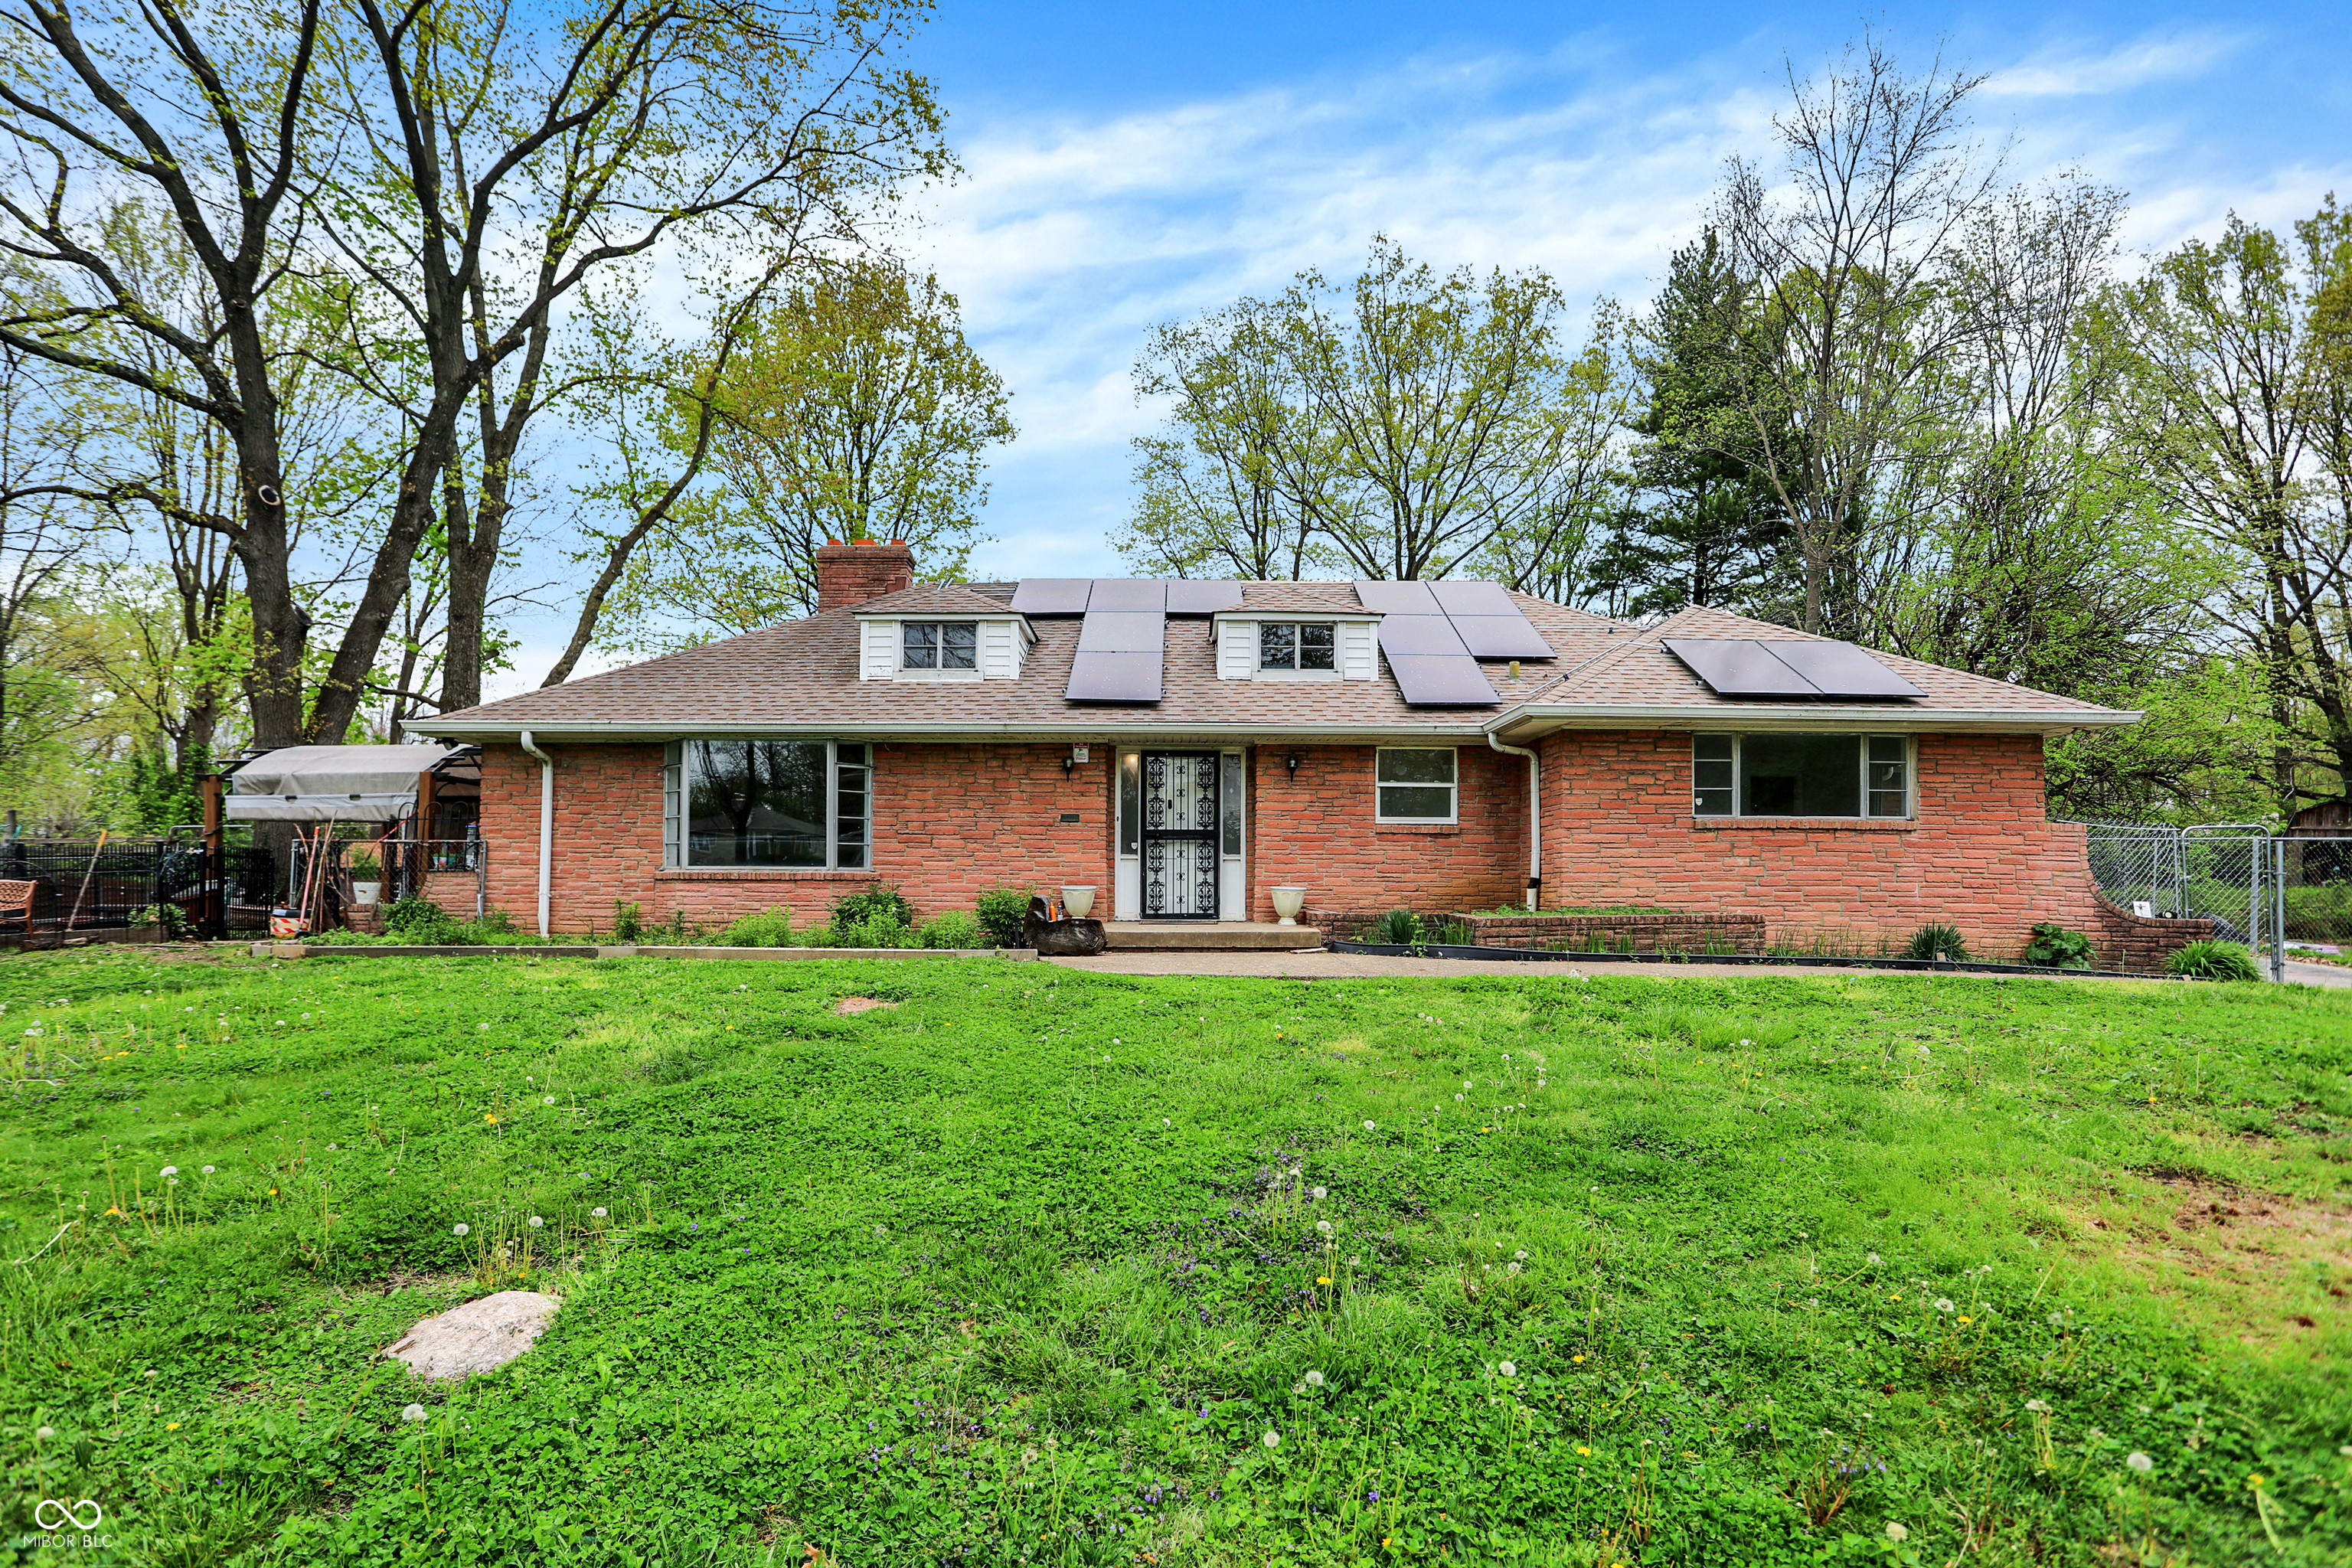
Active
$490,000
4
bds
|
3
ba
|
3,115
sqft
|
built
1954
3975 Denwood Dr, Indianapolis, IN 46226
$-992
Cash flow
-10.6%
Cash-on-Cash Return
3.7%
Cap rate
0.4%
Rent to Value Ratio
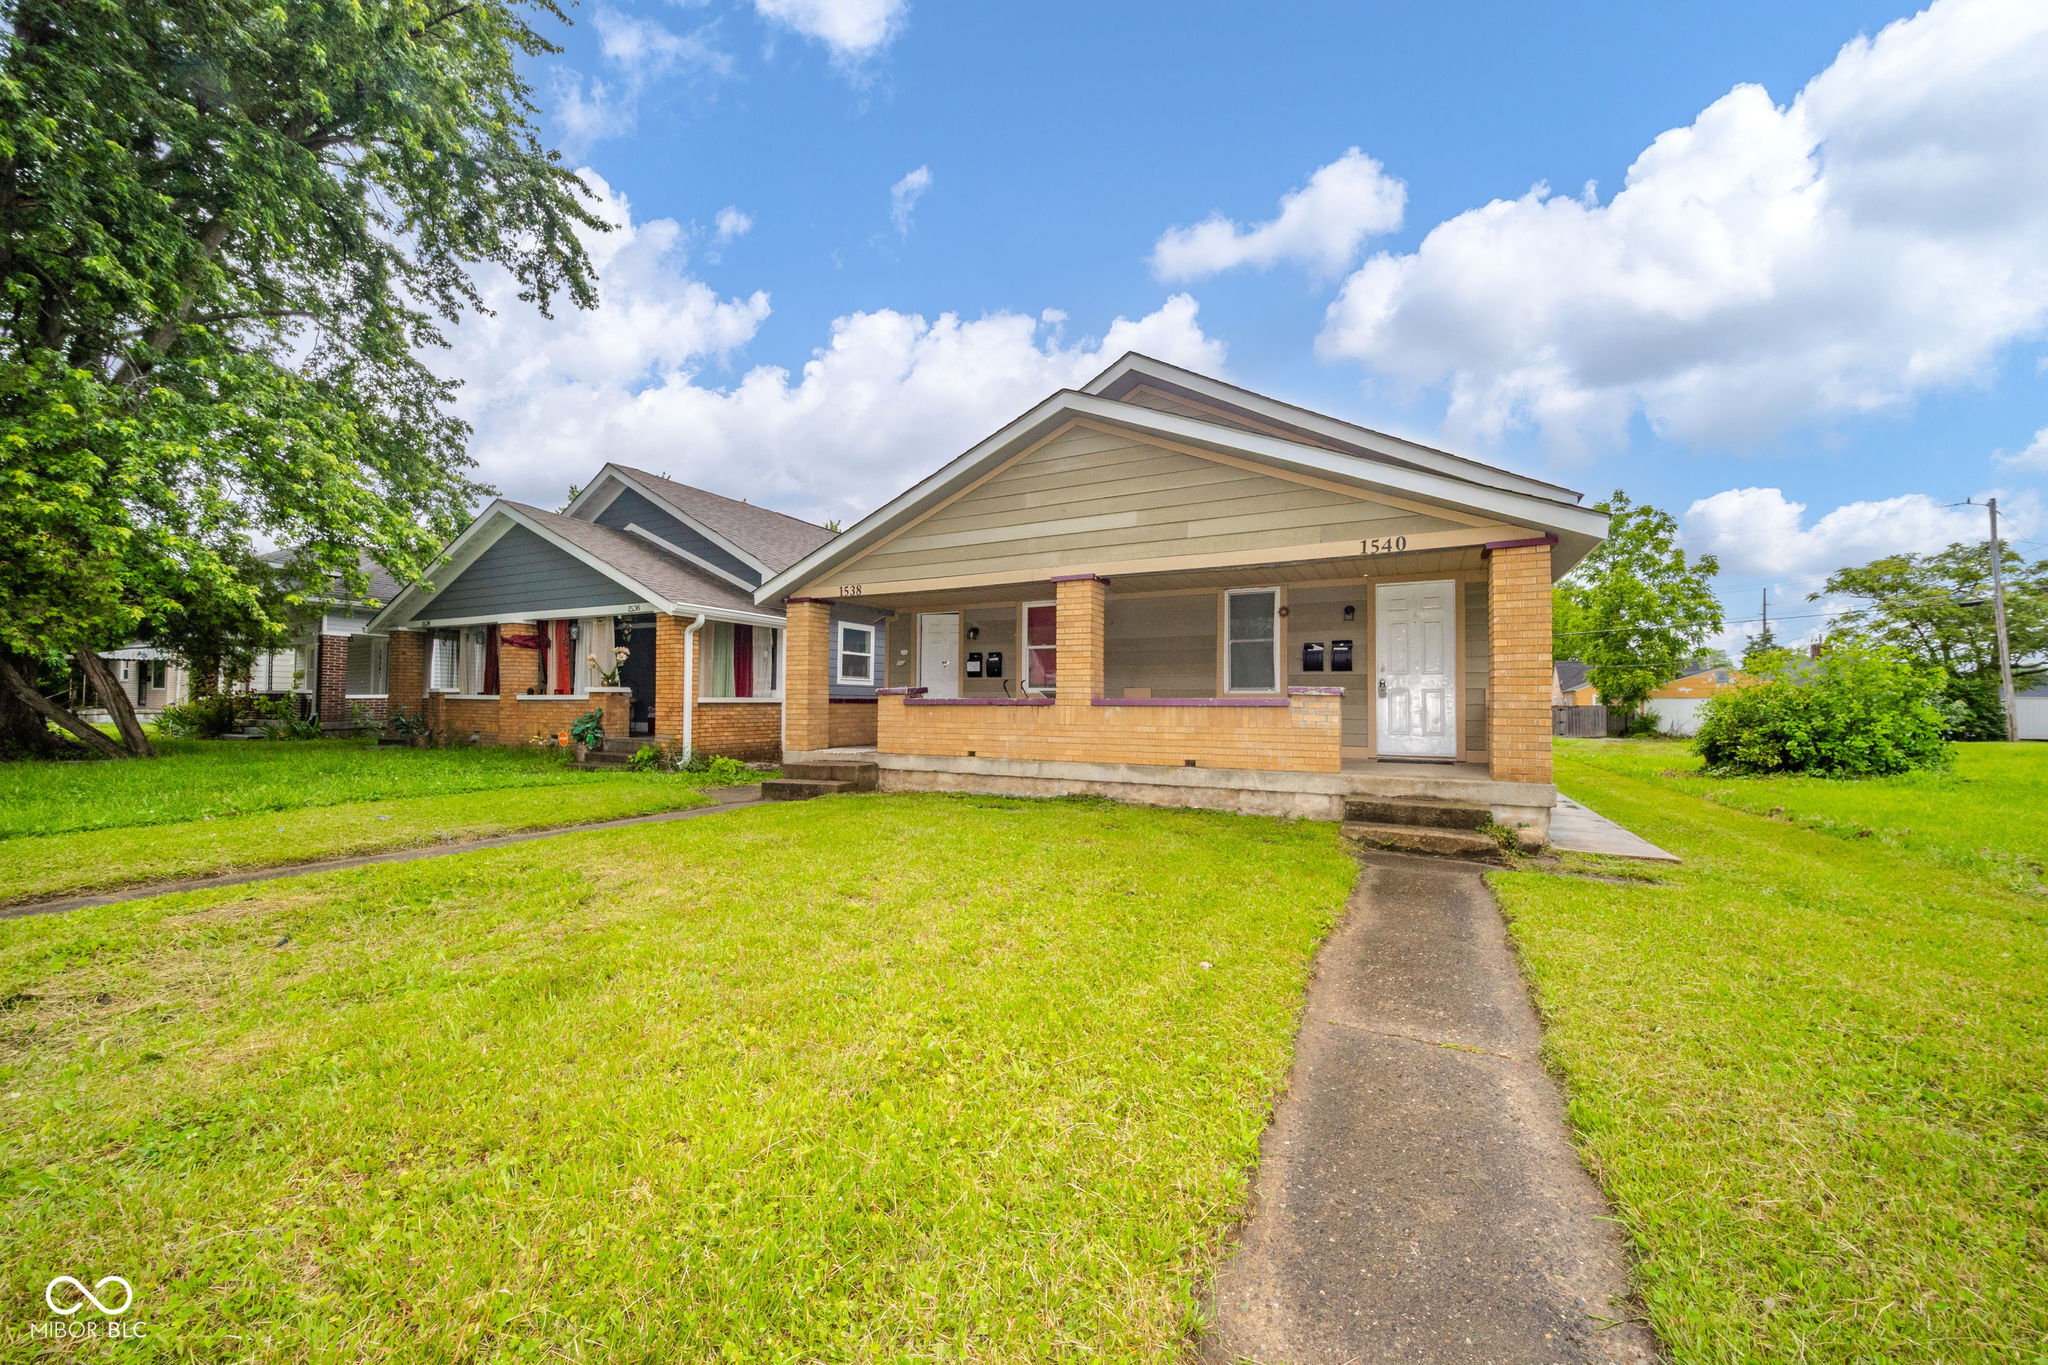
Active
$250,000
1
bds
|
0
ba
|
0
sqft
|
built
1929
1538 N Grant Ave, Indianapolis, IN 46201
$-798
Cash flow
-16.7%
Cash-on-Cash Return
2.3%
Cap rate
0.3%
Rent to Value Ratio
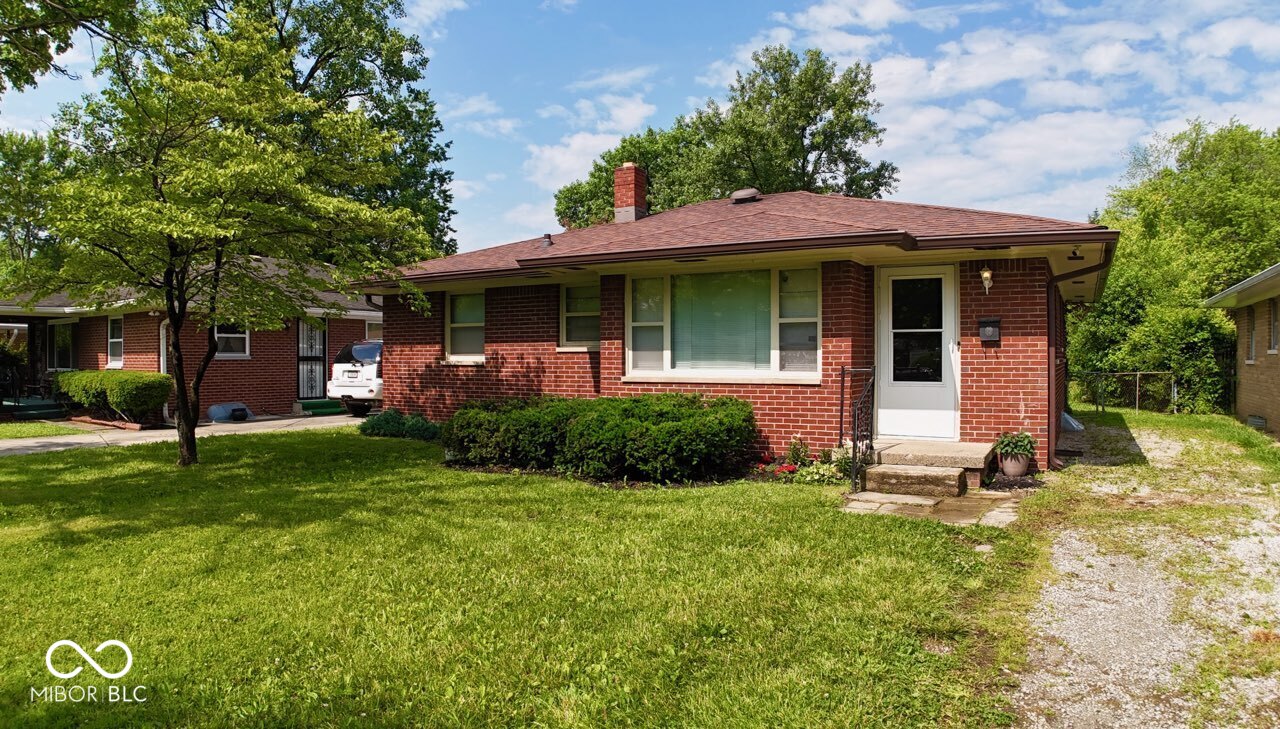
Active
$218,000
3
bds
|
2
ba
|
1,507
sqft
|
built
1945
3602 N Colorado Ave, Indianapolis, IN 46218
$125
Cash flow
3.0%
Cash-on-Cash Return
6.8%
Cap rate
0.8%
Rent to Value Ratio
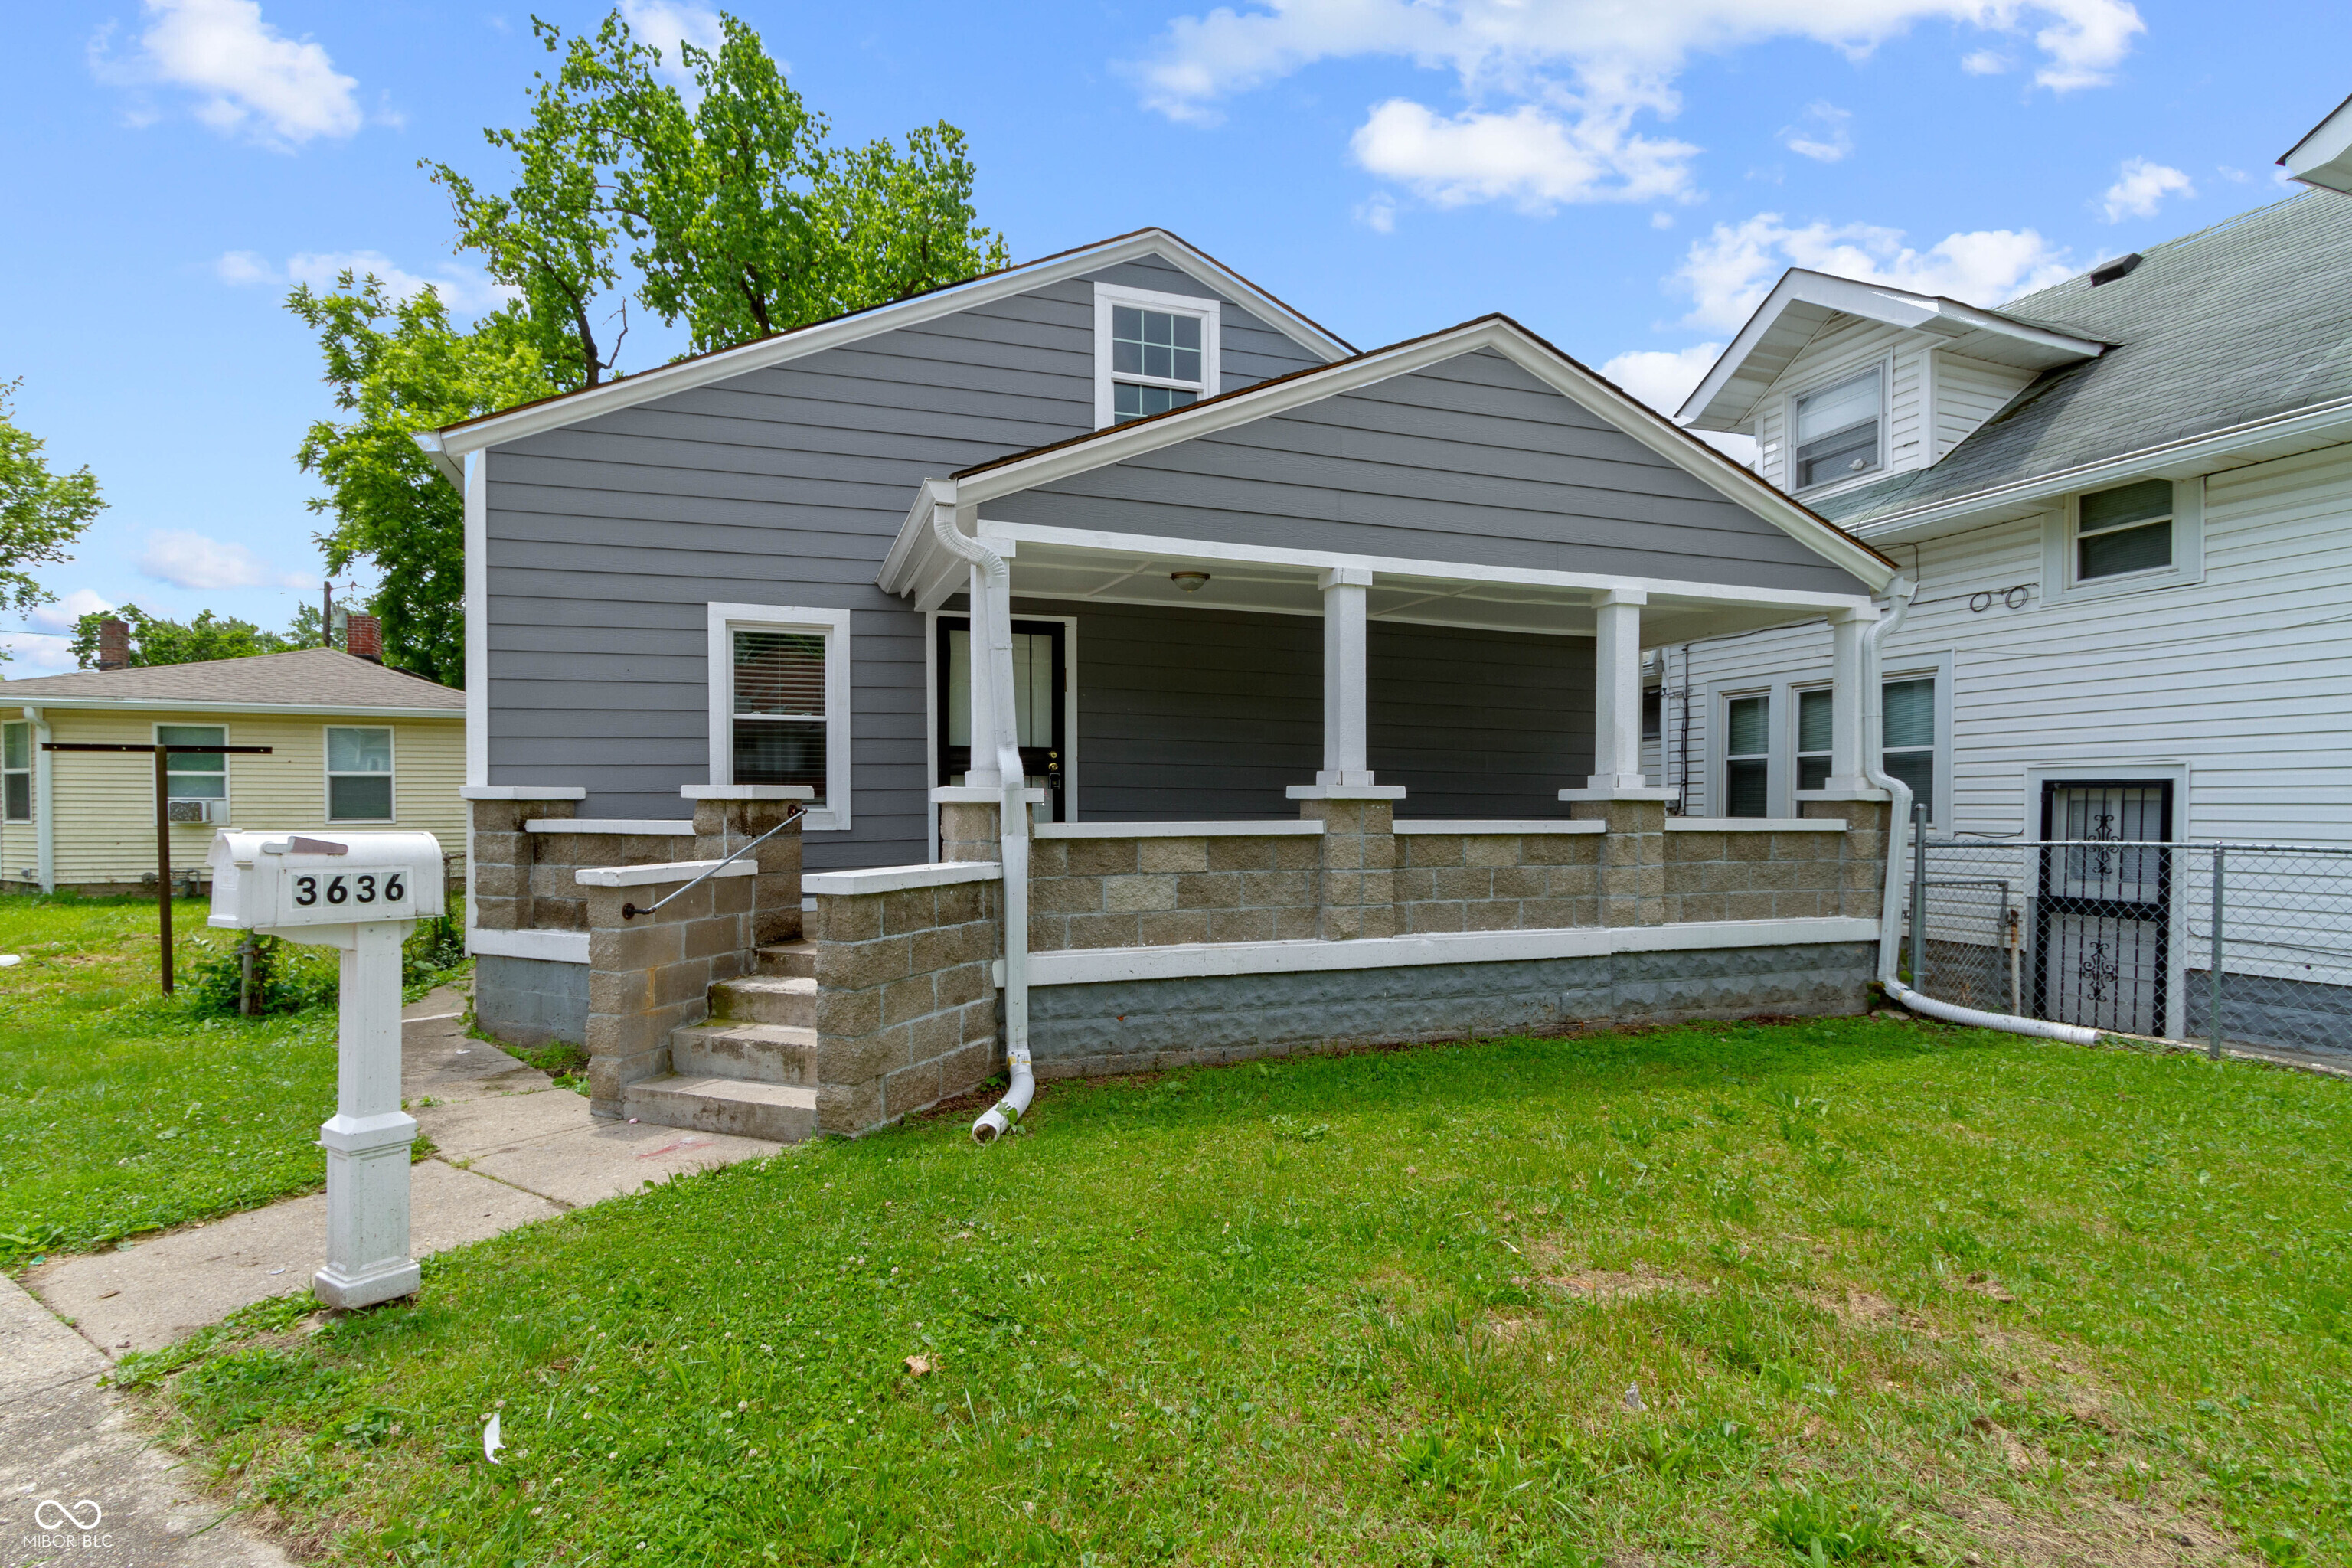
Active
$164,900
3
bds
|
2
ba
|
1,020
sqft
|
built
1920
3636 Crescent Ave, Indianapolis, IN 46208
$121
Cash flow
3.8%
Cash-on-Cash Return
7.0%
Cap rate
0.8%
Rent to Value Ratio
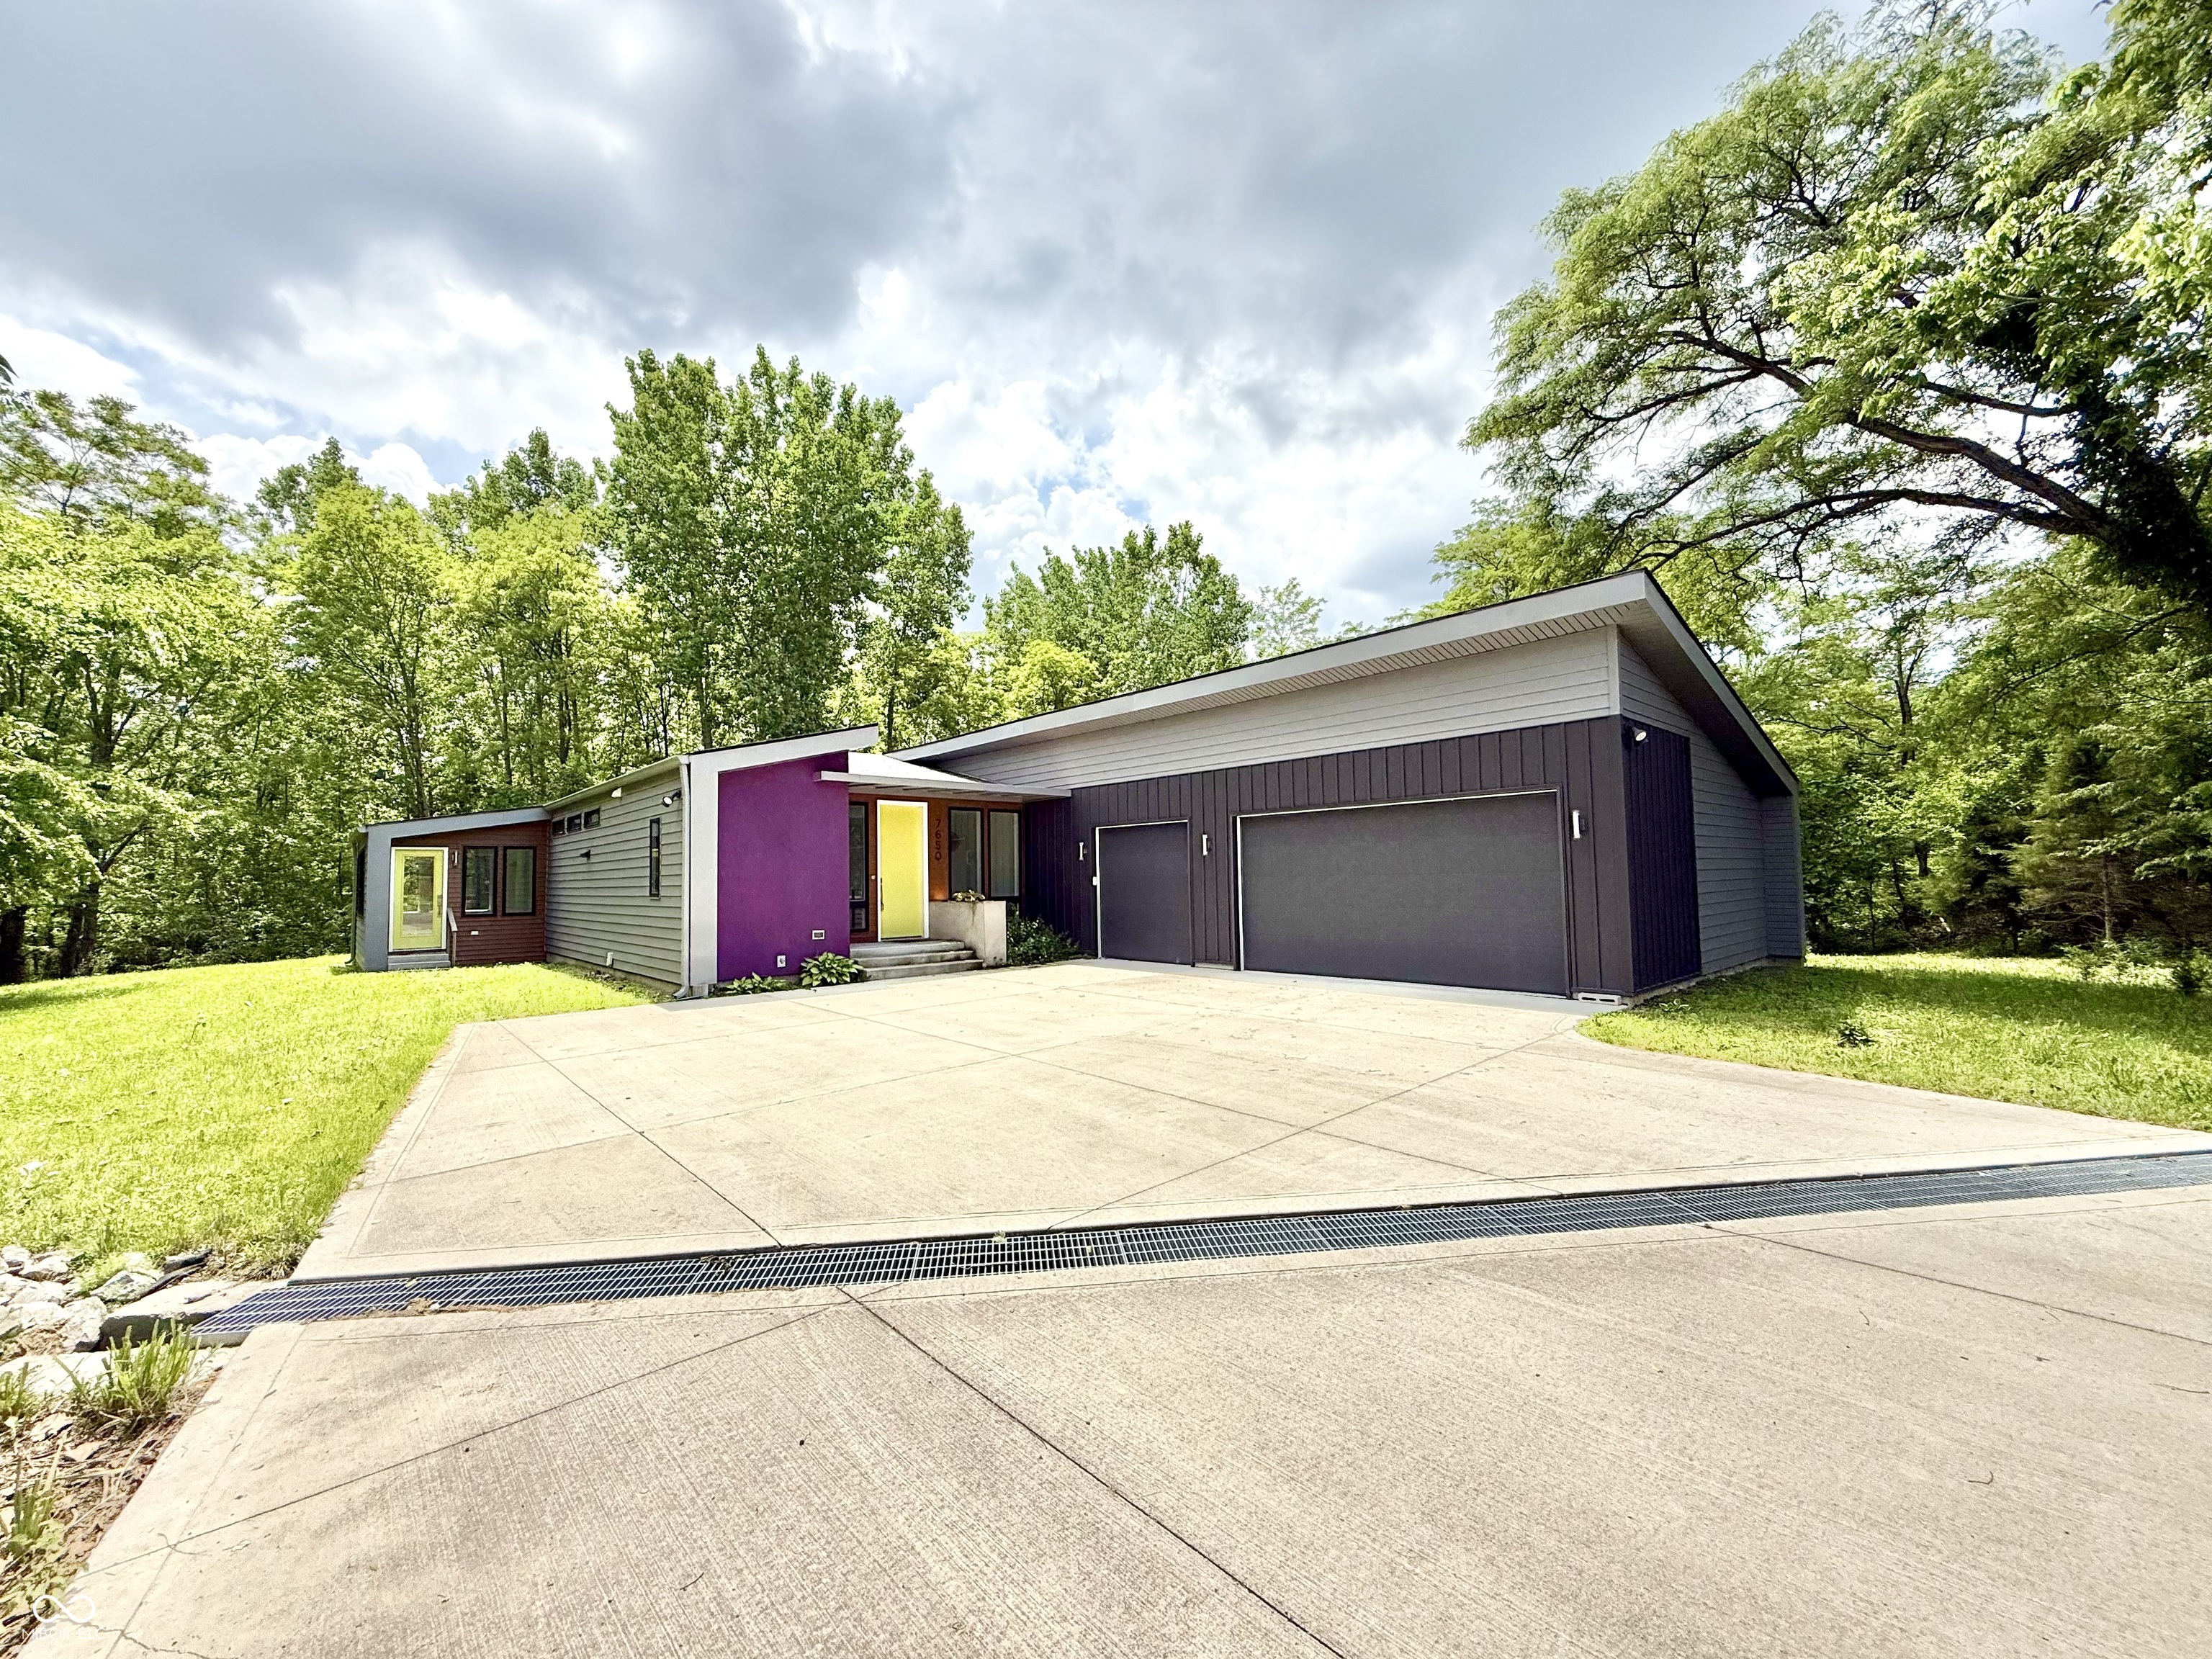
Active
$650,000
3
bds
|
3
ba
|
3,636
sqft
|
built
2020
7650 Clarion Dr, Indianapolis, IN 46236
$189
Cash flow
1.5%
Cash-on-Cash Return
6.5%
Cap rate
0.8%
Rent to Value Ratio
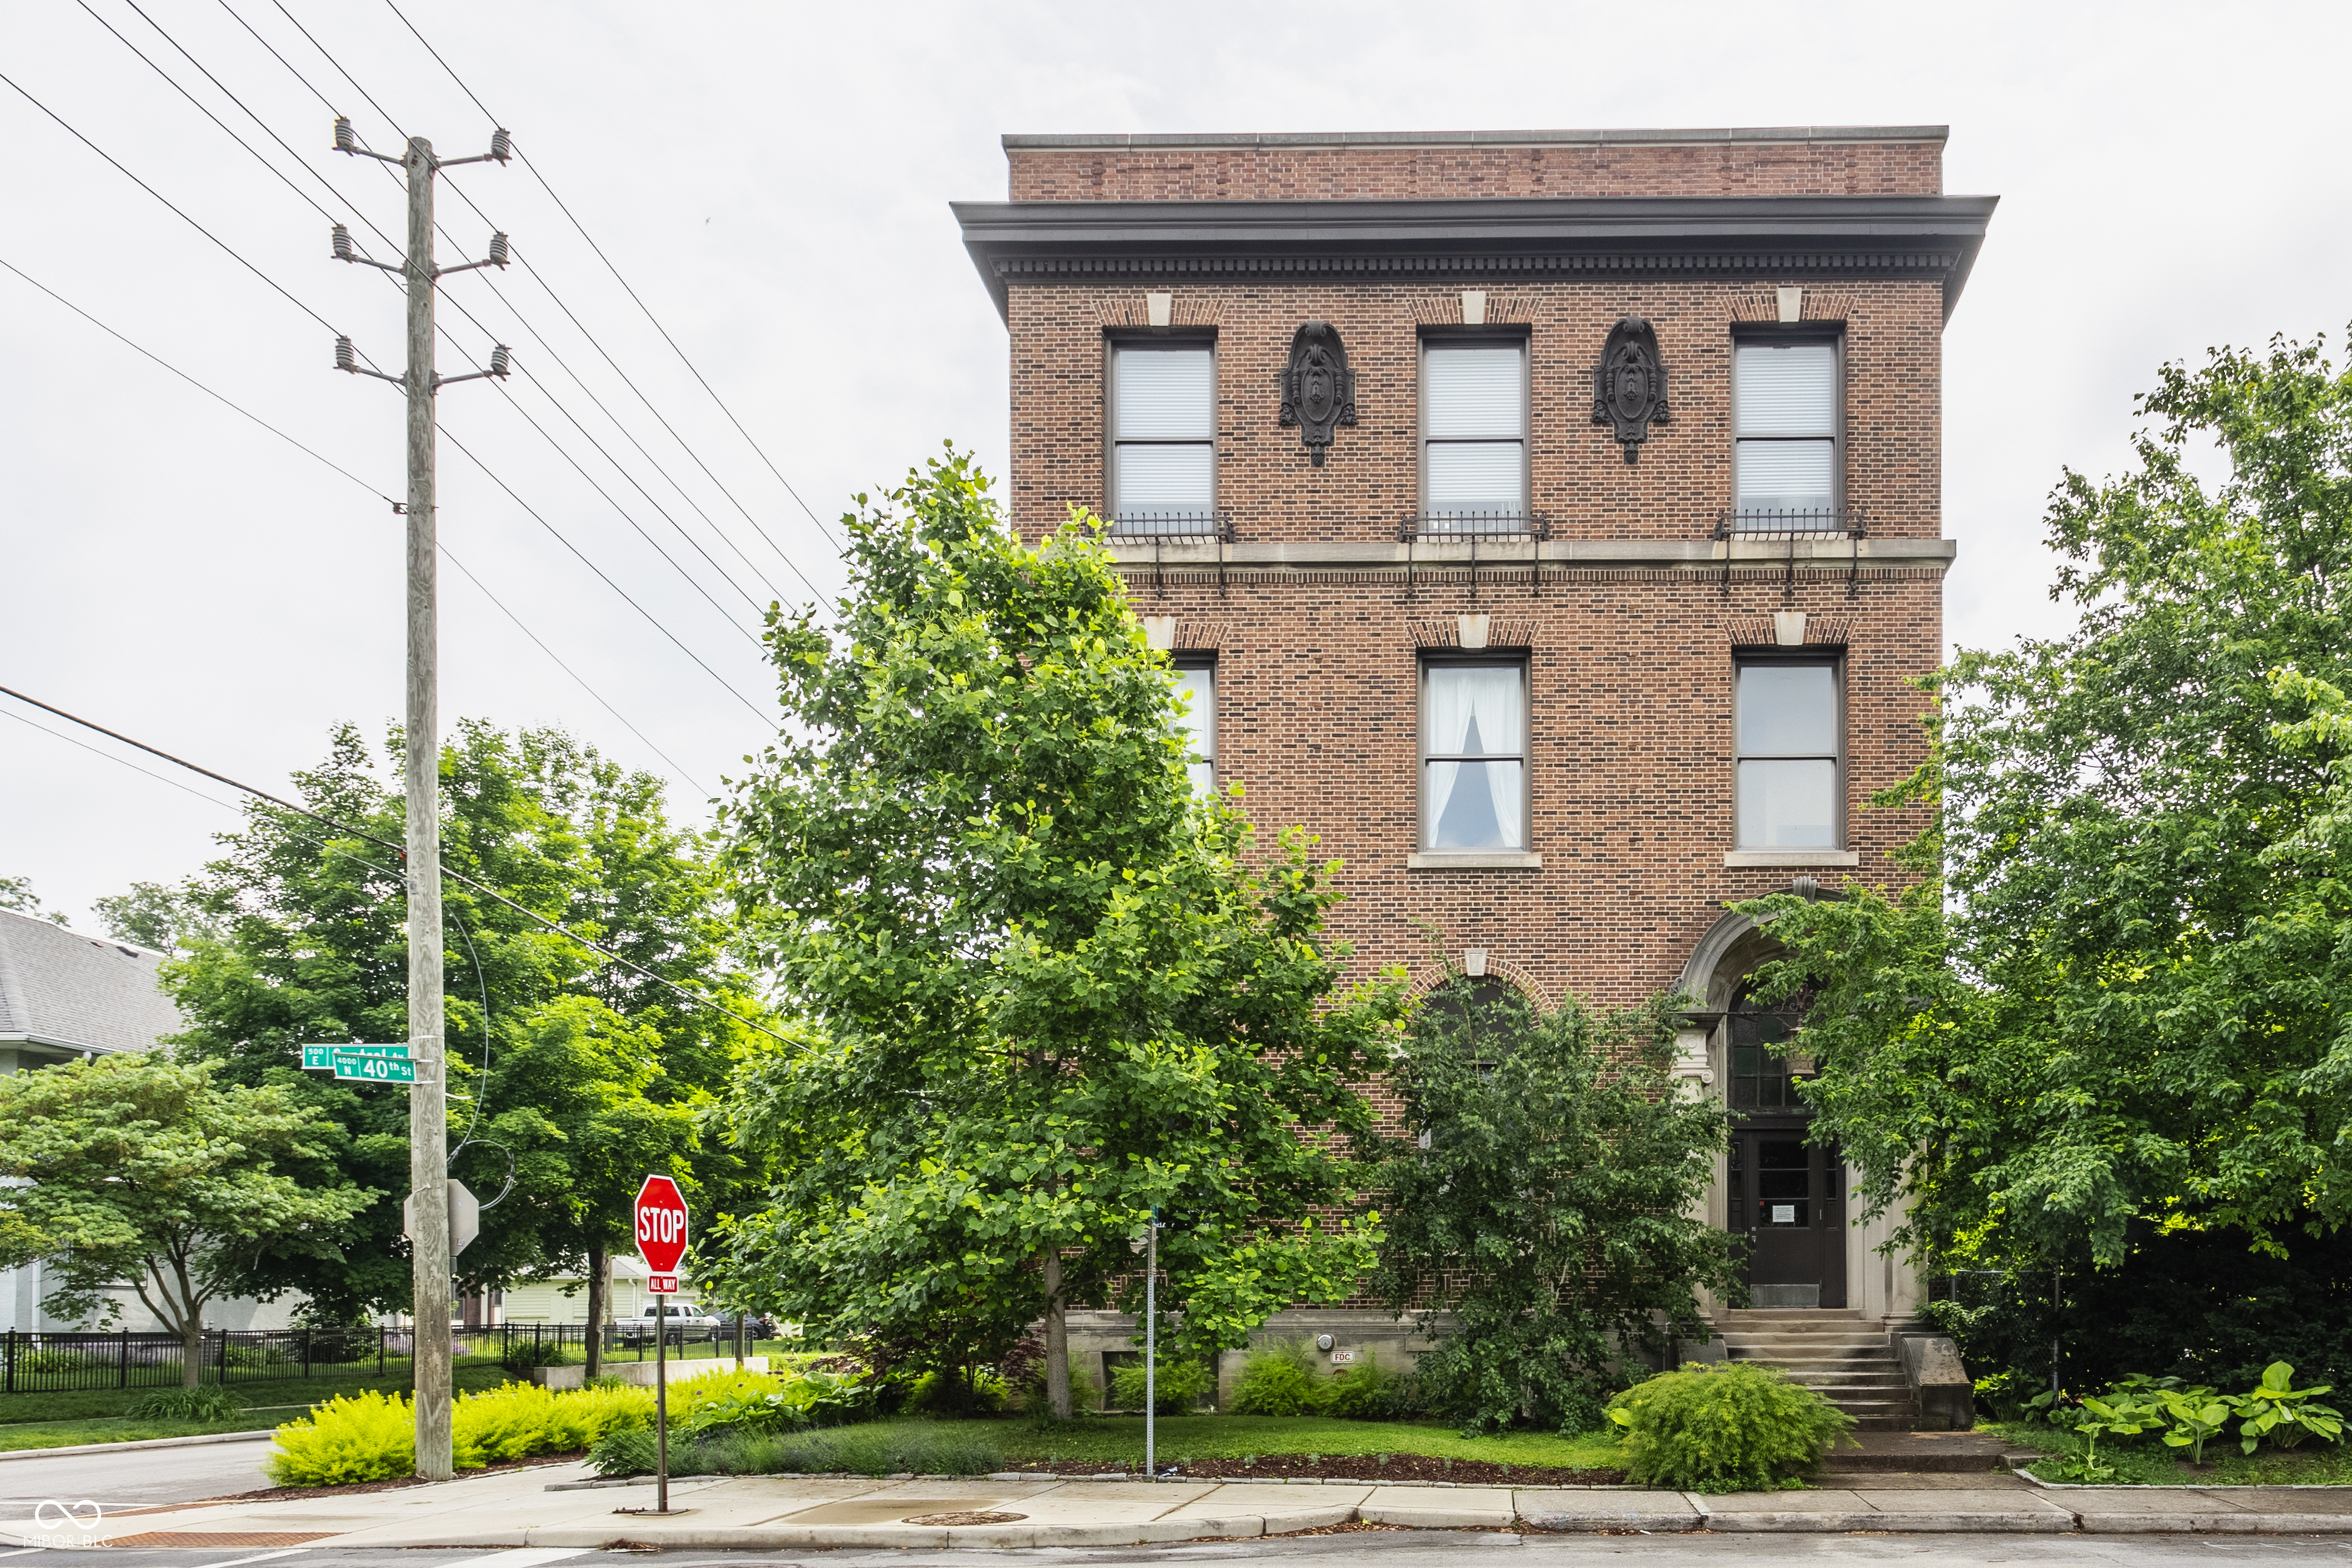
Active
$911,102
6
bds
|
6
ba
|
4,739
sqft
|
built
1900
1034 N Tacoma Ave, Indianapolis, IN 46201
$-3,908
Cash flow
-22.4%
Cash-on-Cash Return
1.0%
Cap rate
0.1%
Rent to Value Ratio
Active
$319,000
2
bds
|
2
ba
|
1,615
sqft
|
built
1920
970 Fort Wayne Ave, Indianapolis, IN 46202
$-481
Cash flow
-7.9%
Cash-on-Cash Return
4.3%
Cap rate
0.8%
Rent to Value Ratio
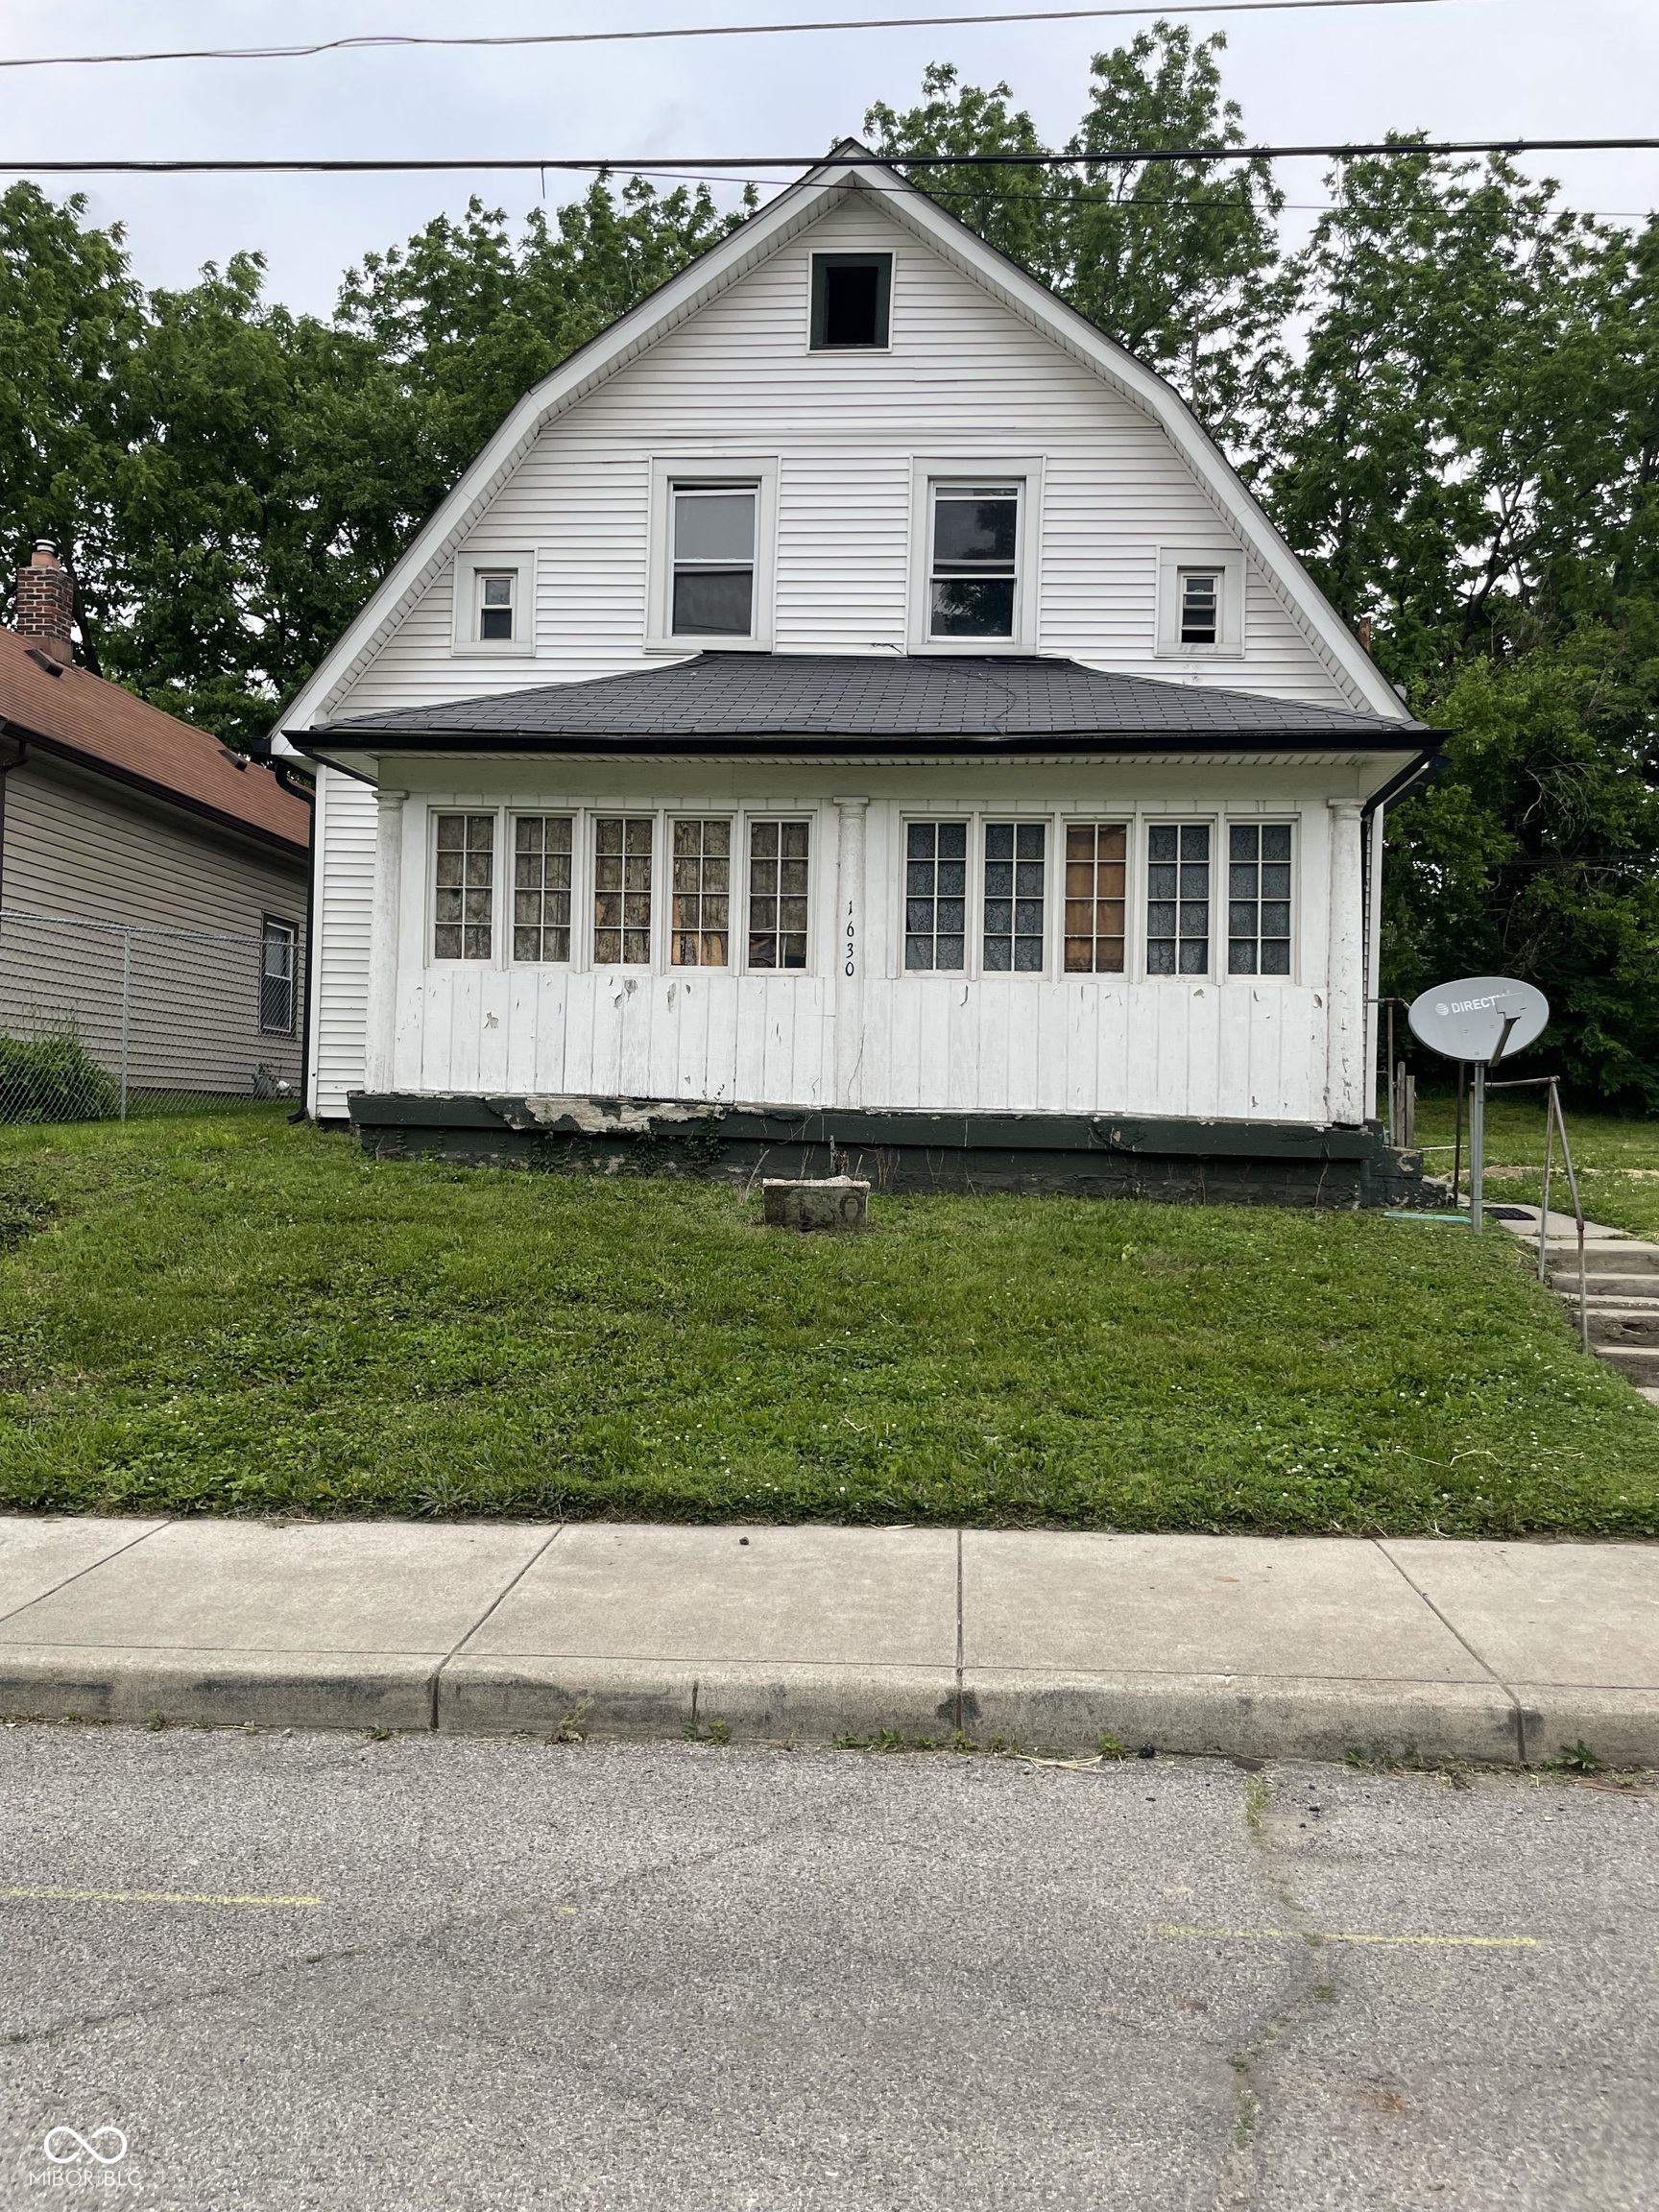
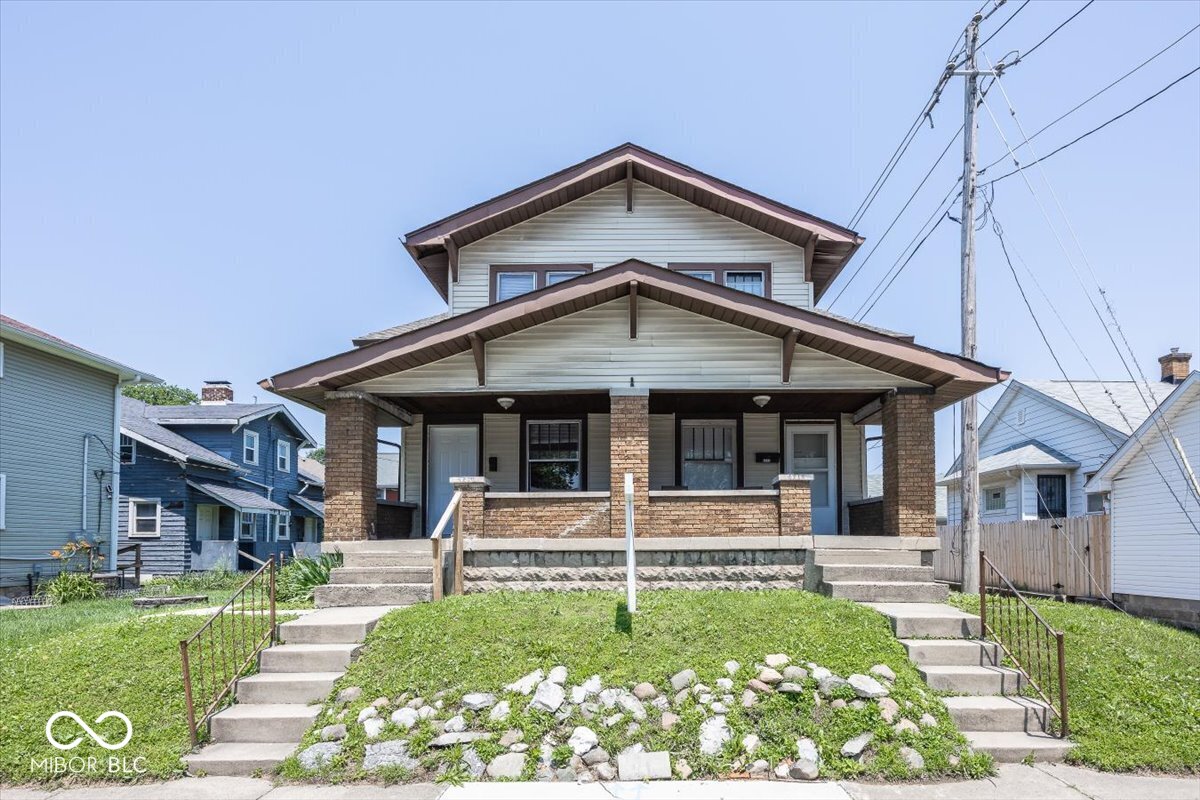
Pending
$112,000
3
bds
|
1
ba
|
1,600
sqft
|
built
1910
1630 E 18th St, Indianapolis, IN 46218
$116
Cash flow
5.4%
Cash-on-Cash Return
7.4%
Cap rate
0.9%
Rent to Value Ratio
Active
$239,000
3
bds
|
0
ba
|
0
sqft
|
built
1910
4114 E Washington St, Indianapolis, IN 46201
$-534
Cash flow
-11.7%
Cash-on-Cash Return
3.5%
Cap rate
0.4%
Rent to Value Ratio
Active
$1,250,000
4
bds
|
5
ba
|
6,882
sqft
|
built
1988
3748 Bay Road South Dr, Indianapolis, IN 46240
$-2,612
Cash flow
-10.9%
Cash-on-Cash Return
3.6%
Cap rate
0.5%
Rent to Value Ratio
Active
$575,000
4
bds
|
4
ba
|
2,240
sqft
|
built
1910
48 N Audubon Rd, Indianapolis, IN 46219
$-1,220
Cash flow
-11.1%
Cash-on-Cash Return
3.6%
Cap rate
0.4%
Rent to Value Ratio
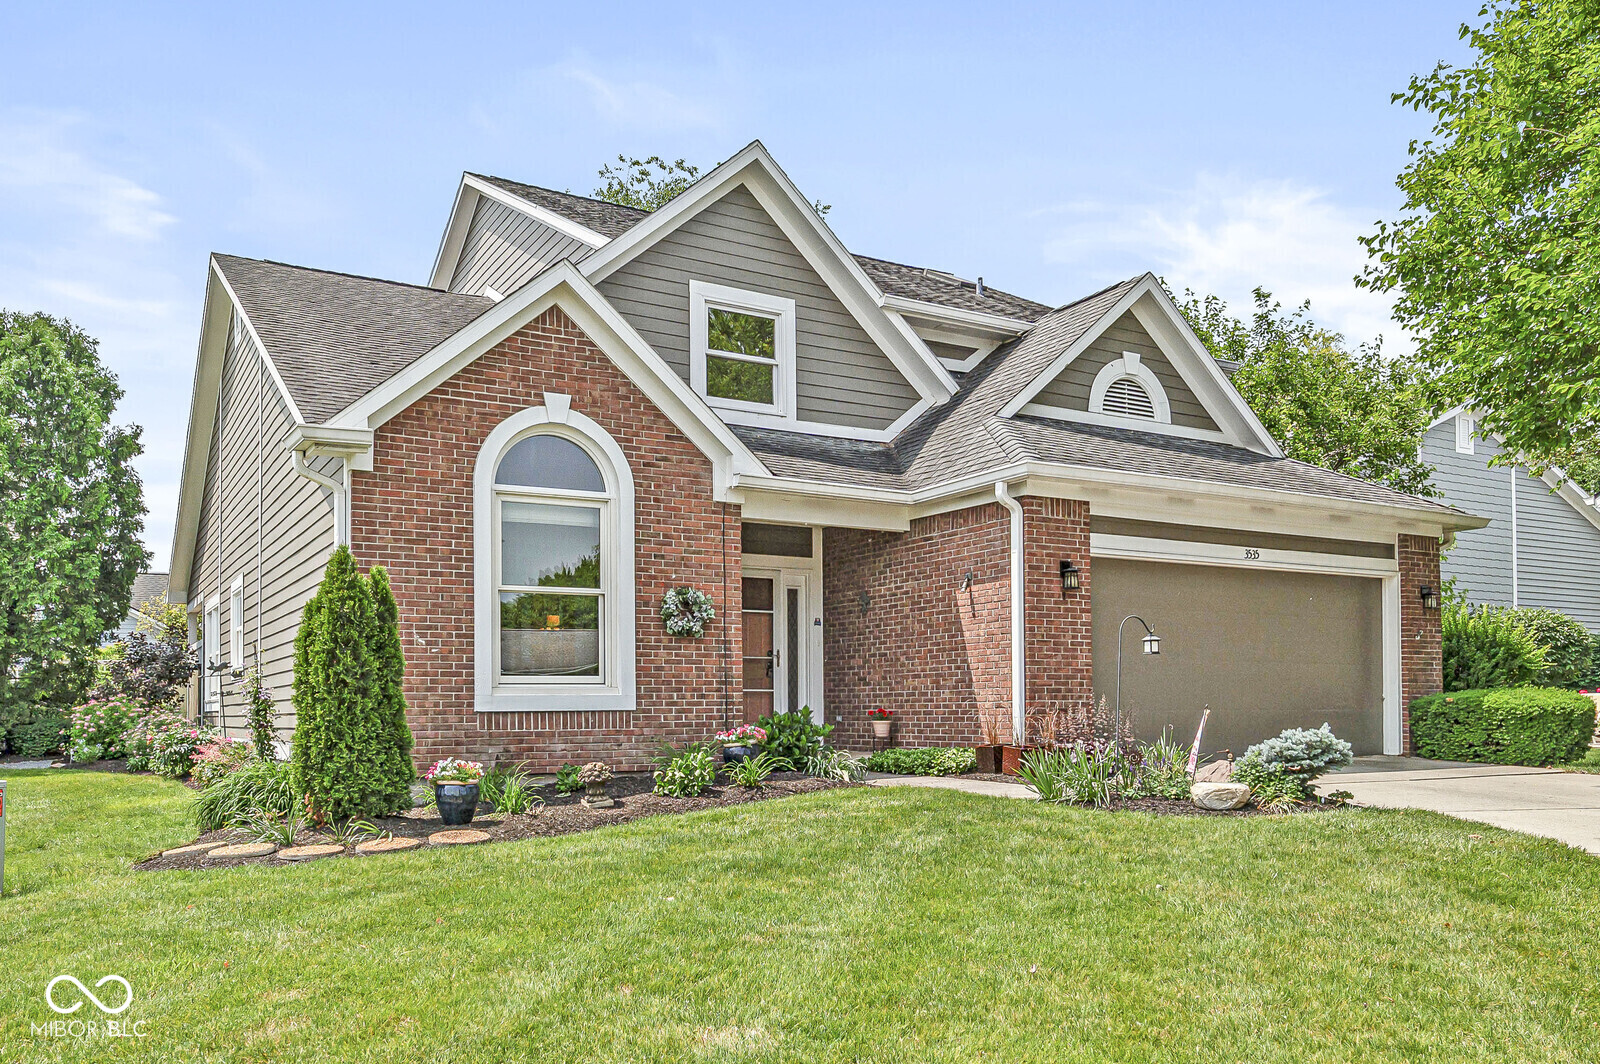
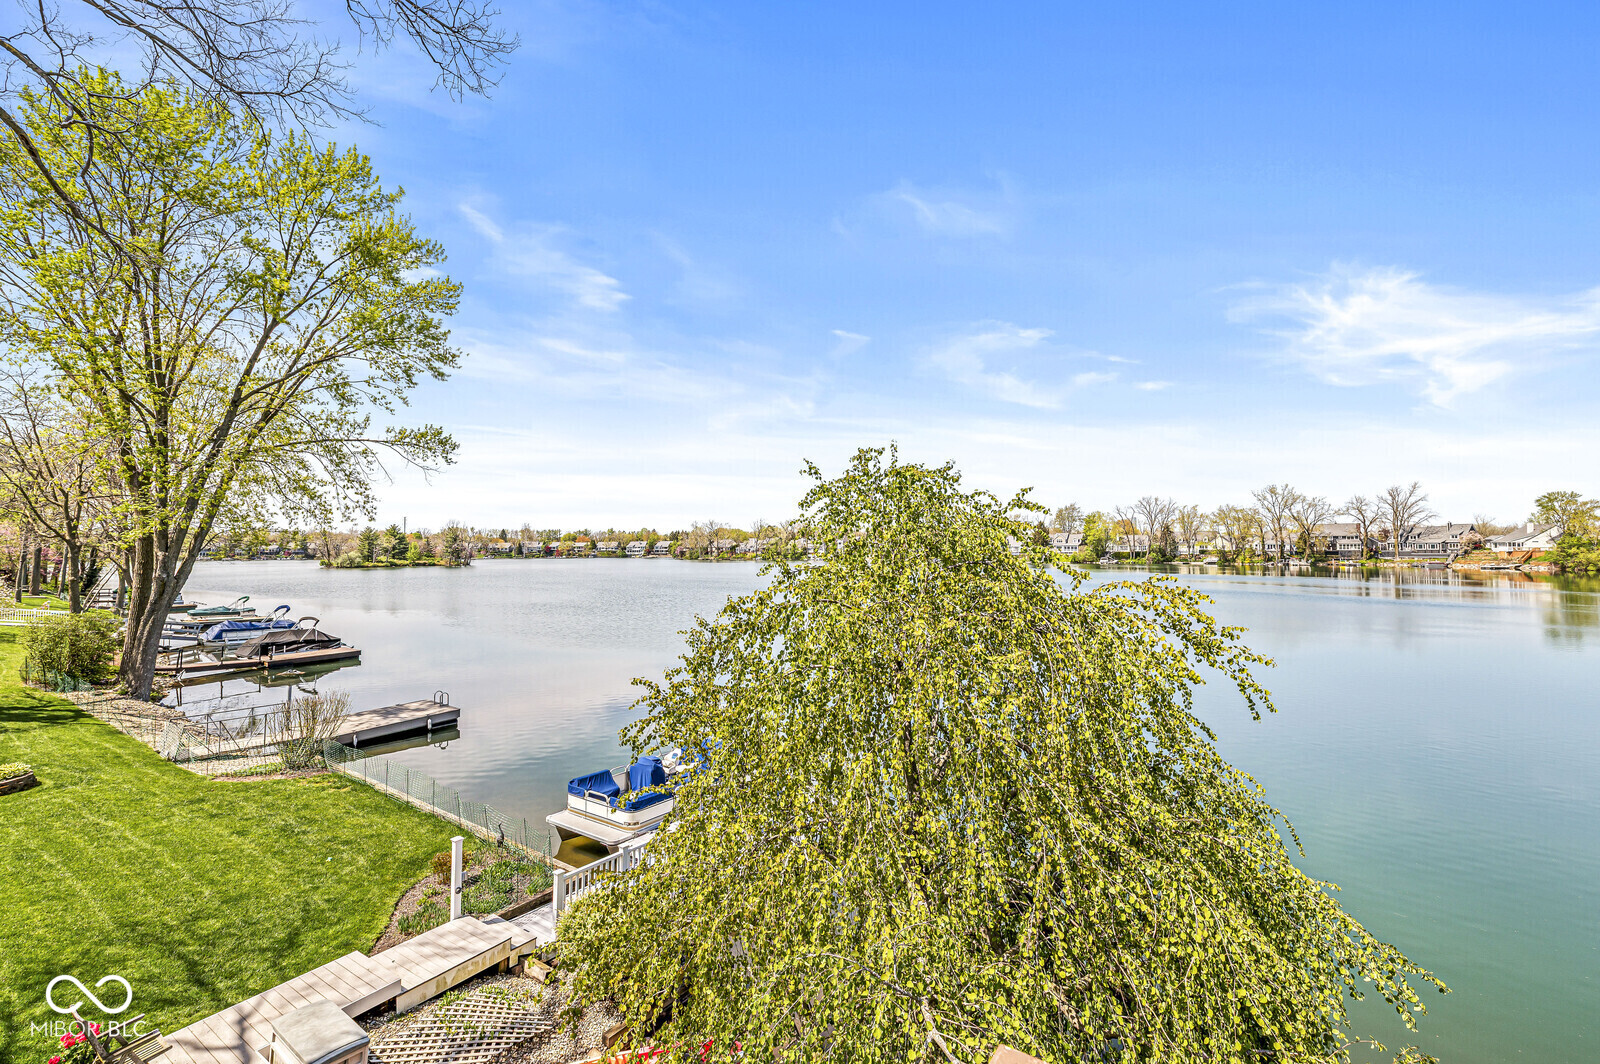
Pending
$525,000
3
bds
|
3
ba
|
2,434
sqft
|
built
1992
3535 Clearwater Cir, Indianapolis, IN 46240
$-1,045
Cash flow
-10.4%
Cash-on-Cash Return
3.8%
Cap rate
0.6%
Rent to Value Ratio

Active
$275,000
2
bds
|
0
ba
|
0
sqft
|
built
1915
3707 N Kenwood Ave, Indianapolis, IN 46208
$-305
Cash flow
-5.8%
Cash-on-Cash Return
4.8%
Cap rate
0.6%
Rent to Value Ratio
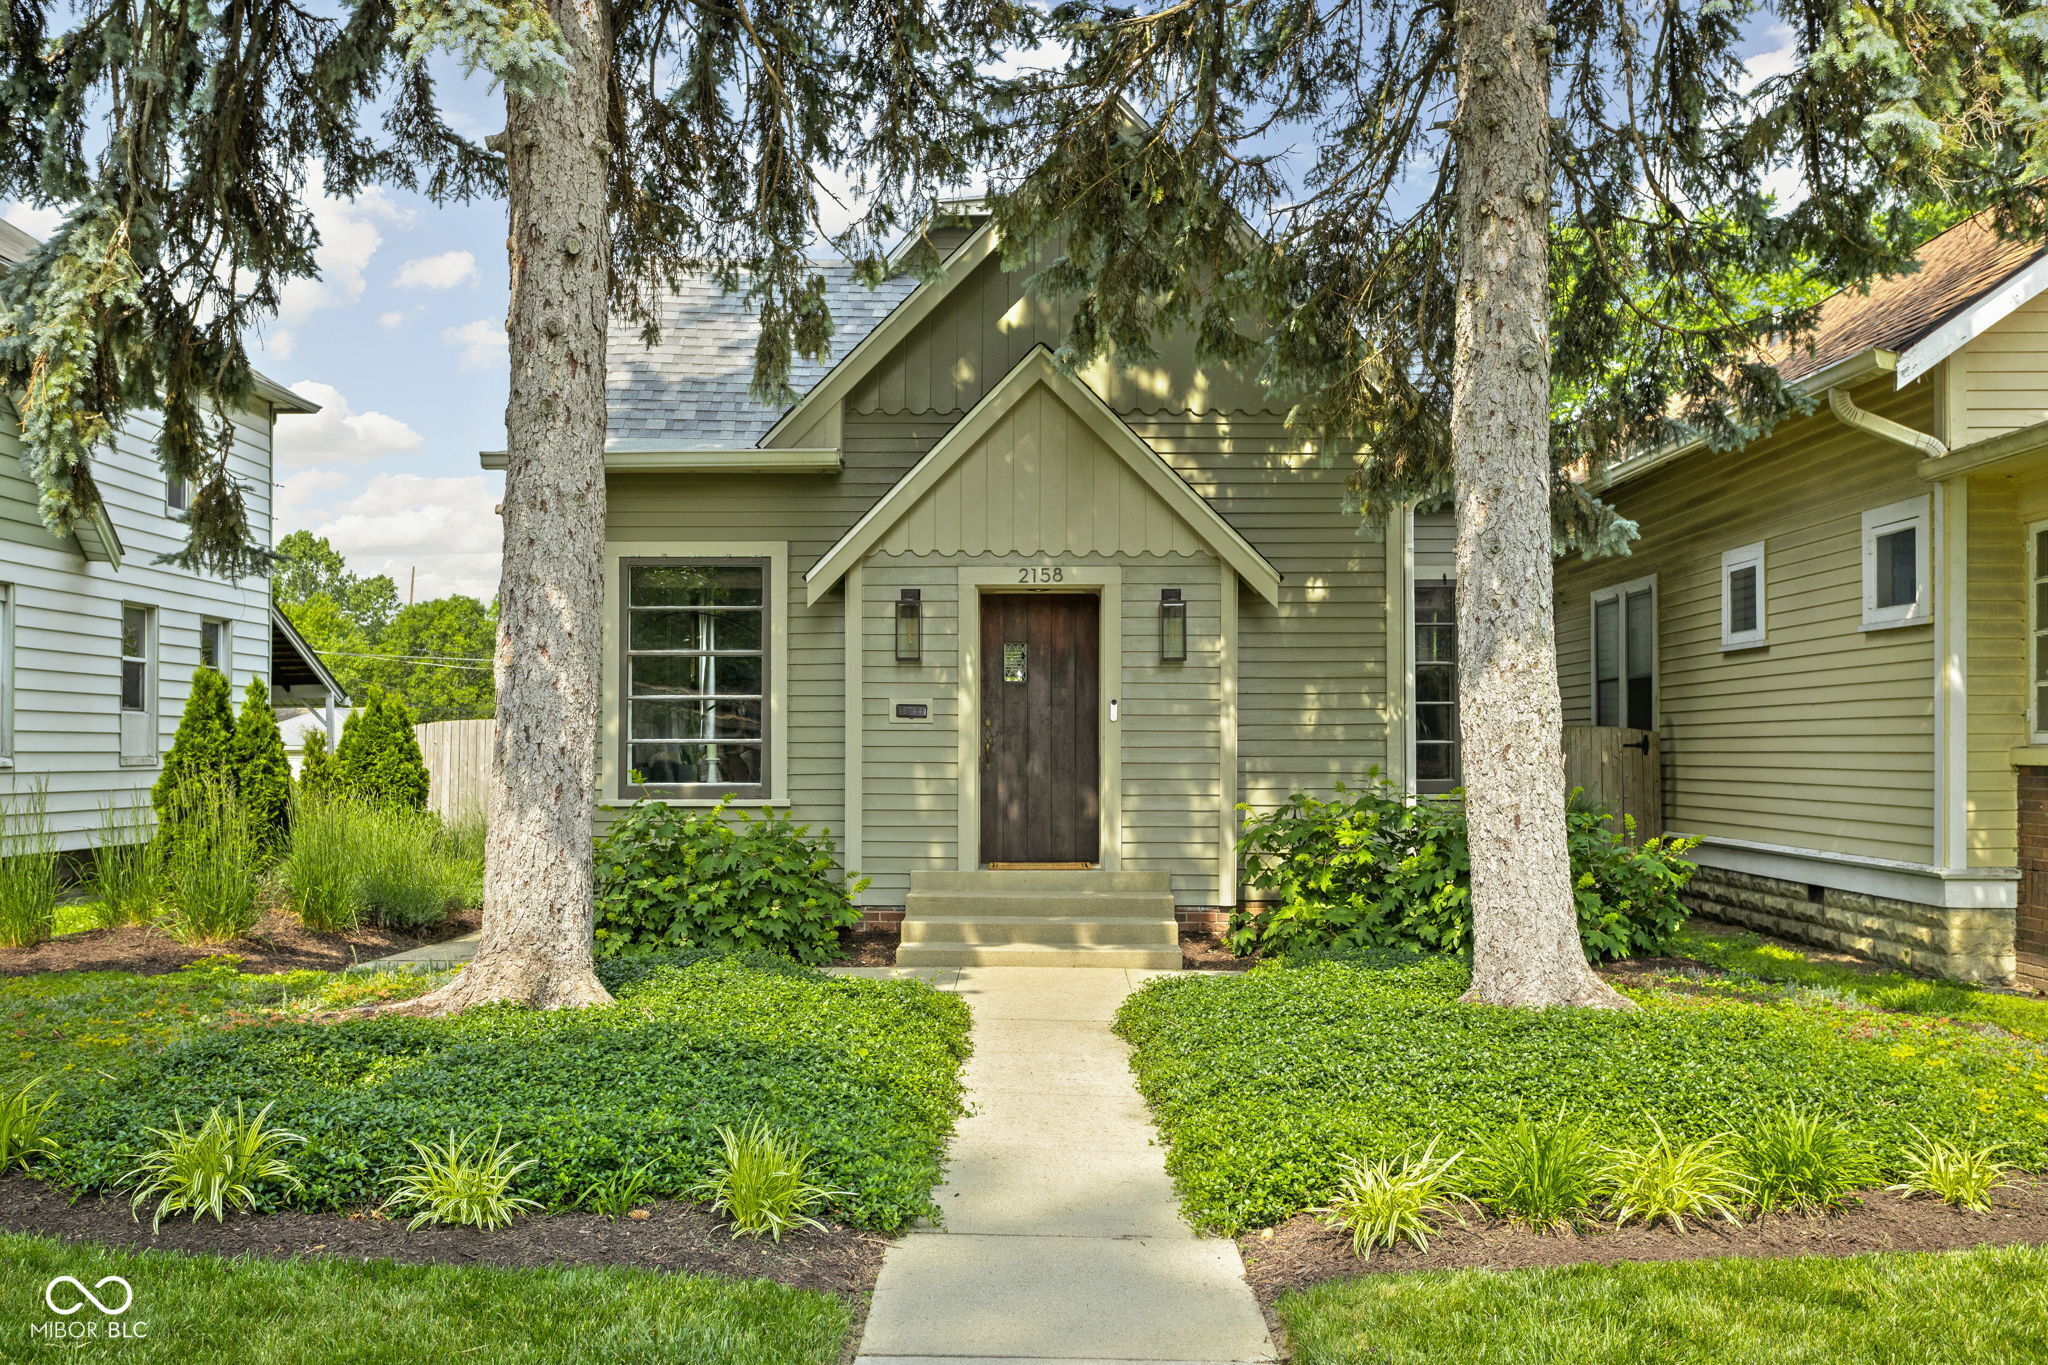
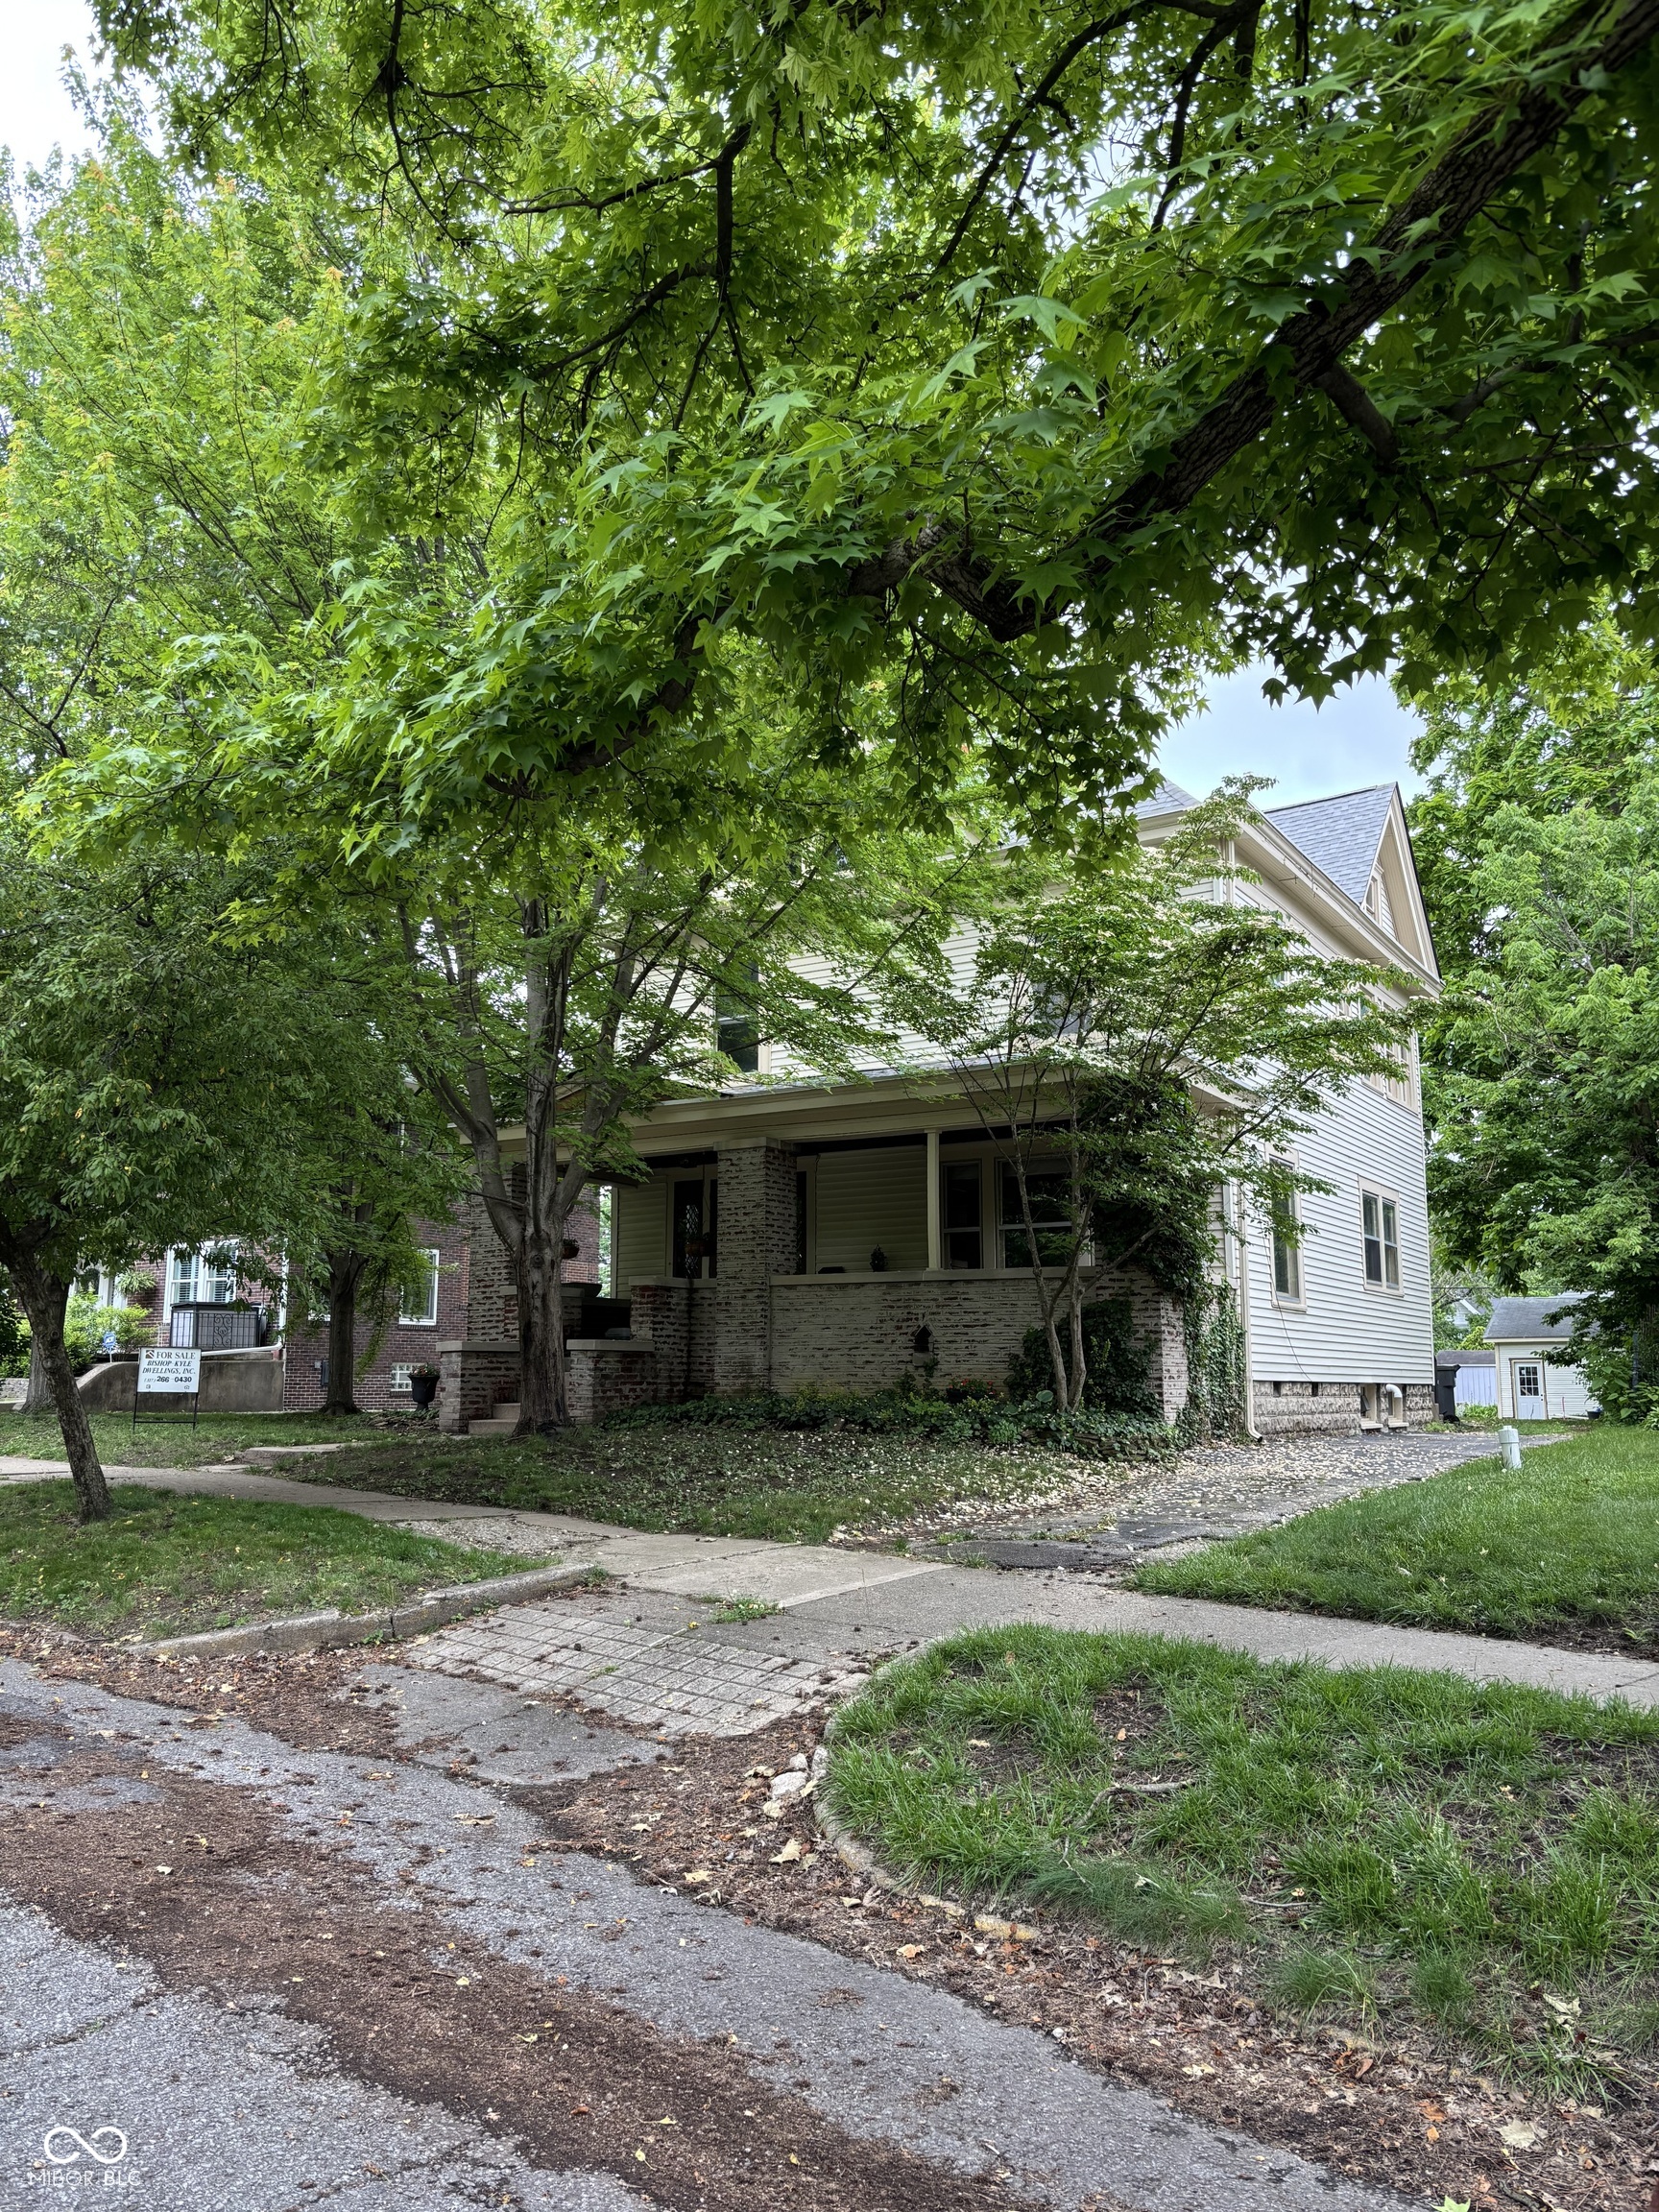
Active
$315,000
3
bds
|
1
ba
|
1,251
sqft
|
built
1906
2158 S Garfield Dr, Indianapolis, IN 46203
$-96
Cash flow
-1.6%
Cash-on-Cash Return
5.8%
Cap rate
0.7%
Rent to Value Ratio
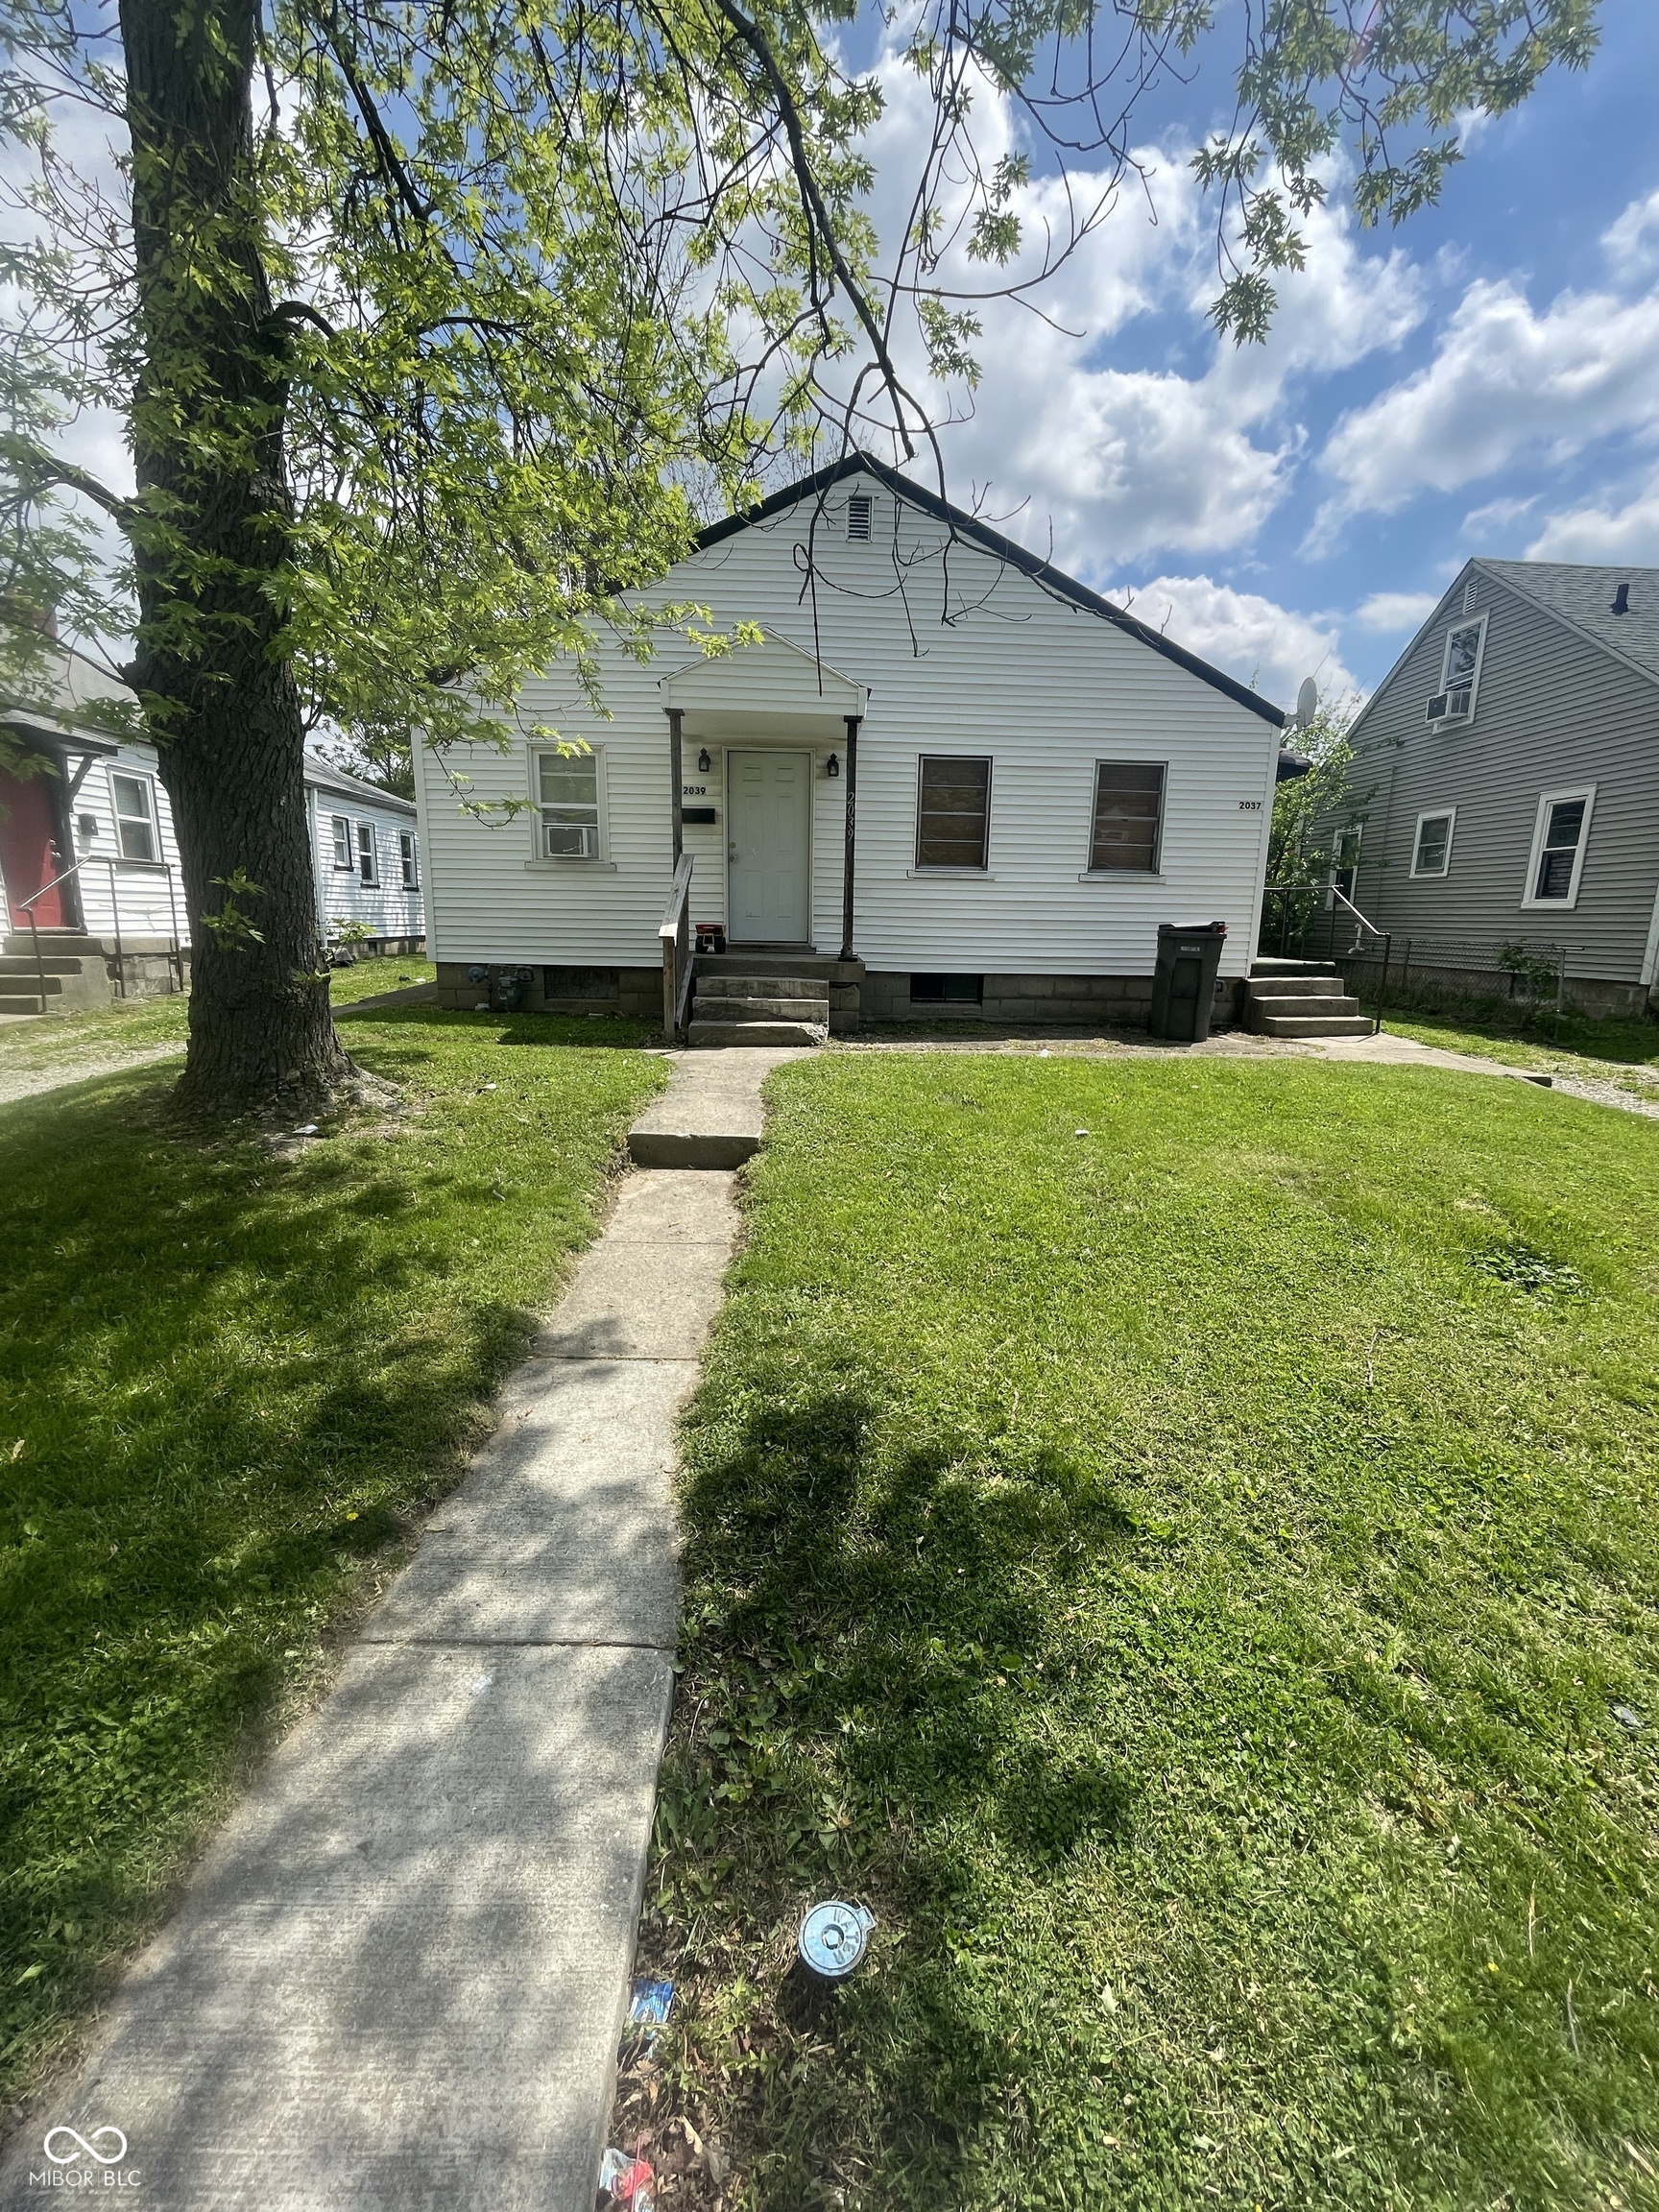
Active
$150,000
2
bds
|
0
ba
|
0
sqft
|
built
1949
2037 Glenridge Dr, Indianapolis, IN 46218
$-147
Cash flow
-5.1%
Cash-on-Cash Return
5.0%
Cap rate
0.6%
Rent to Value Ratio
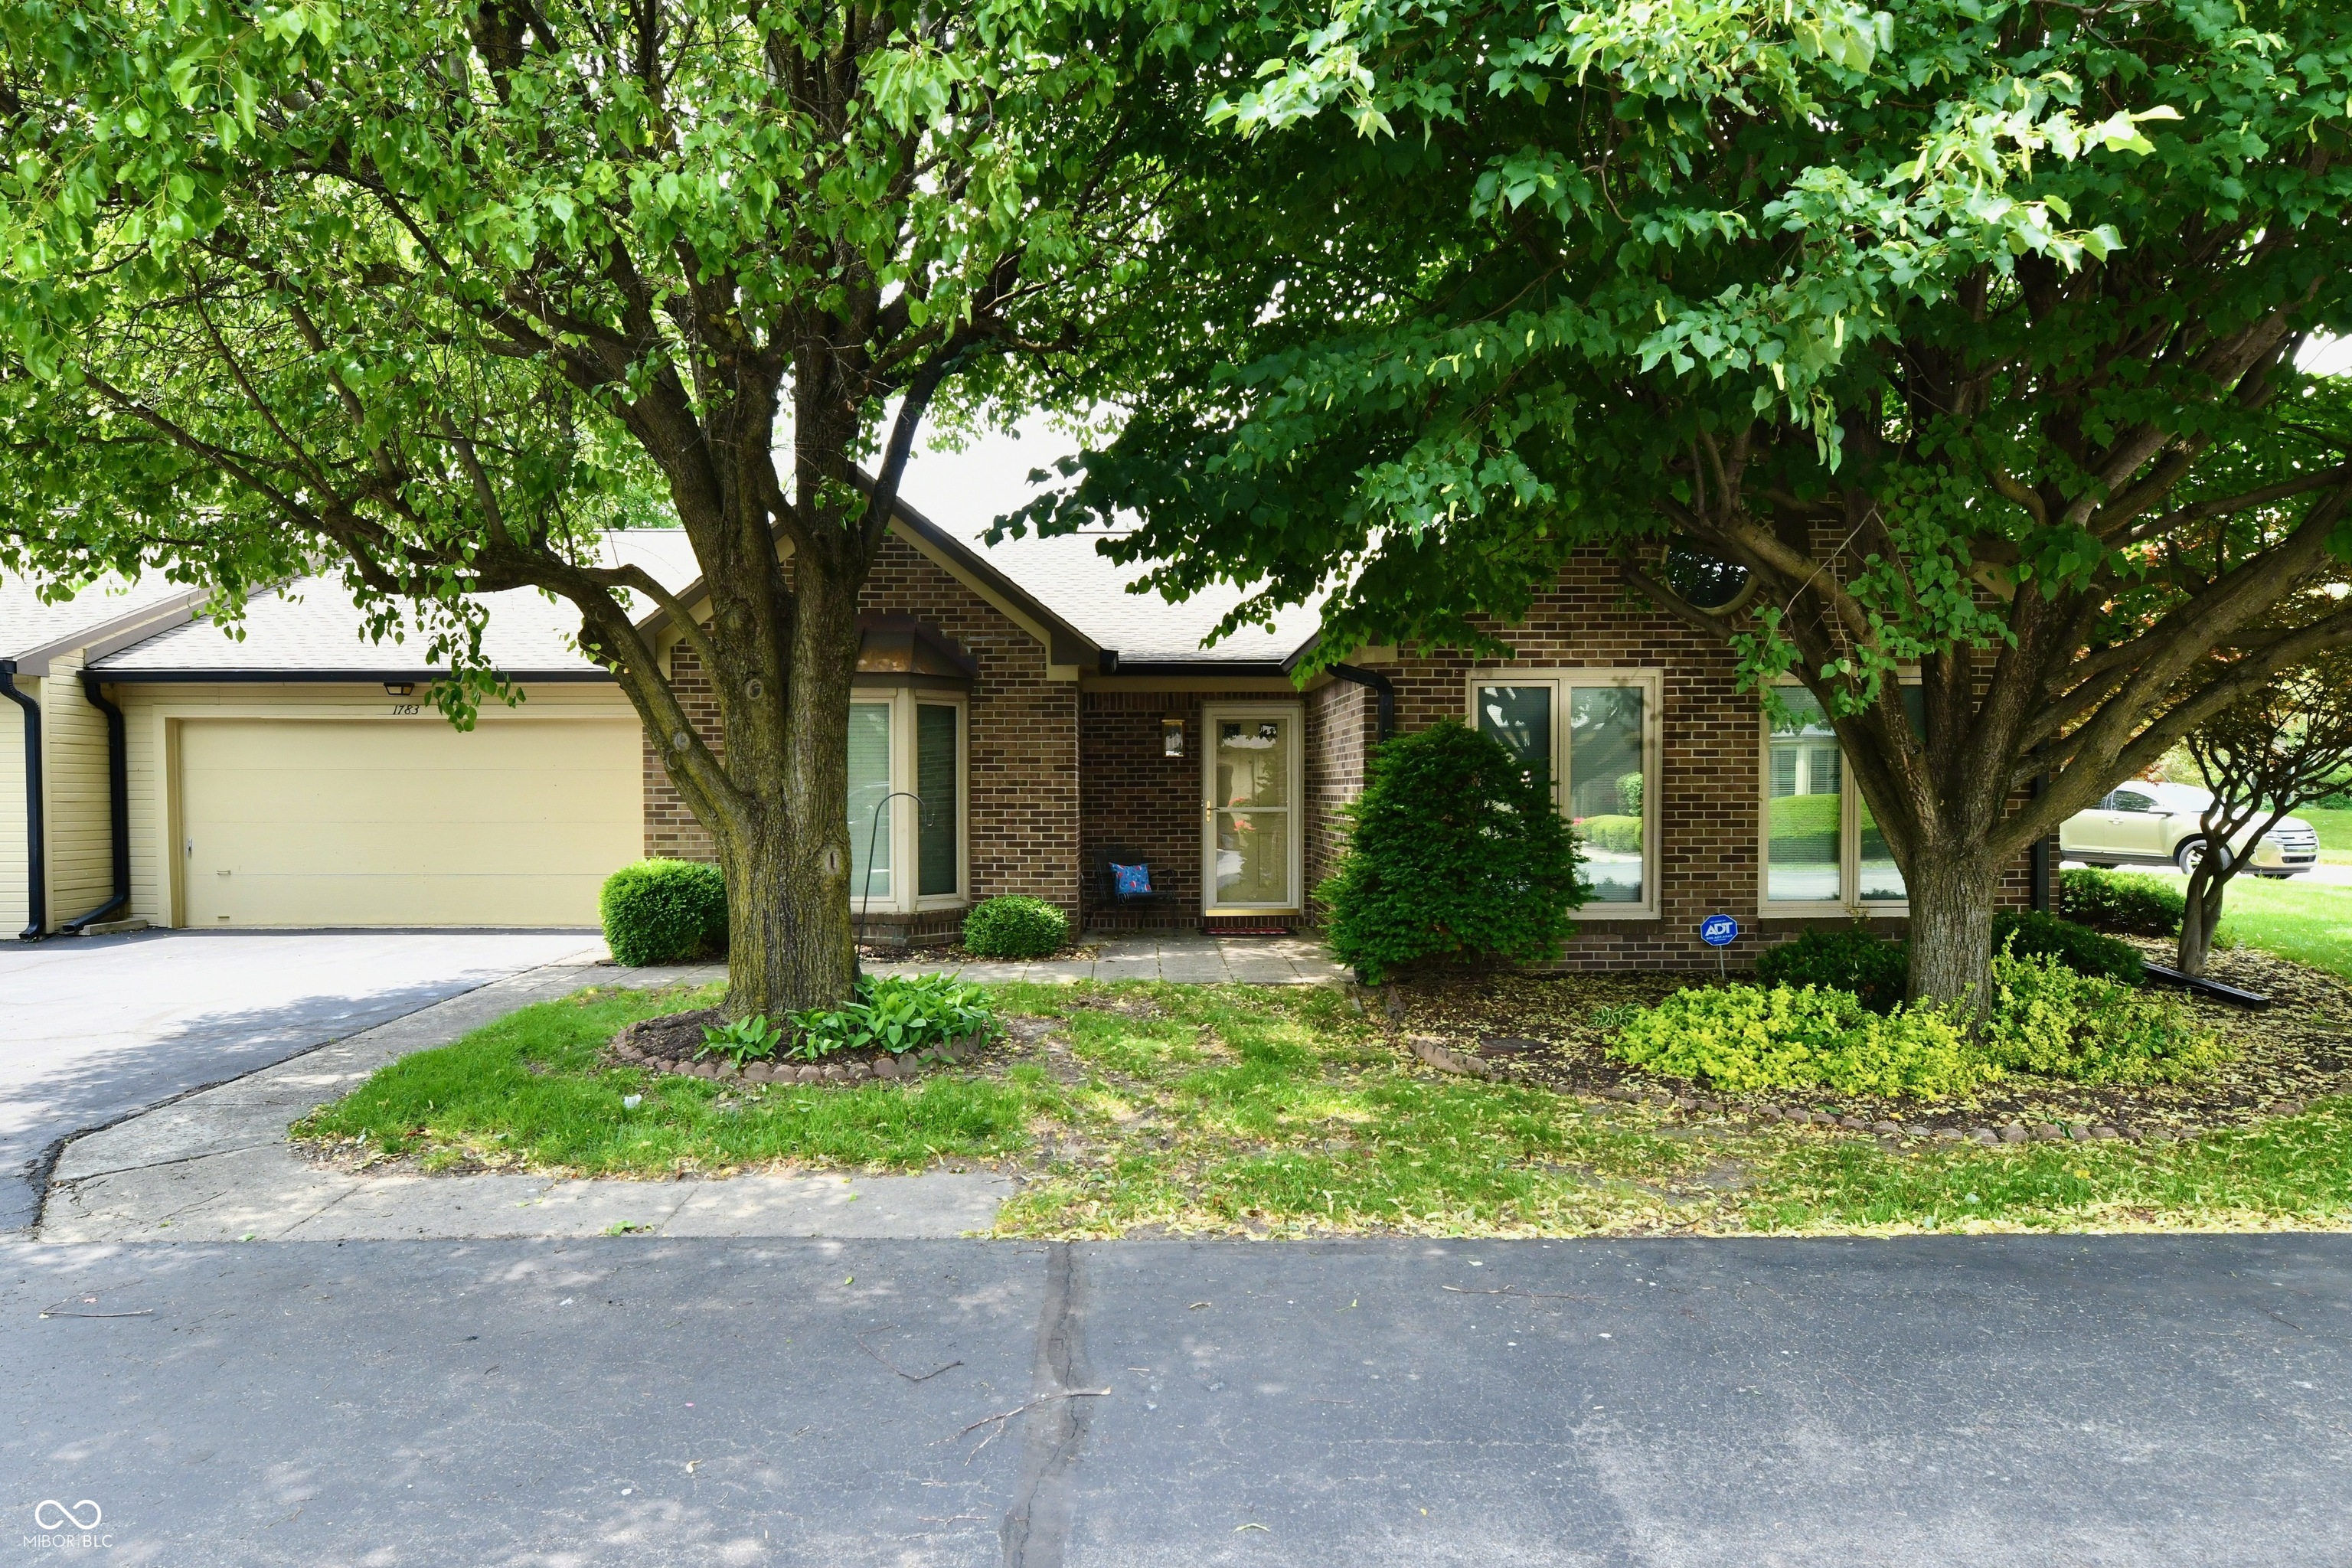
Pending
$295,000
3
bds
|
2
ba
|
2,041
sqft
|
built
1988
1783 Cloister Dr, Indianapolis, IN 46260
$-369
Cash flow
-6.5%
Cash-on-Cash Return
4.6%
Cap rate
0.7%
Rent to Value Ratio
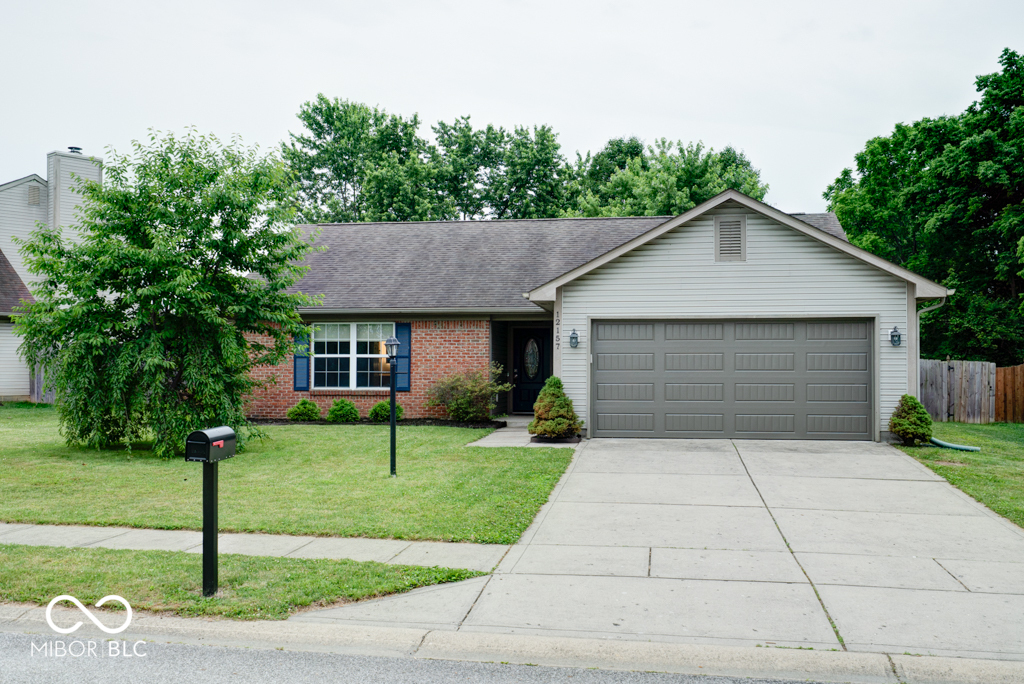
Active
$292,900
3
bds
|
2
ba
|
1,264
sqft
|
built
1994
12157 Longstraw Dr, Indianapolis, IN 46236
$-132
Cash flow
-2.4%
Cash-on-Cash Return
5.6%
Cap rate
0.7%
Rent to Value Ratio
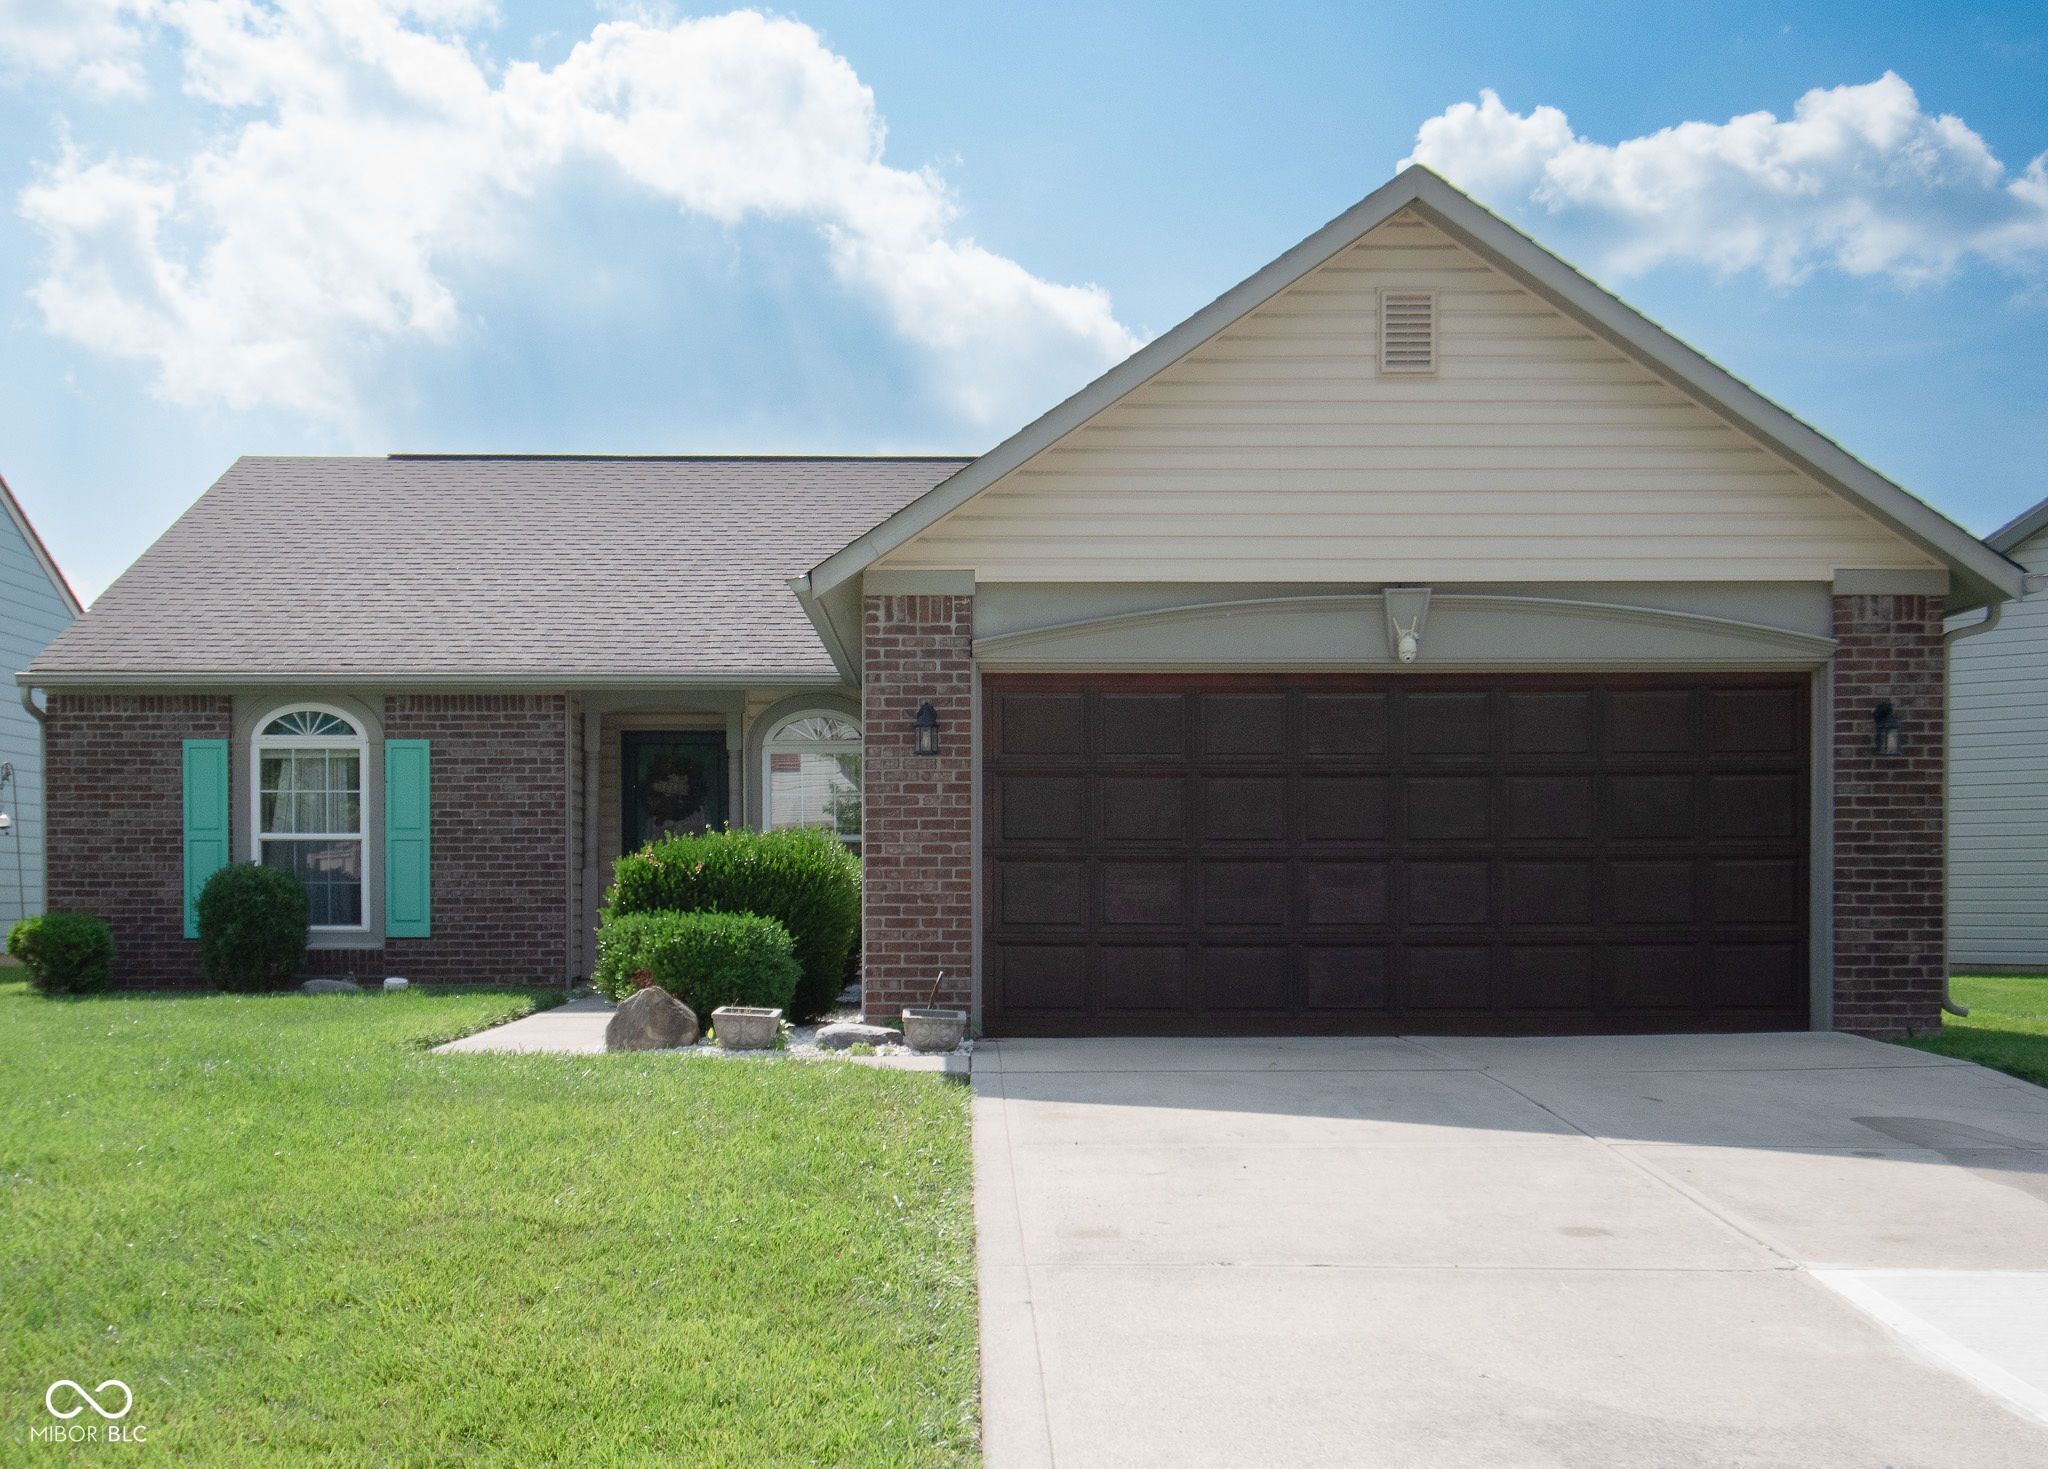
Active
$230,000
3
bds
|
2
ba
|
1,355
sqft
|
built
2000
540 Cahill Ln, Indianapolis, IN 46214
$27
Cash flow
0.6%
Cash-on-Cash Return
6.3%
Cap rate
0.8%
Rent to Value Ratio
Active
$514,900
7
bds
|
5
ba
|
6,219
sqft
|
built
1996
7138 Nile Ridge Ct, Indianapolis, IN 46236
$-298
Cash flow
-3.0%
Cash-on-Cash Return
5.5%
Cap rate
0.7%
Rent to Value Ratio
Active
$1,500,000
2
bds
|
2
ba
|
5,500
sqft
|
built
1915
3959 Central Ave, Indianapolis, IN 46205
$-6,304
Cash flow
-21.9%
Cash-on-Cash Return
1.1%
Cap rate
0.1%
Rent to Value Ratio
Active
$174,900
2
bds
|
1
ba
|
1,155
sqft
|
built
1910
714 S Keystone Ave, Indianapolis, IN 46203
$1
Cash flow
0.0%
Cash-on-Cash Return
6.2%
Cap rate
0.7%
Rent to Value Ratio
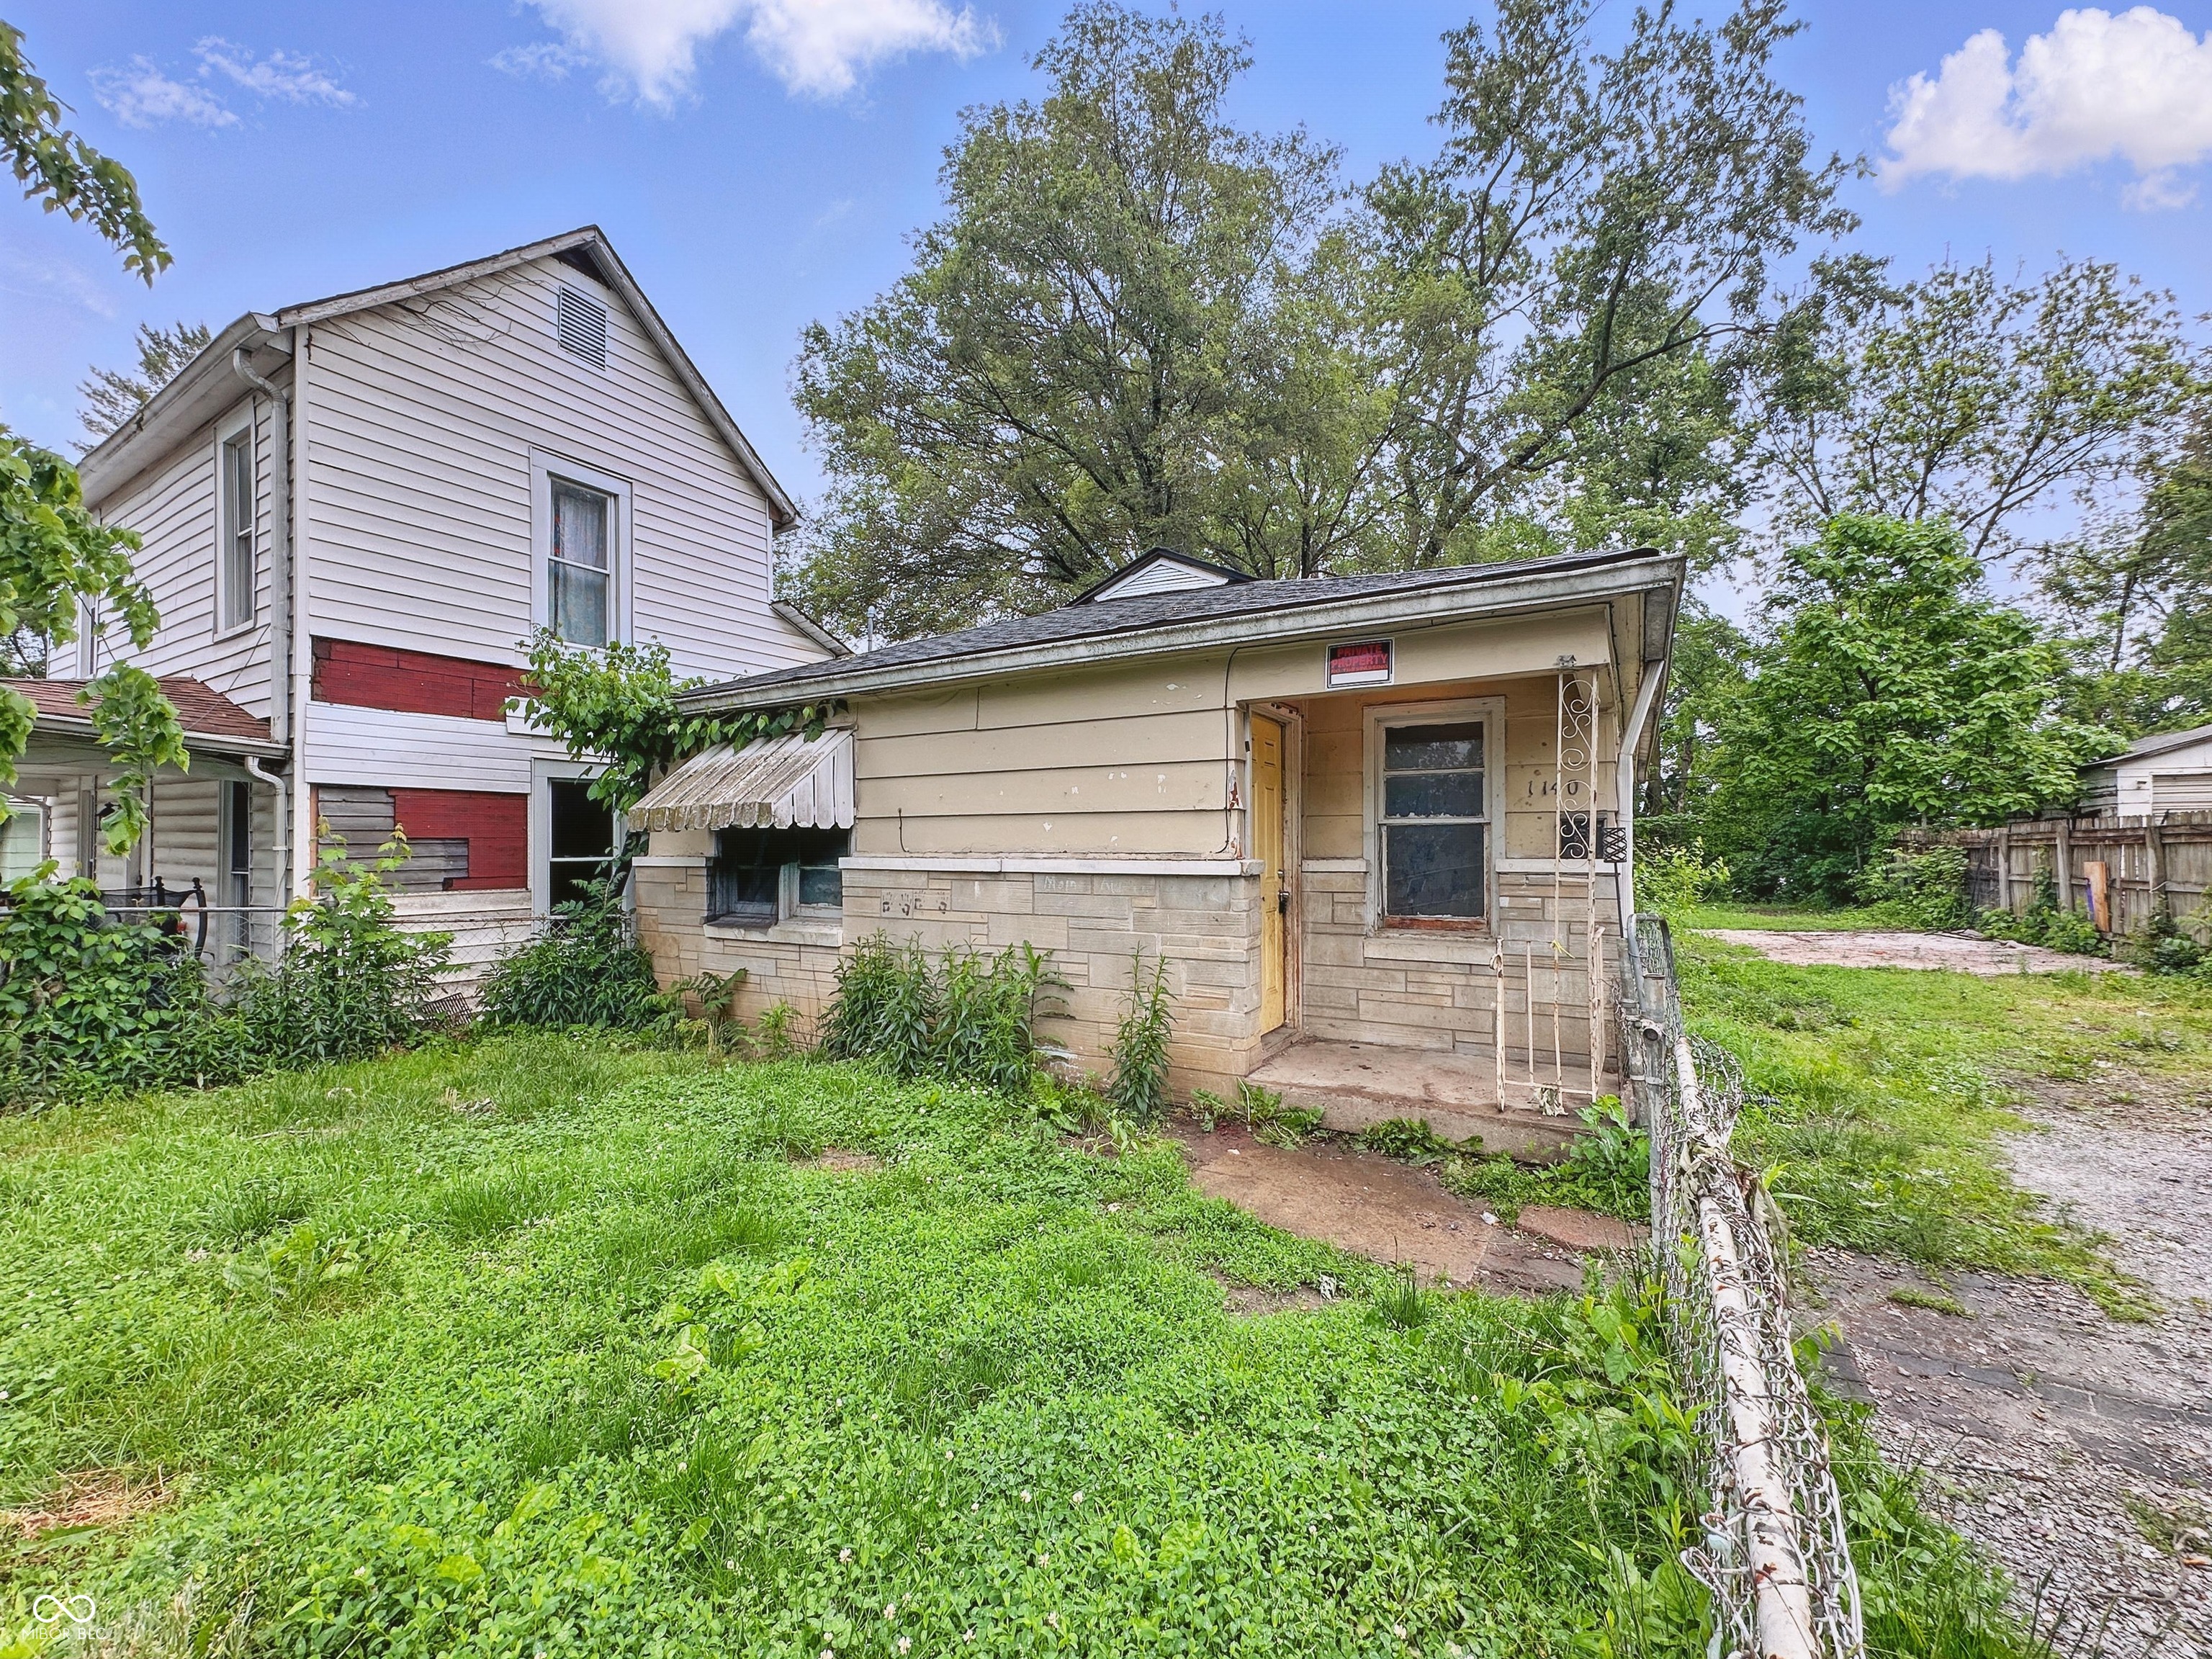
Active
$104,900
2
bds
|
1
ba
|
840
sqft
|
built
1958
1140 Mc Dougal St, Indianapolis, IN 46203
$222
Cash flow
11.0%
Cash-on-Cash Return
8.7%
Cap rate
1.0%
Rent to Value Ratio
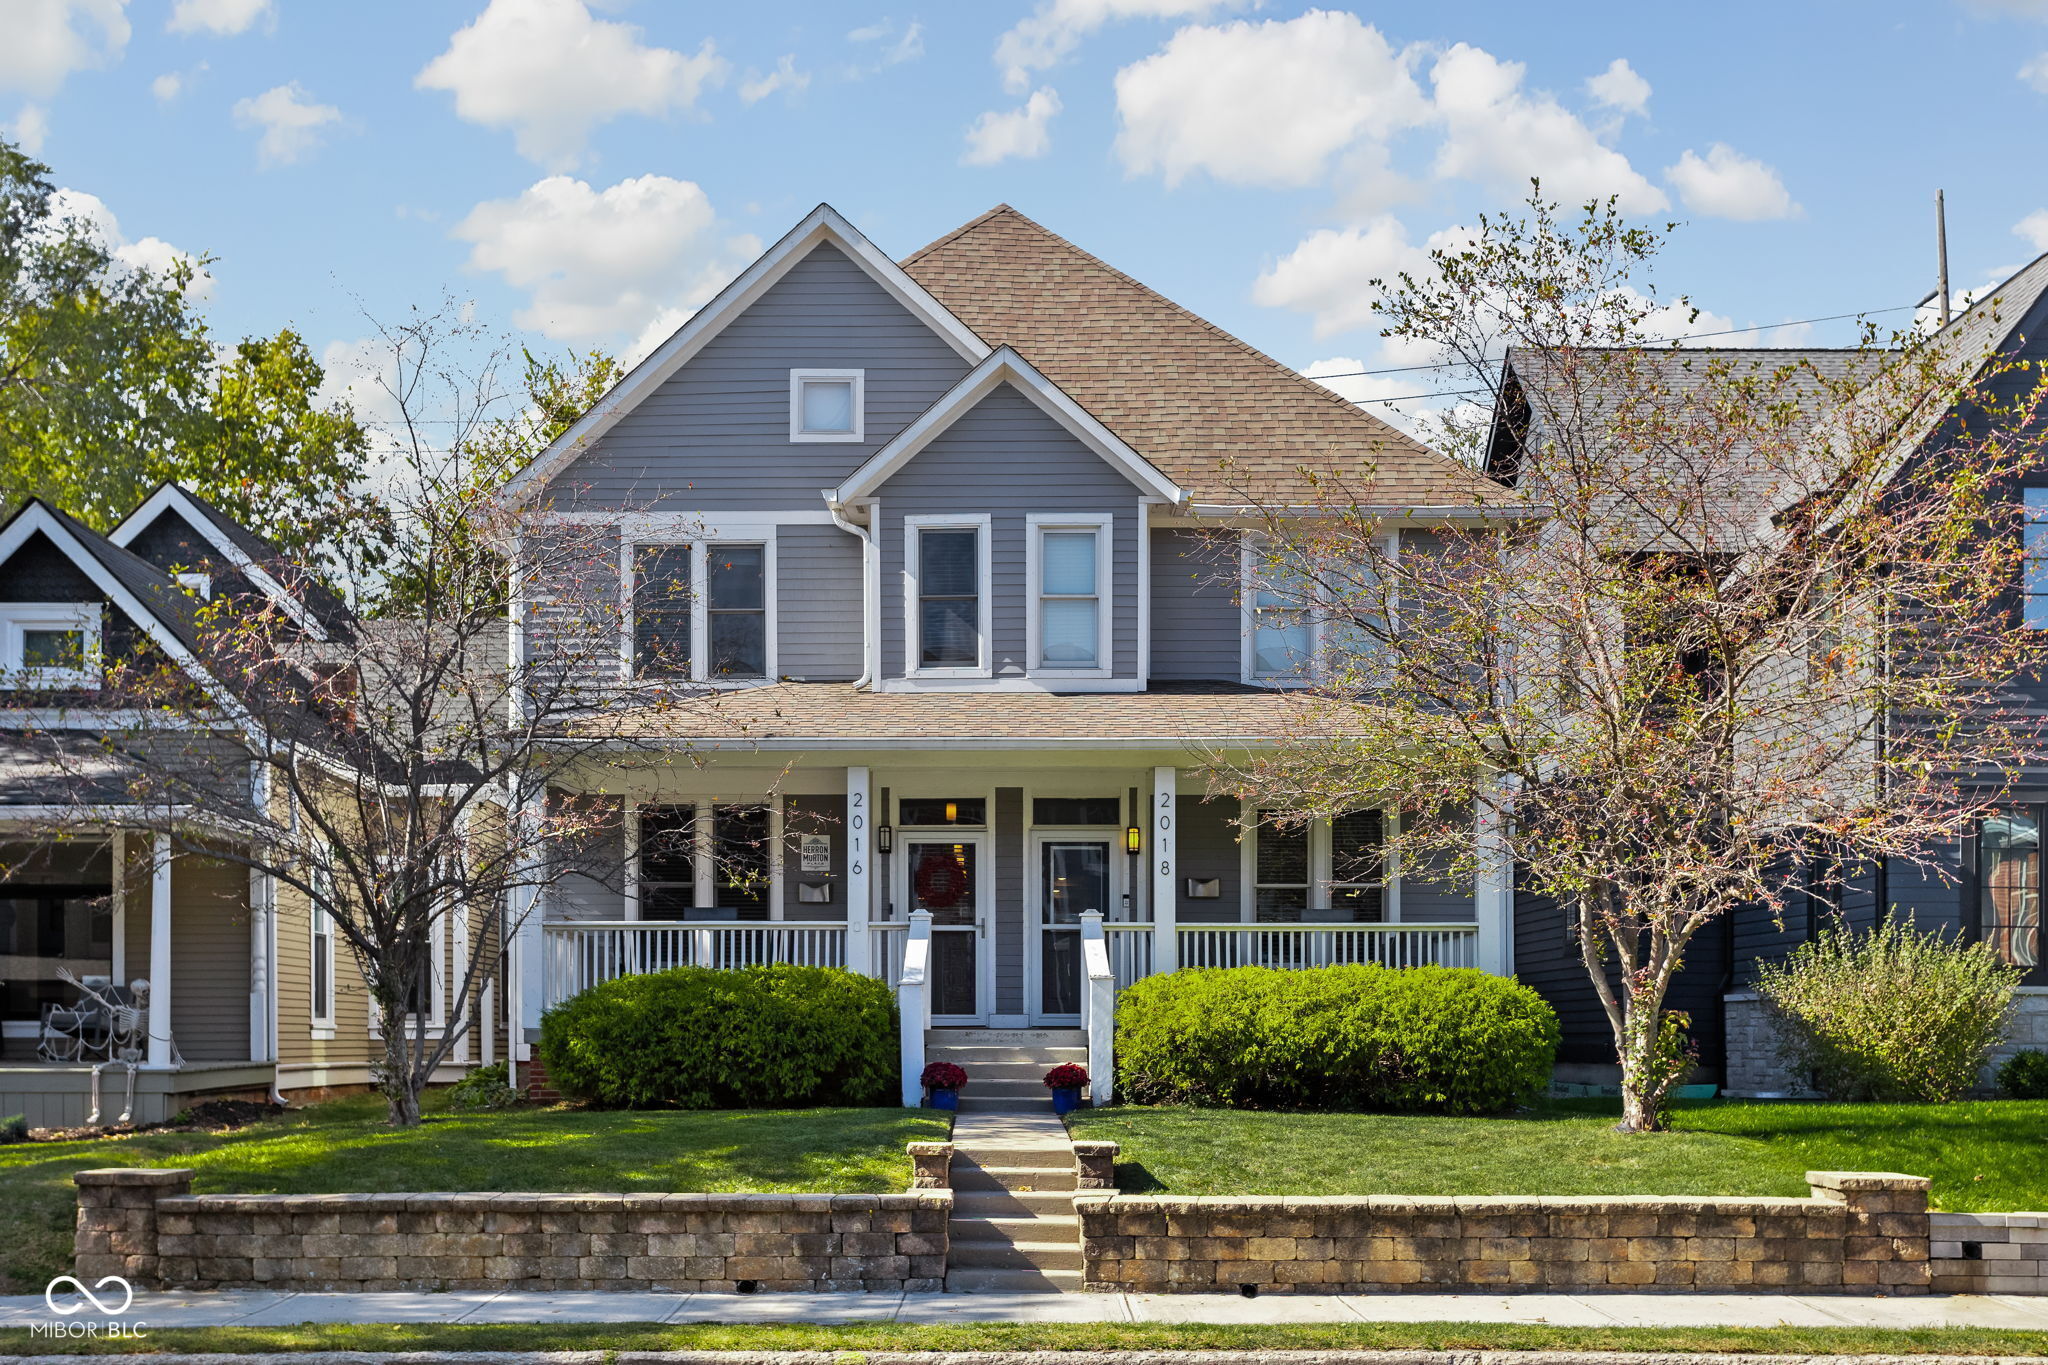
Active
$499,900
3
bds
|
4
ba
|
3,366
sqft
|
built
2008
2016 Central Ave, Indianapolis, IN 46202
$-77
Cash flow
-0.8%
Cash-on-Cash Return
6.0%
Cap rate
0.7%
Rent to Value Ratio
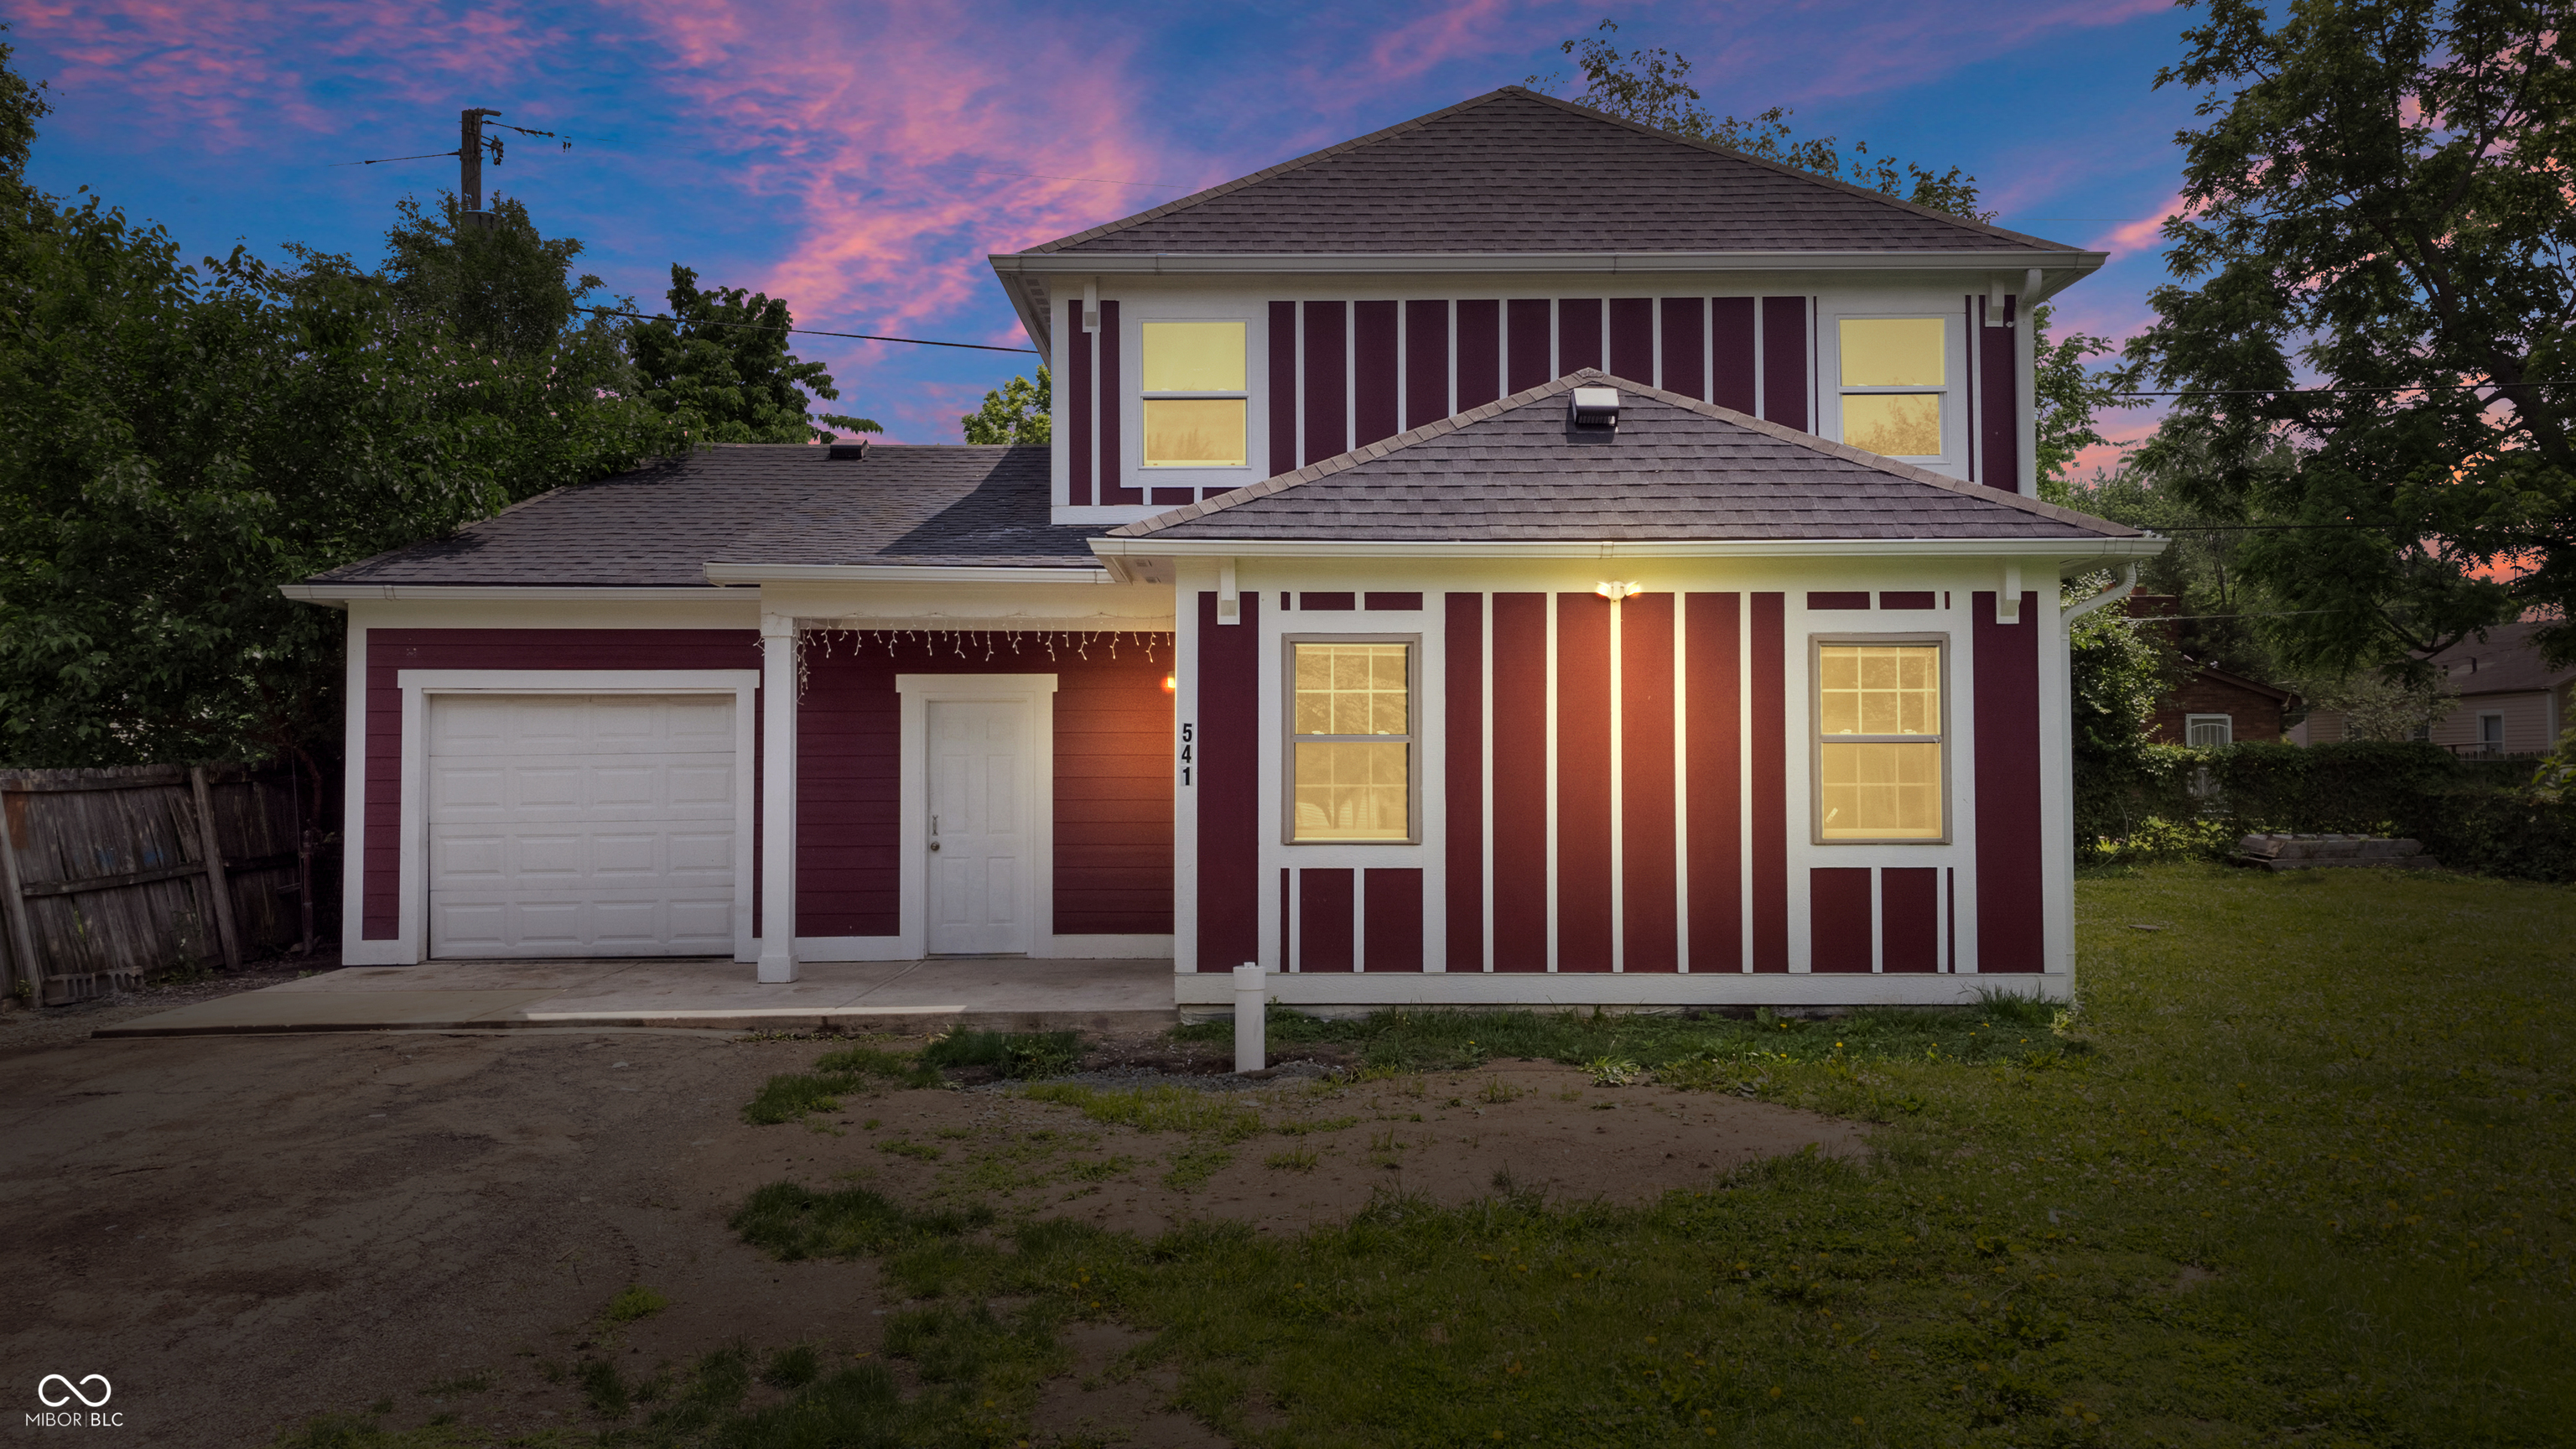
Active
$254,000
4
bds
|
2
ba
|
2,441
sqft
|
built
1948
541 Dayton Ave, Indianapolis, IN 46203
$-59
Cash flow
-1.2%
Cash-on-Cash Return
5.9%
Cap rate
0.7%
Rent to Value Ratio
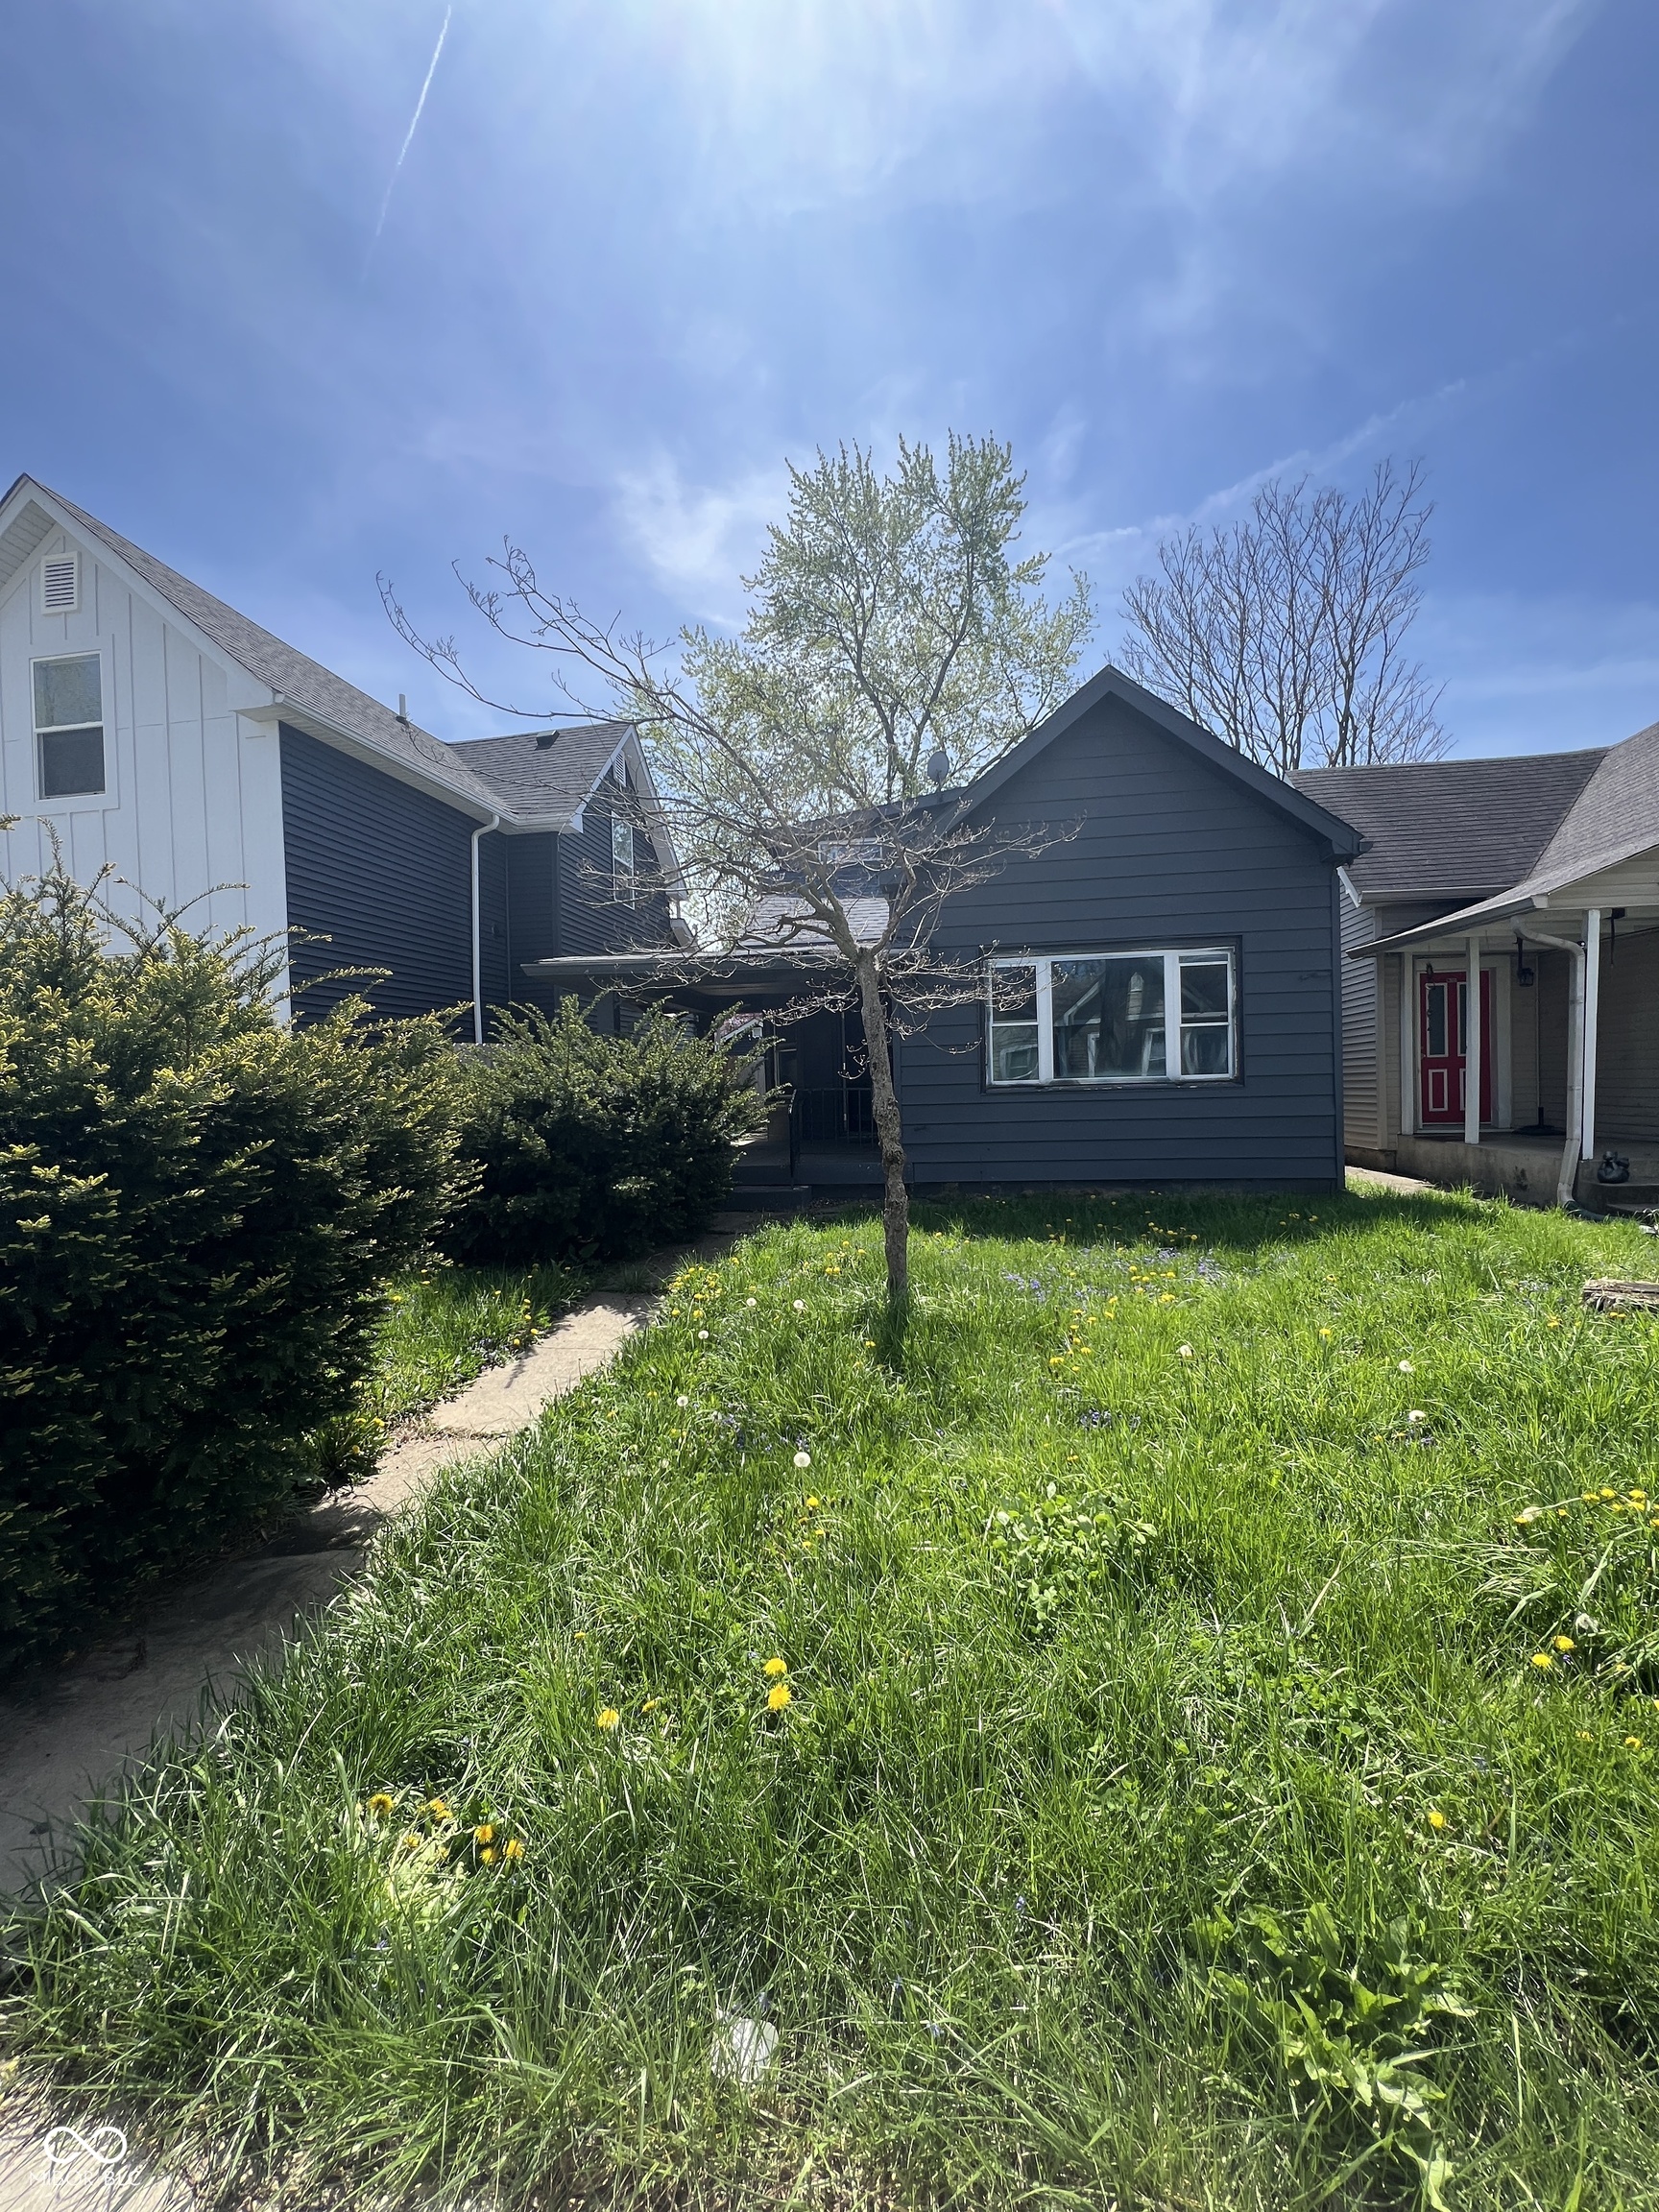
Active
$215,000
4
bds
|
1
ba
|
1,459
sqft
|
built
1952
409 Parkway Ave, Indianapolis, IN 46225
$-273
Cash flow
-6.6%
Cash-on-Cash Return
4.6%
Cap rate
0.6%
Rent to Value Ratio
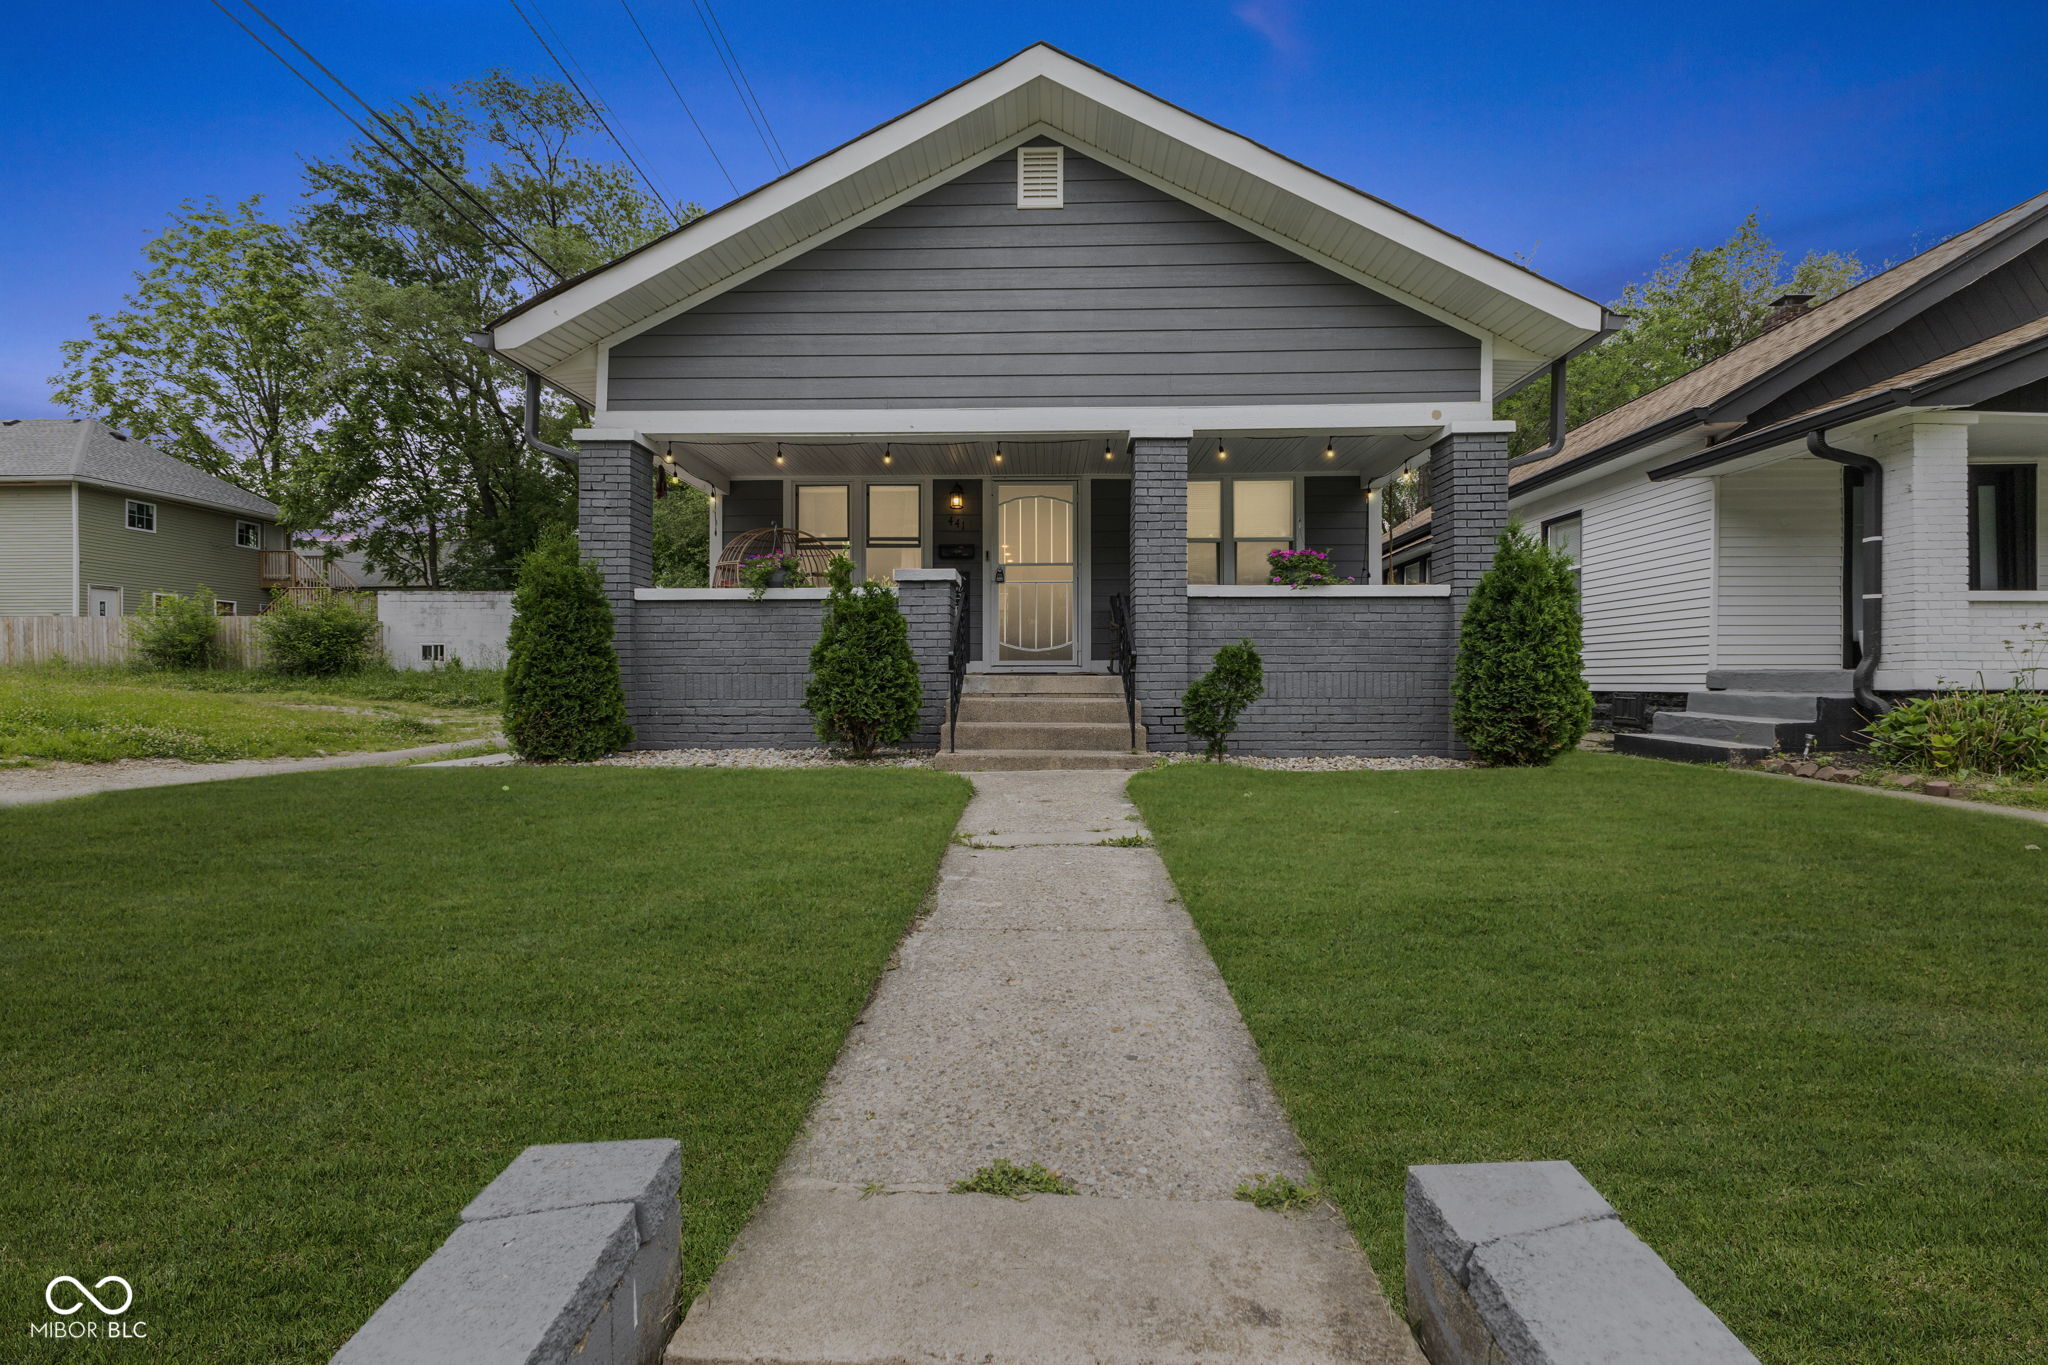
Active
$215,000
3
bds
|
1
ba
|
1,058
sqft
|
built
2018
441 N Temple Ave, Indianapolis, IN 46201
$-135
Cash flow
-3.3%
Cash-on-Cash Return
5.4%
Cap rate
0.7%
Rent to Value Ratio
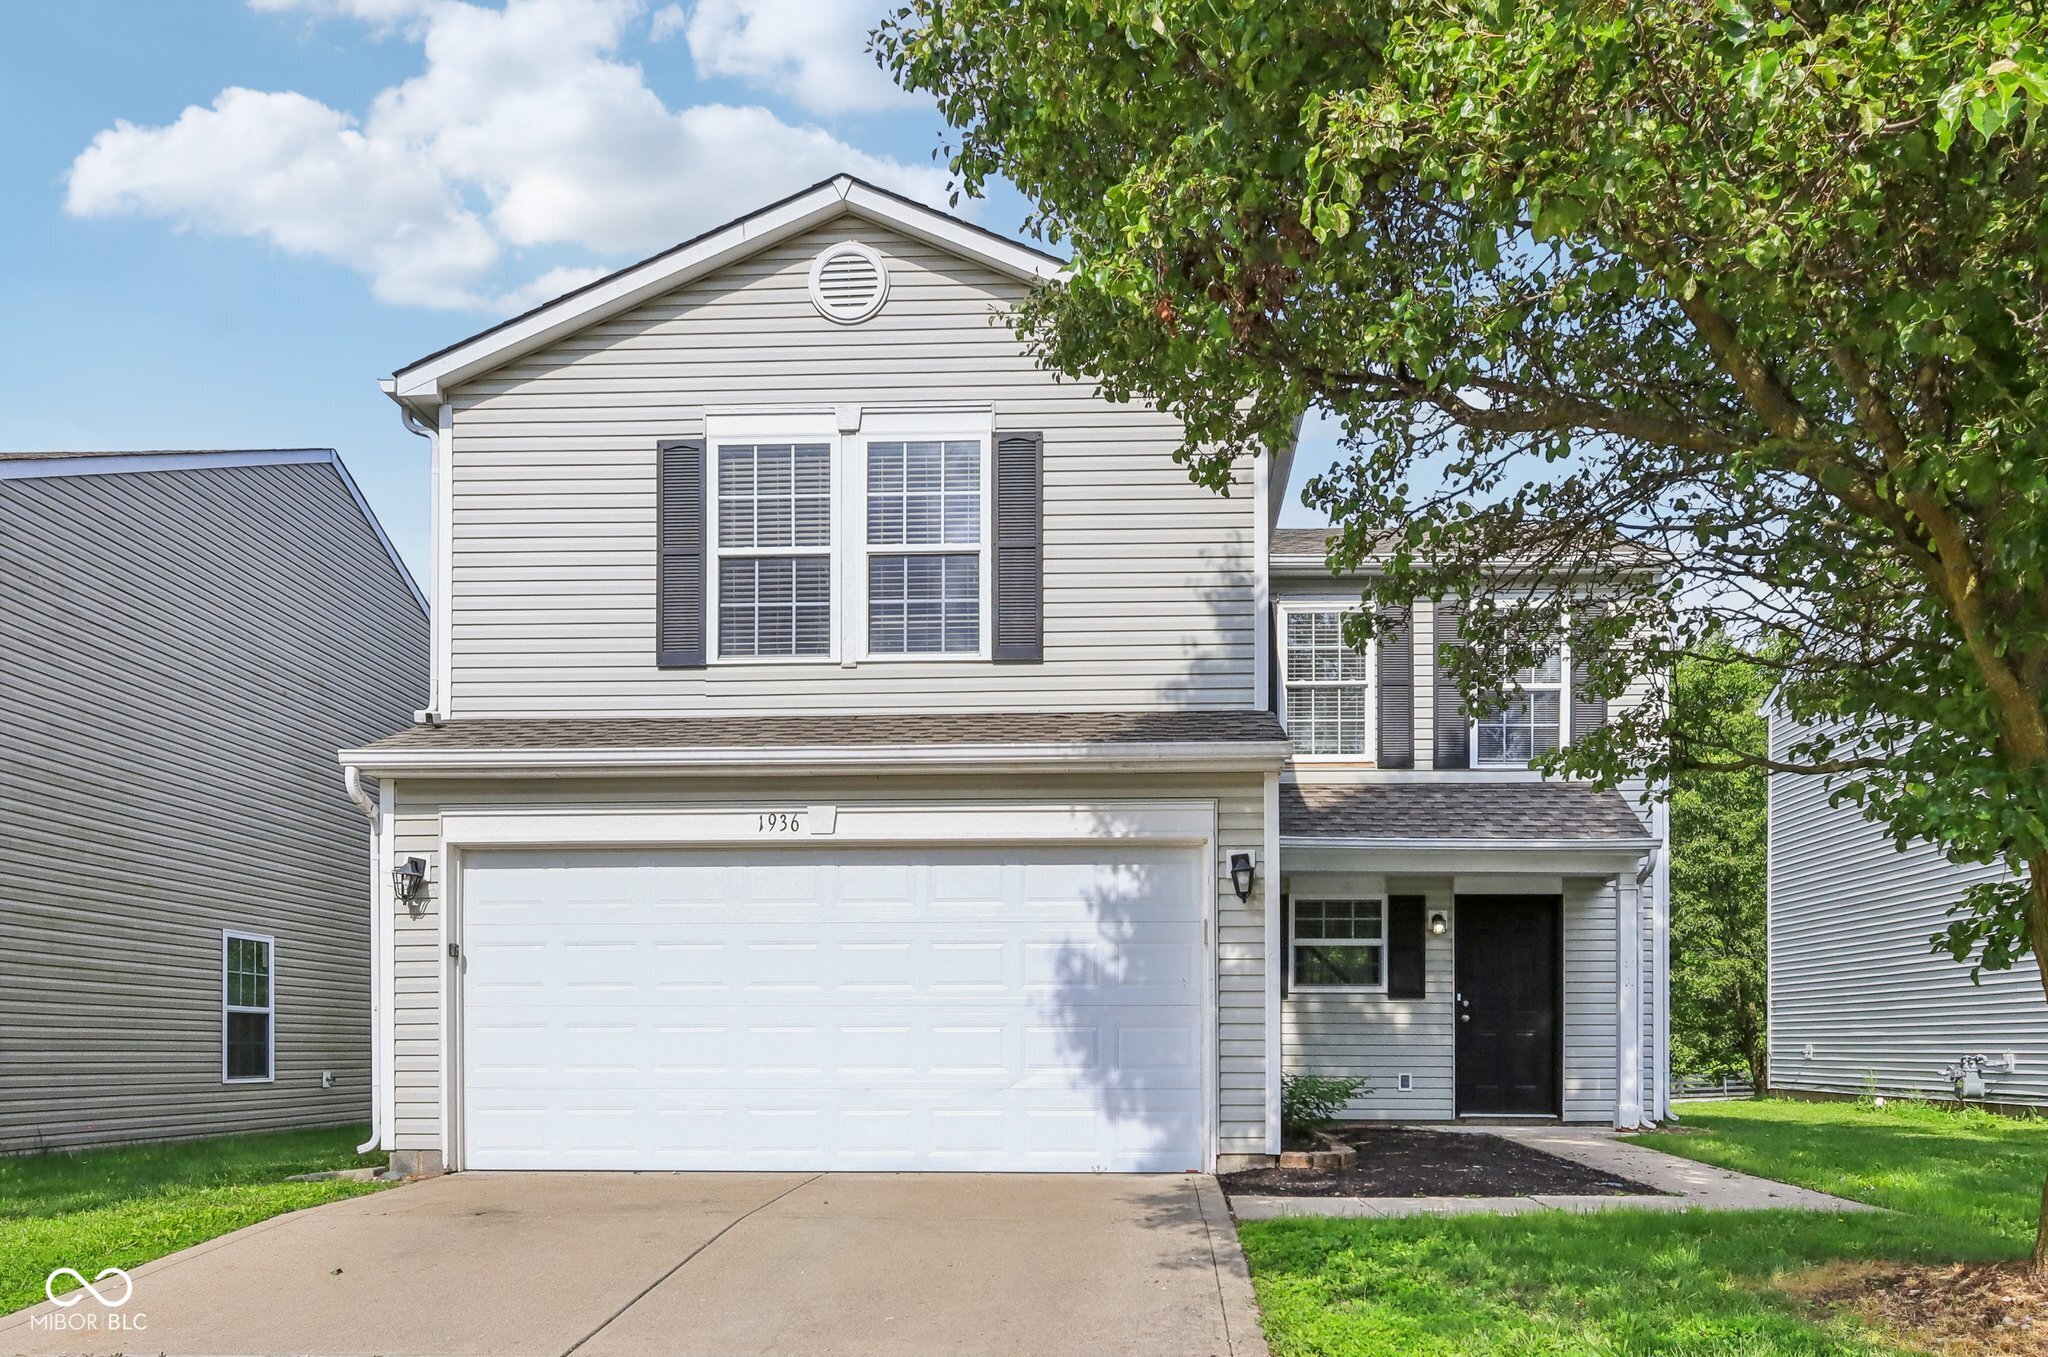
Pending
$249,900
3
bds
|
3
ba
|
1,323
sqft
|
built
2002
1936 Southernwood Ln, Indianapolis, IN 46231
$-129
Cash flow
-2.7%
Cash-on-Cash Return
5.5%
Cap rate
0.7%
Rent to Value Ratio
Pending
$258,000
0
bds
|
0
ba
|
0
sqft
|
built
1964
2955 Mars Hill St, Indianapolis, IN 46241
$-632
Cash flow
-12.8%
Cash-on-Cash Return
3.2%
Cap rate
0.4%
Rent to Value Ratio
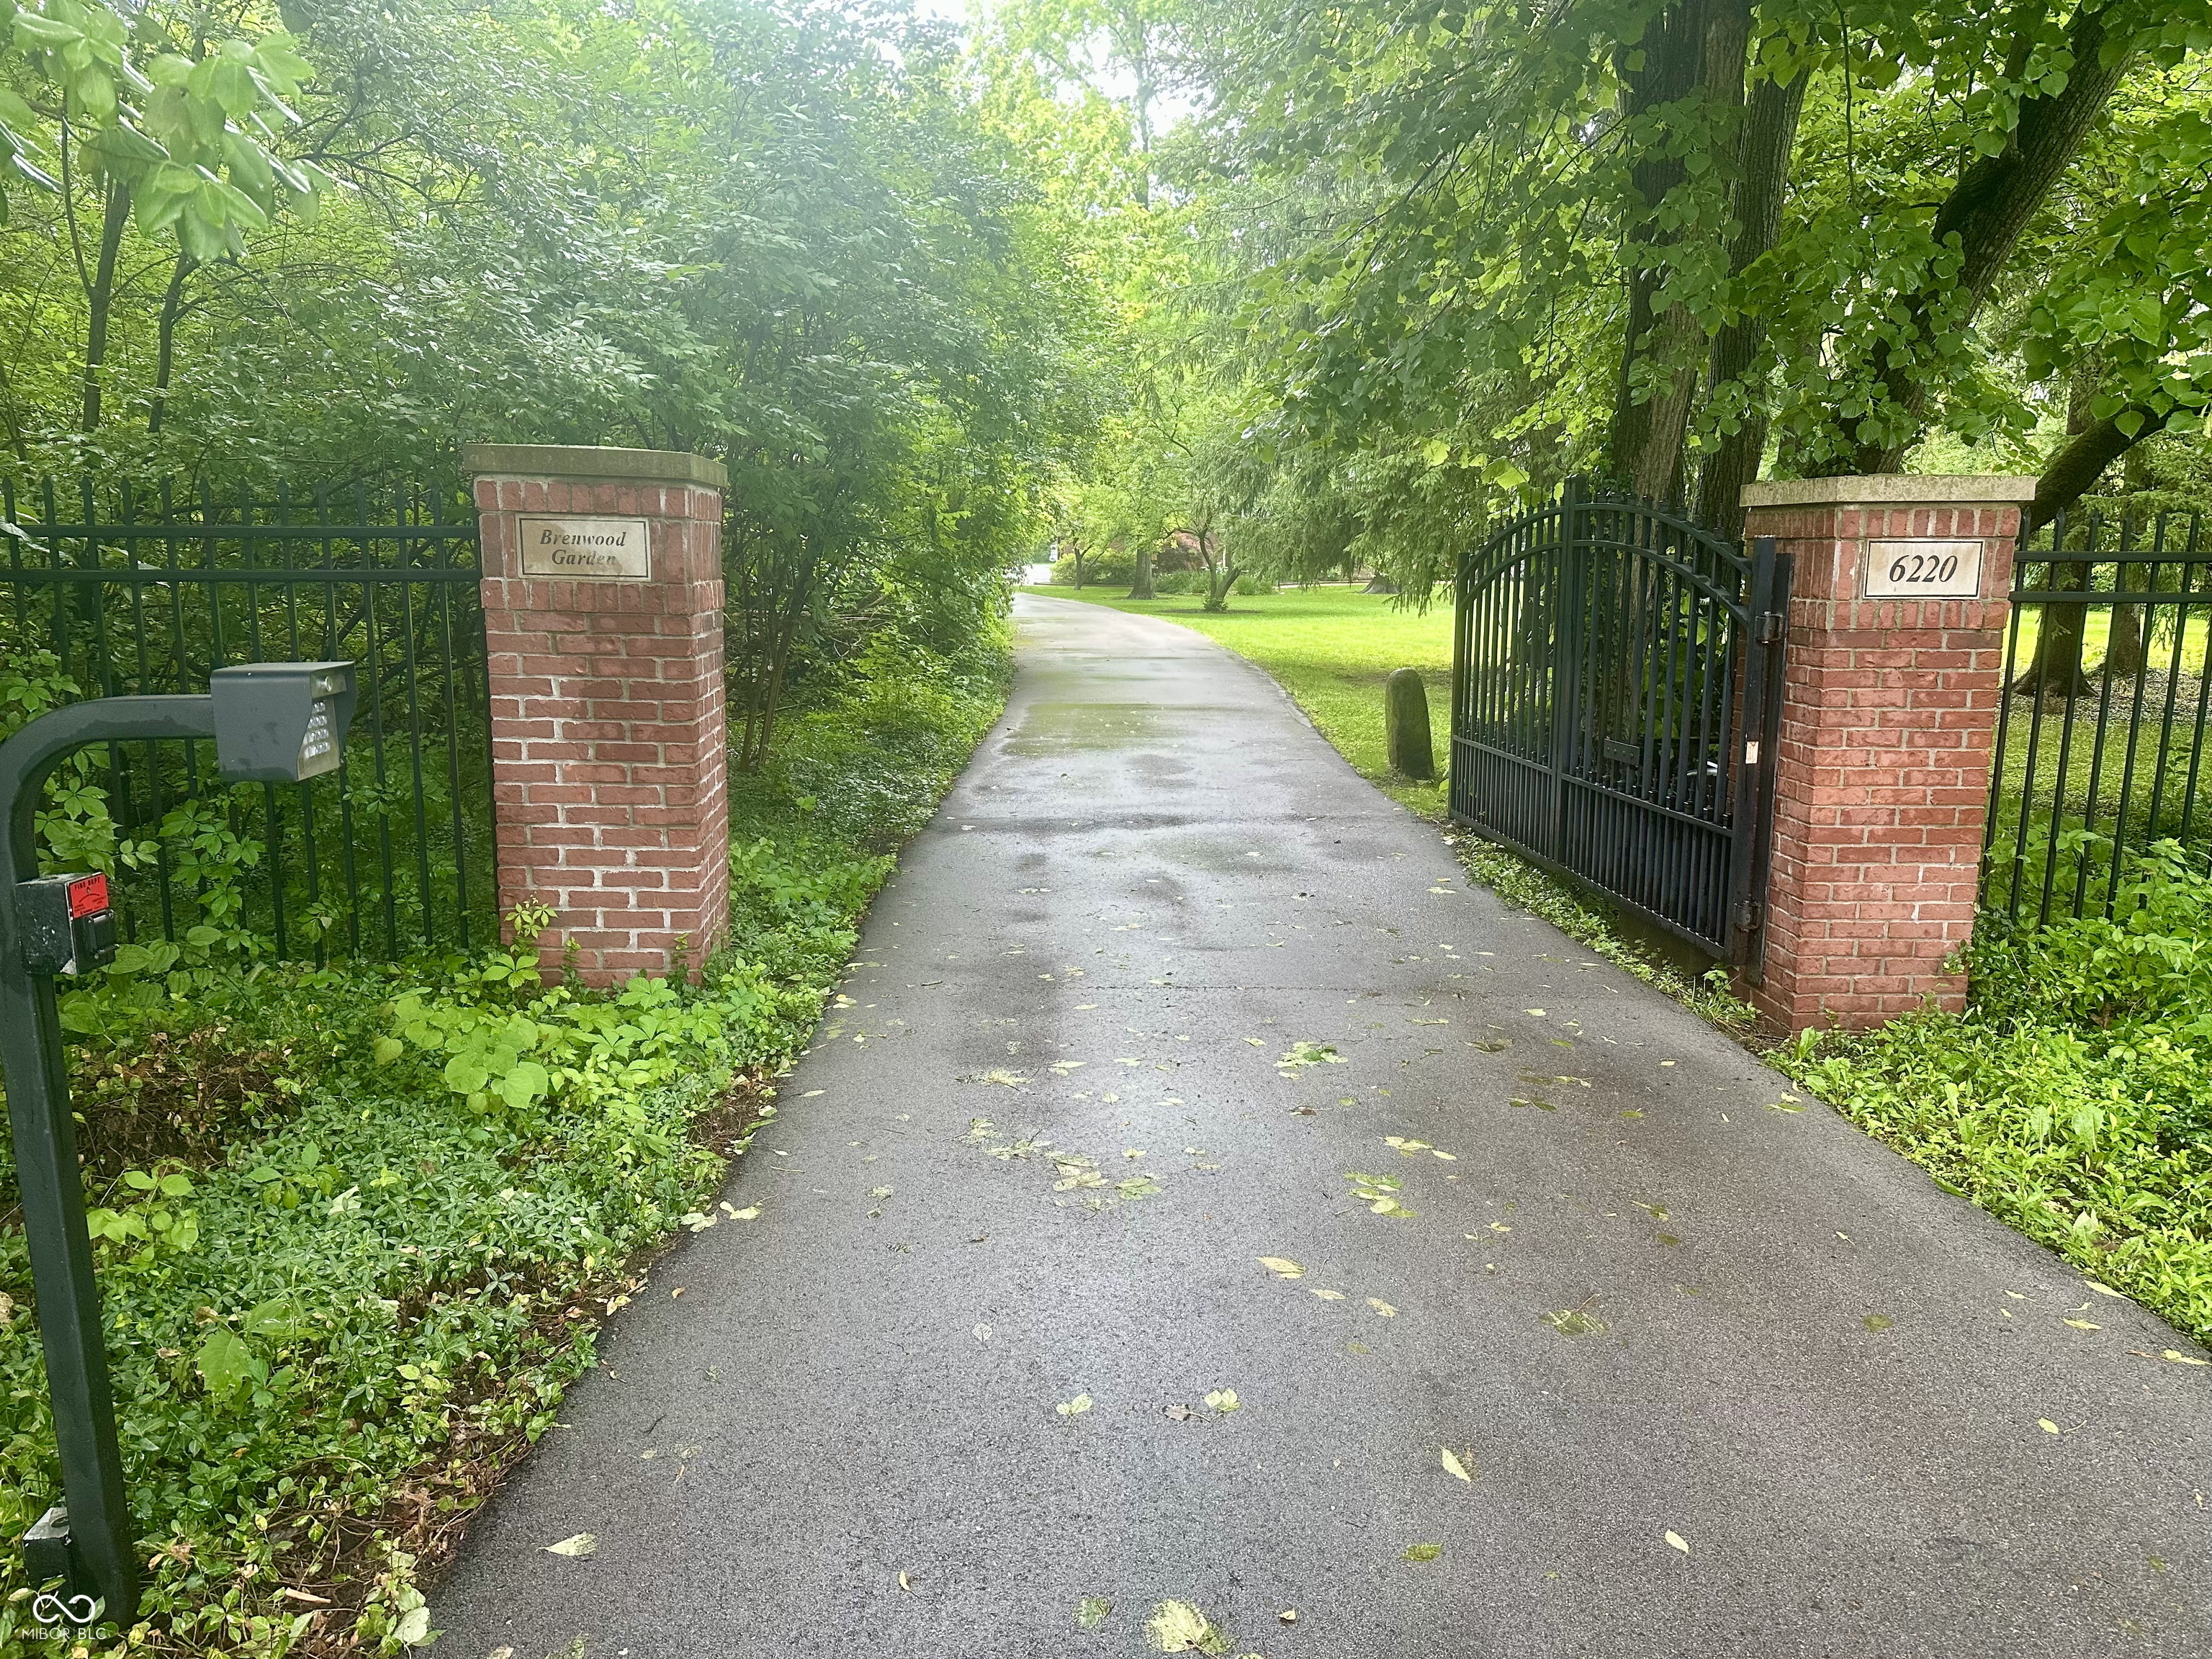
Pending
$875,000
5
bds
|
4
ba
|
4,434
sqft
|
built
1949
6220 E 56th St, Indianapolis, IN 46226
$-2,158
Cash flow
-12.9%
Cash-on-Cash Return
3.2%
Cap rate
0.5%
Rent to Value Ratio
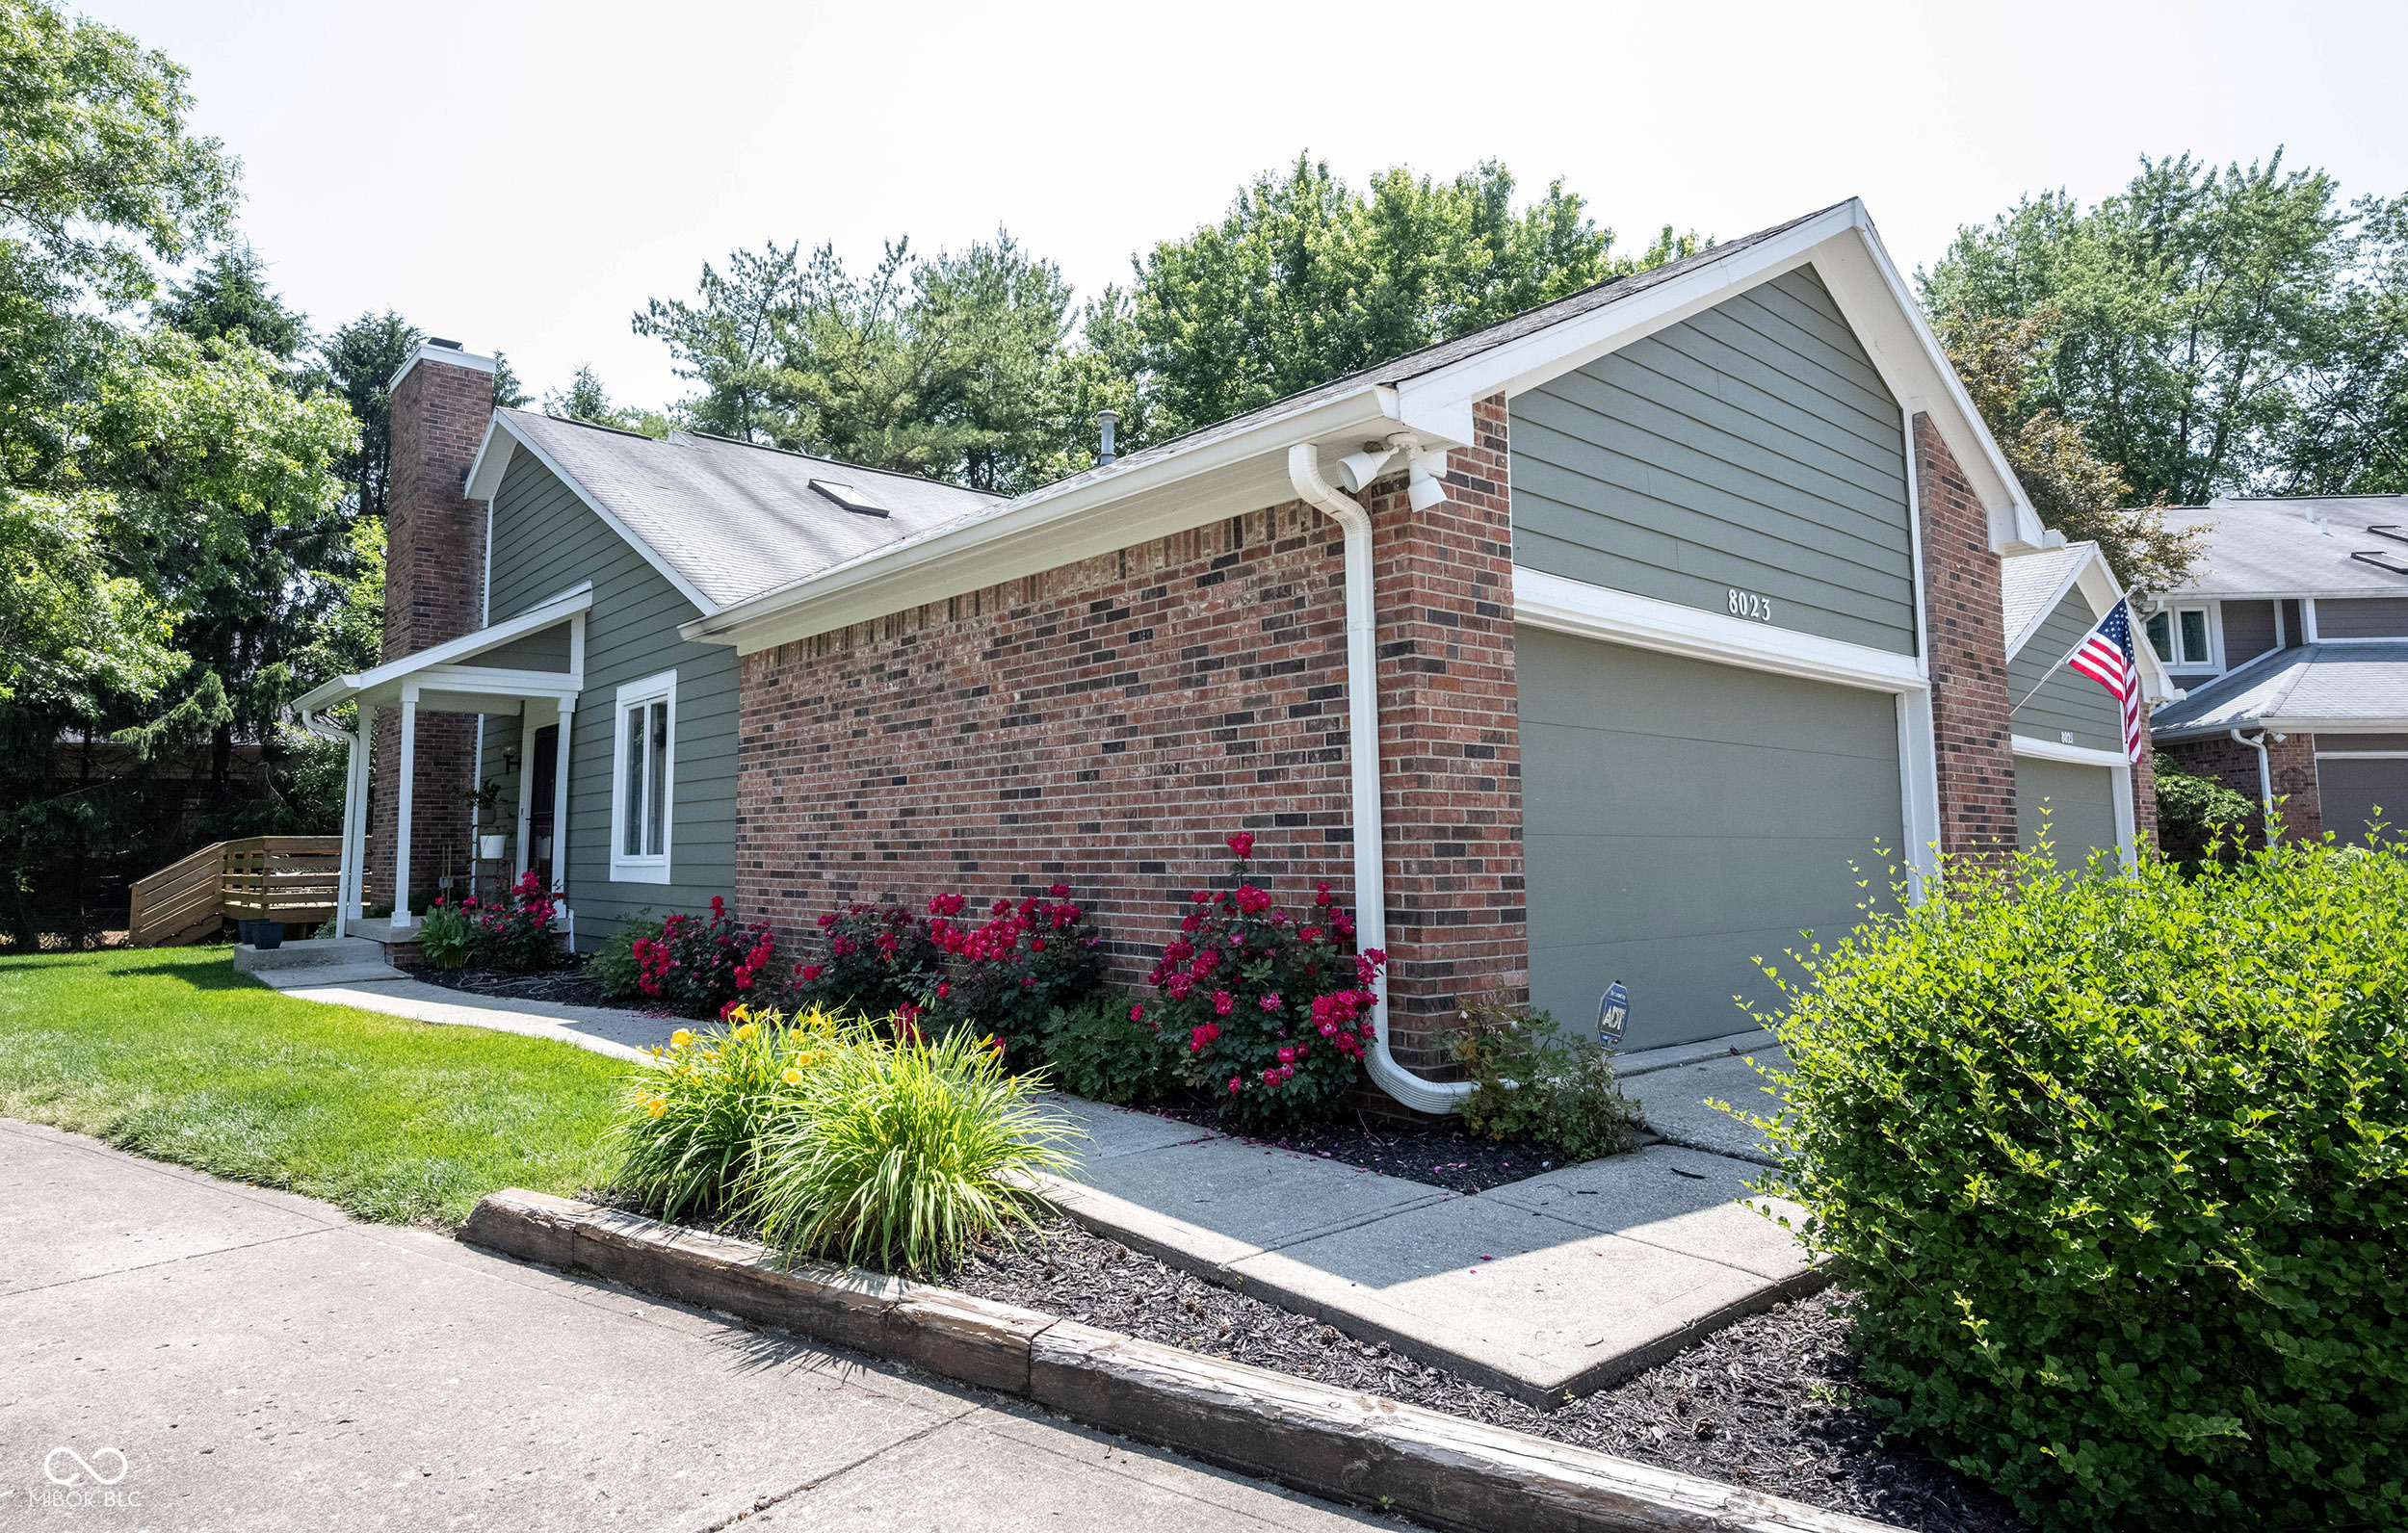
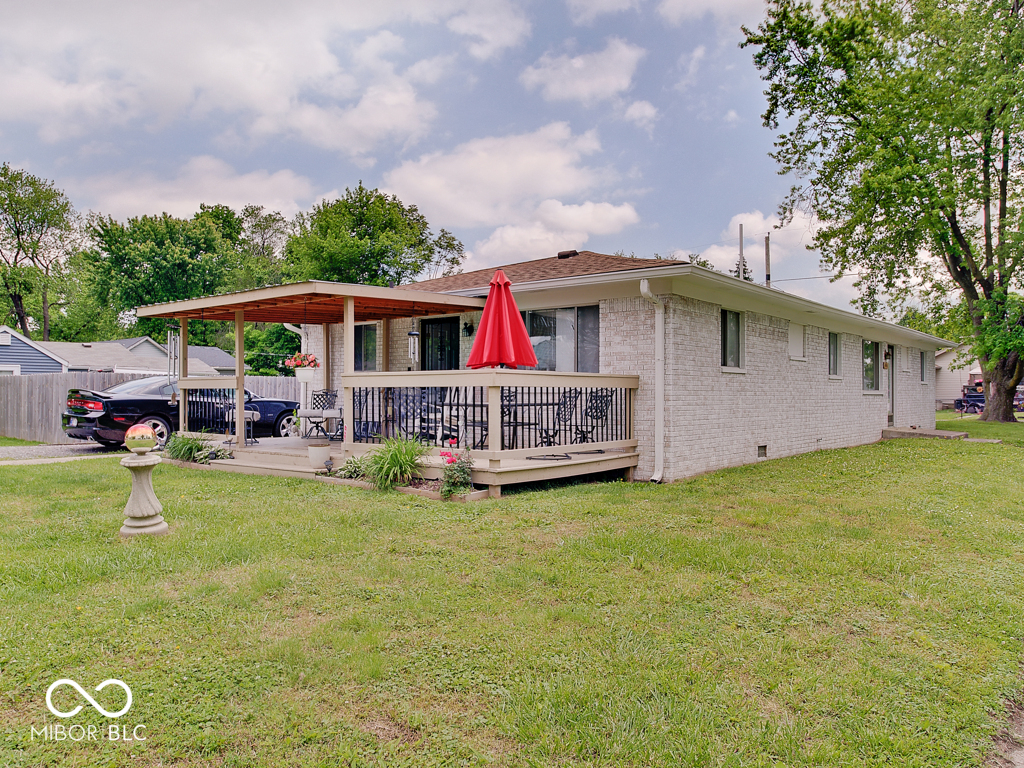
Active
$279,900
2
bds
|
2
ba
|
1,726
sqft
|
built
1985
8023 Talliho Dr, Indianapolis, IN 46256
$-162
Cash flow
-3.0%
Cash-on-Cash Return
5.5%
Cap rate
0.8%
Rent to Value Ratio
Active
$254,900
bds
|
0
ba
|
0
sqft
|
built
1939
3135 Kentucky Ave, Indianapolis, IN 46221
$-340
Cash flow
-7.0%
Cash-on-Cash Return
4.5%
Cap rate
0.5%
Rent to Value Ratio
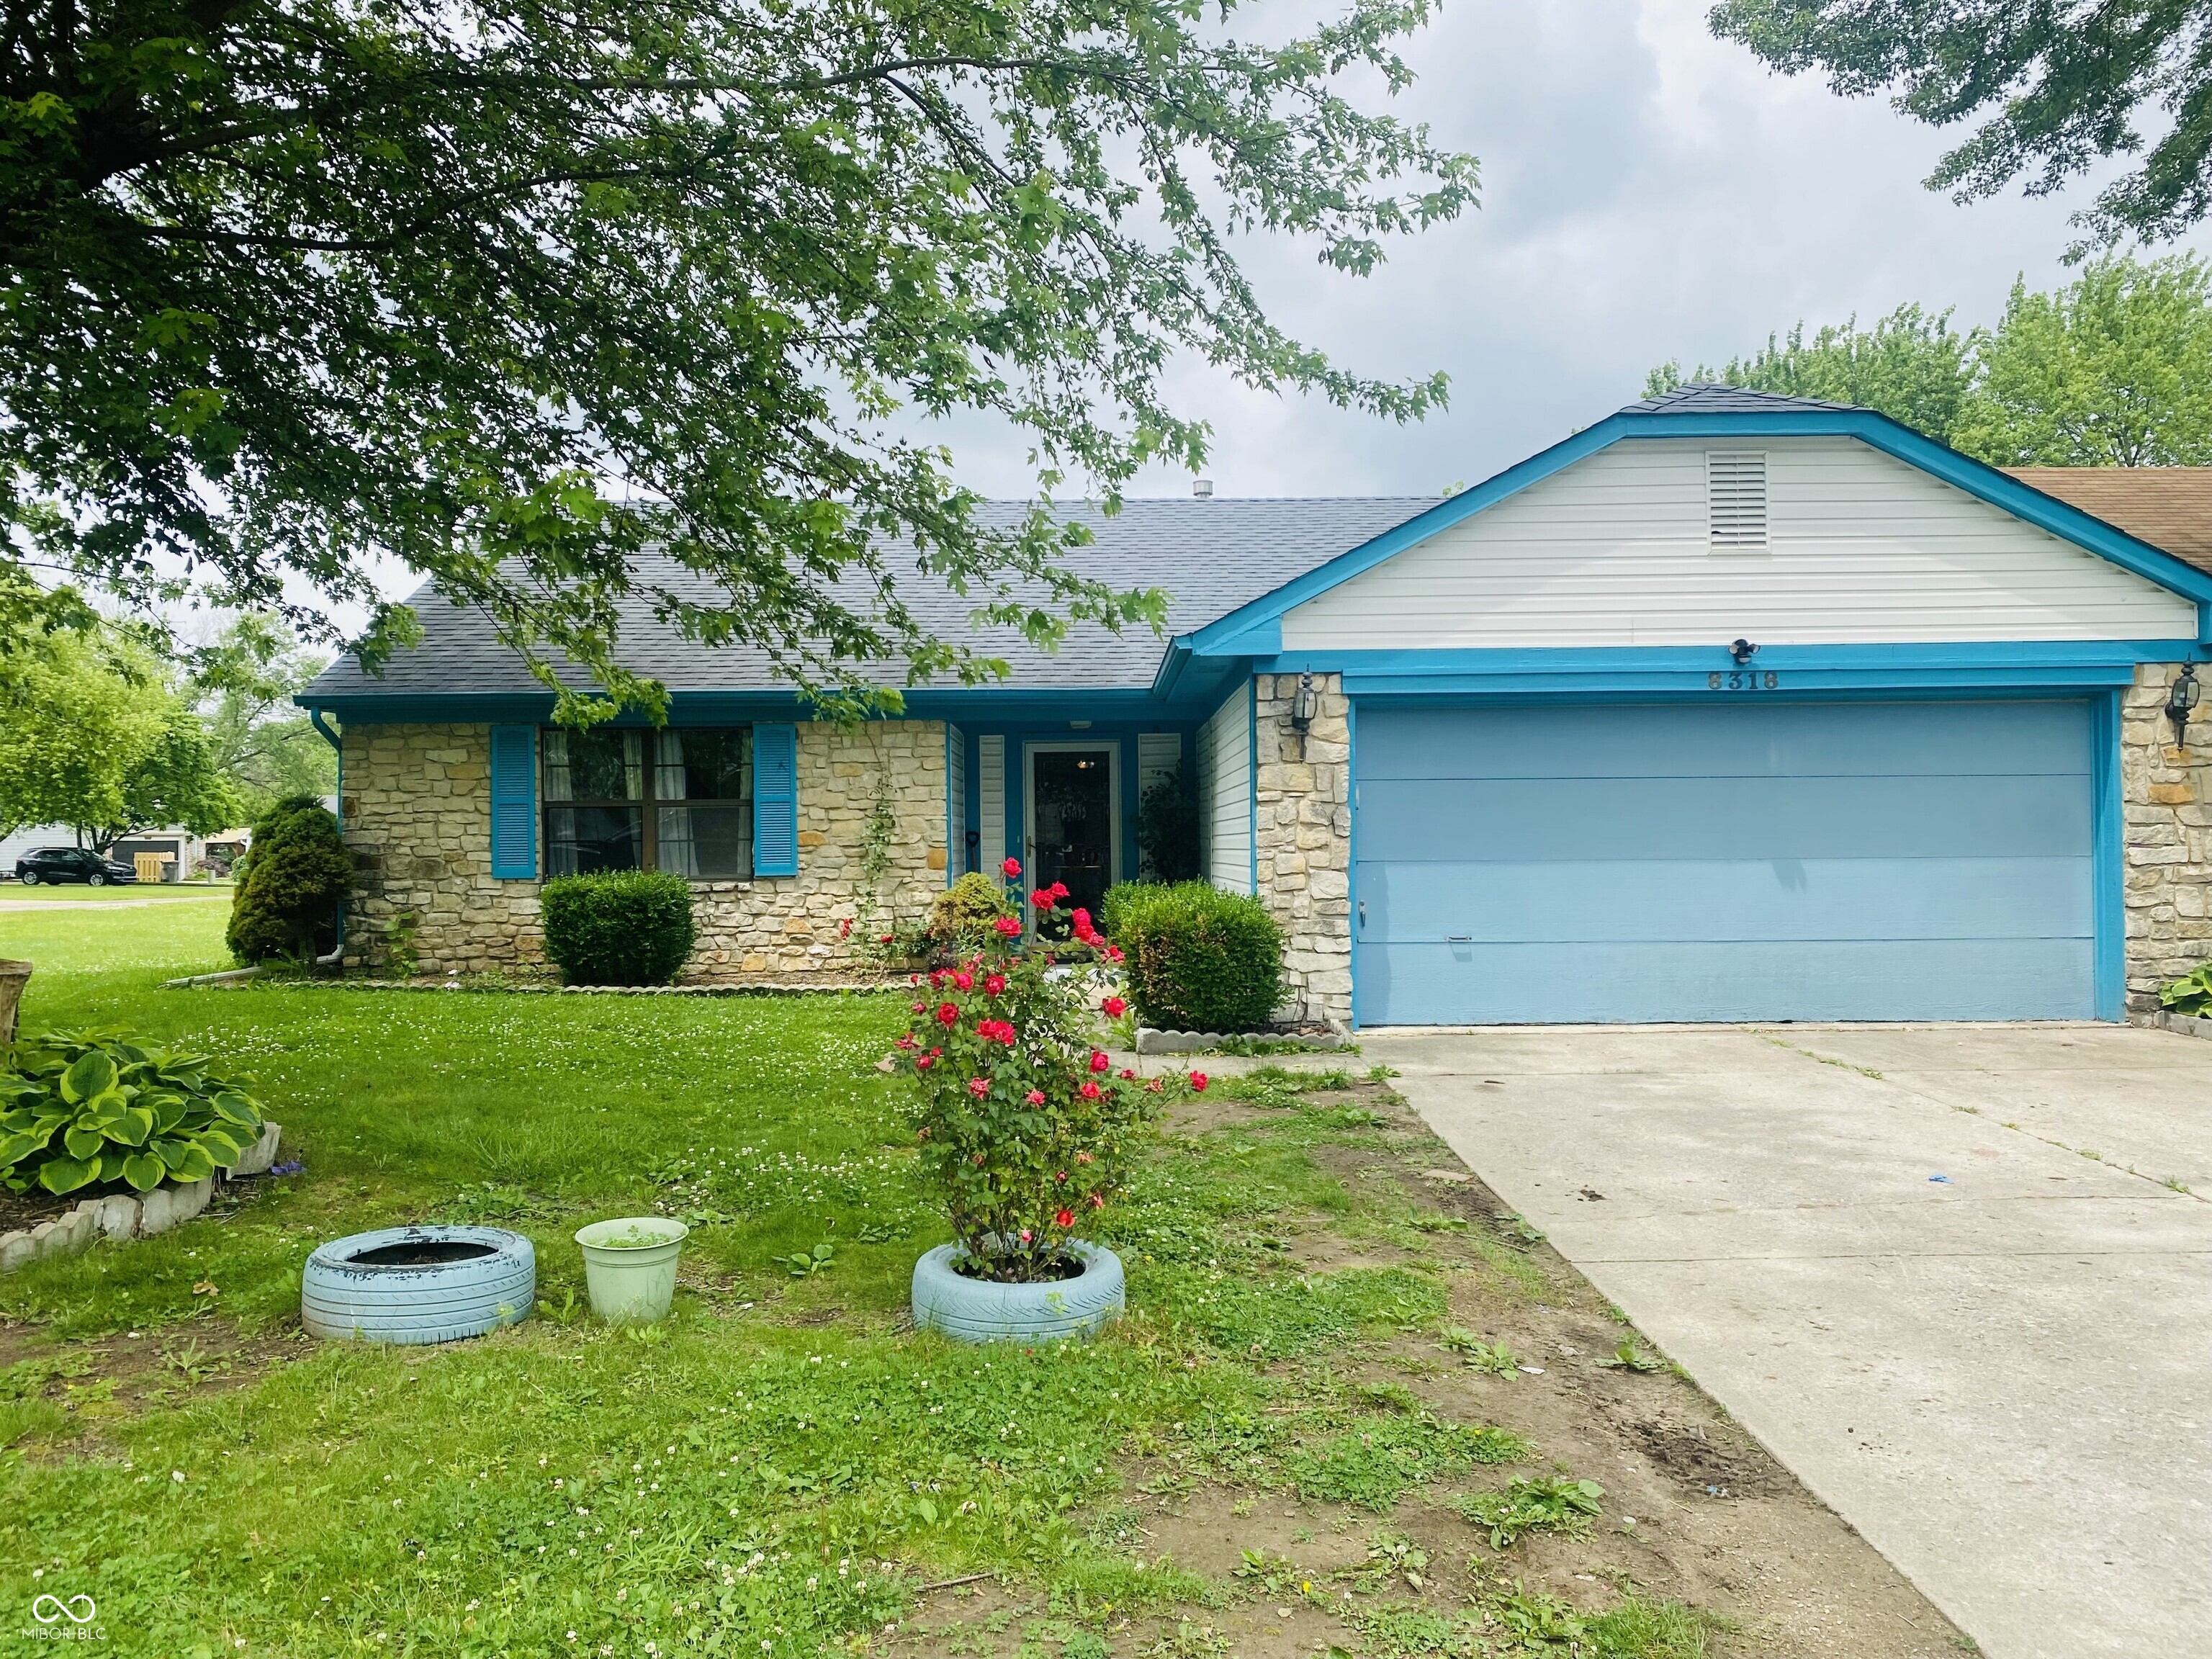
Active
$245,000
3
bds
|
2
ba
|
1,205
sqft
|
built
1989
8318 Rob Ln, Indianapolis, IN 46237
$-13
Cash flow
-0.3%
Cash-on-Cash Return
6.1%
Cap rate
0.7%
Rent to Value Ratio
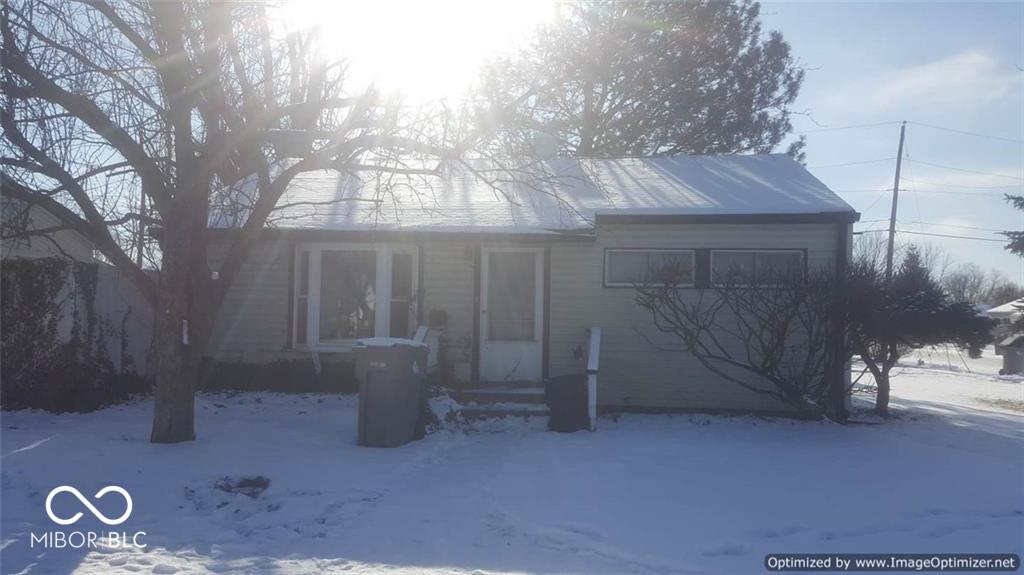
Pending
$160,000
3
bds
|
1
ba
|
1,037
sqft
|
built
1957
3922 N Irvington Ave, Indianapolis, IN 46226
$146
Cash flow
4.8%
Cash-on-Cash Return
7.2%
Cap rate
0.9%
Rent to Value Ratio
Active
$164,900
3
bds
|
2
ba
|
1,995
sqft
|
built
1960
3570 Decamp Dr, Indianapolis, IN 46226
$397
Cash flow
12.6%
Cash-on-Cash Return
9.0%
Cap rate
1.1%
Rent to Value Ratio
Active
$110,000
2
bds
|
1
ba
|
768
sqft
|
built
1952
5473 E 19th St, Indianapolis, IN 46218
$334
Cash flow
15.8%
Cash-on-Cash Return
9.8%
Cap rate
1.2%
Rent to Value Ratio
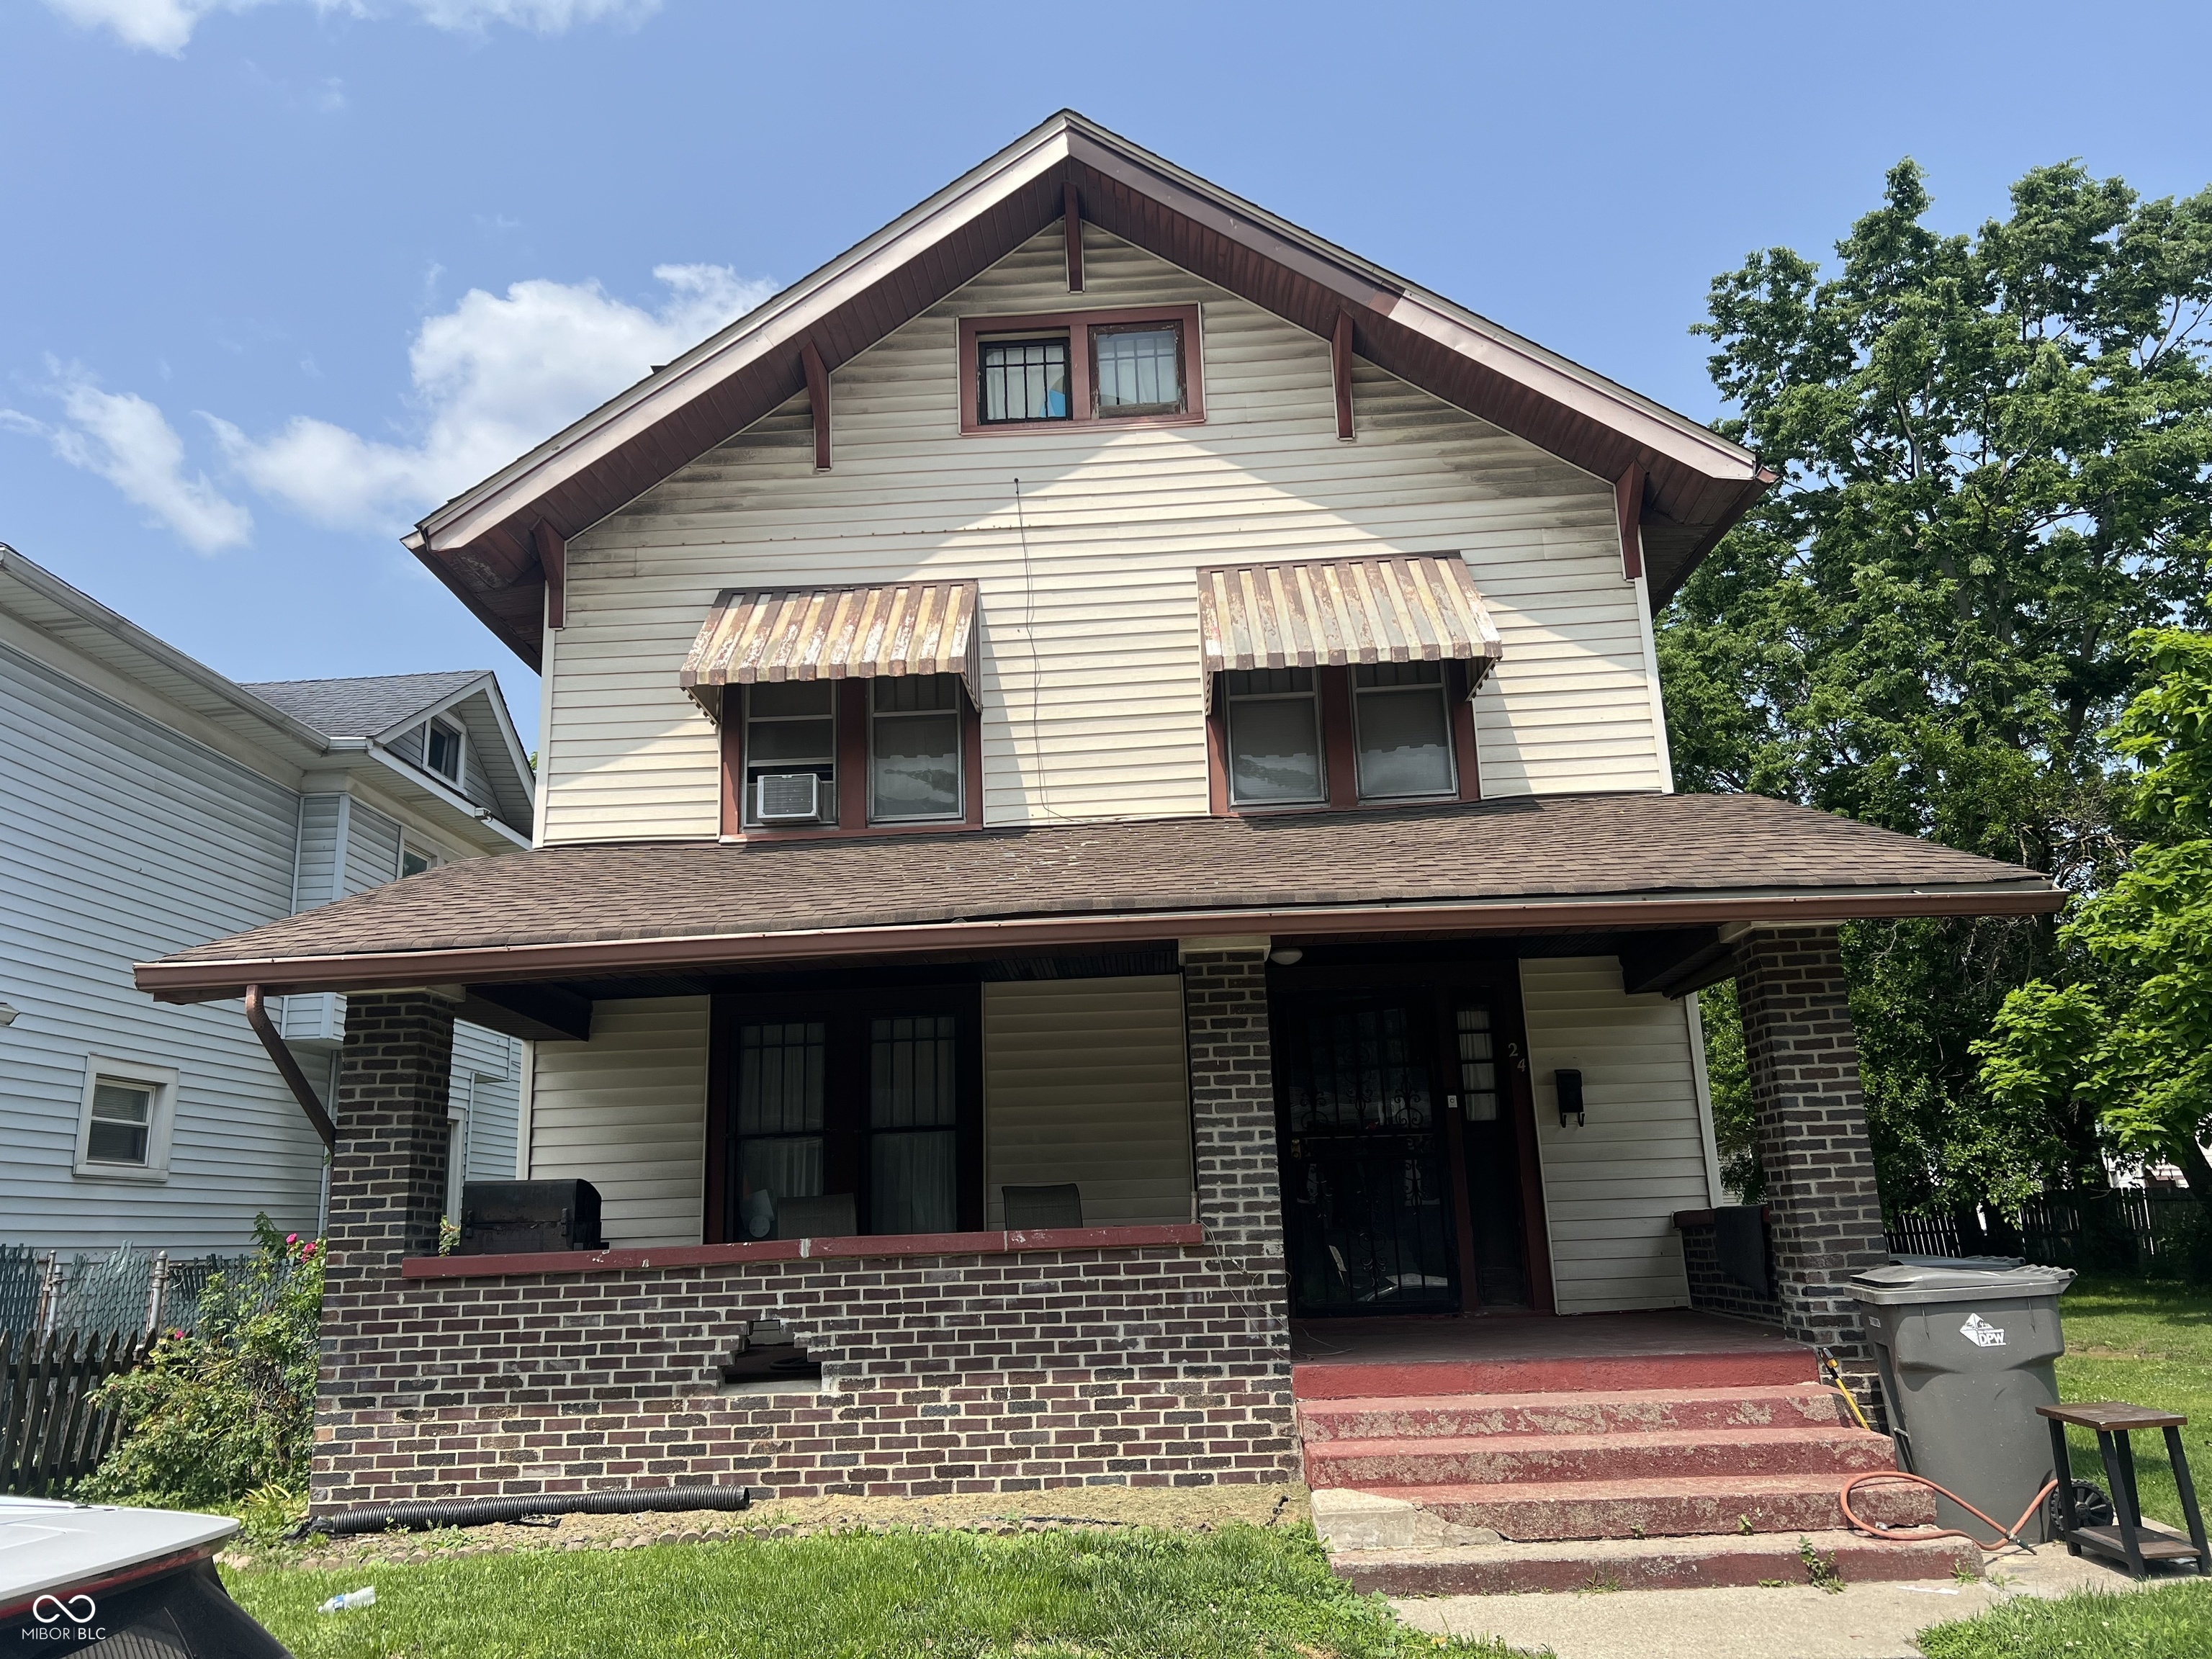
Pending
$170,000
5
bds
|
1
ba
|
1,741
sqft
|
built
1911
24 Hendricks Pl, Indianapolis, IN 46201
$233
Cash flow
7.2%
Cash-on-Cash Return
7.8%
Cap rate
0.9%
Rent to Value Ratio
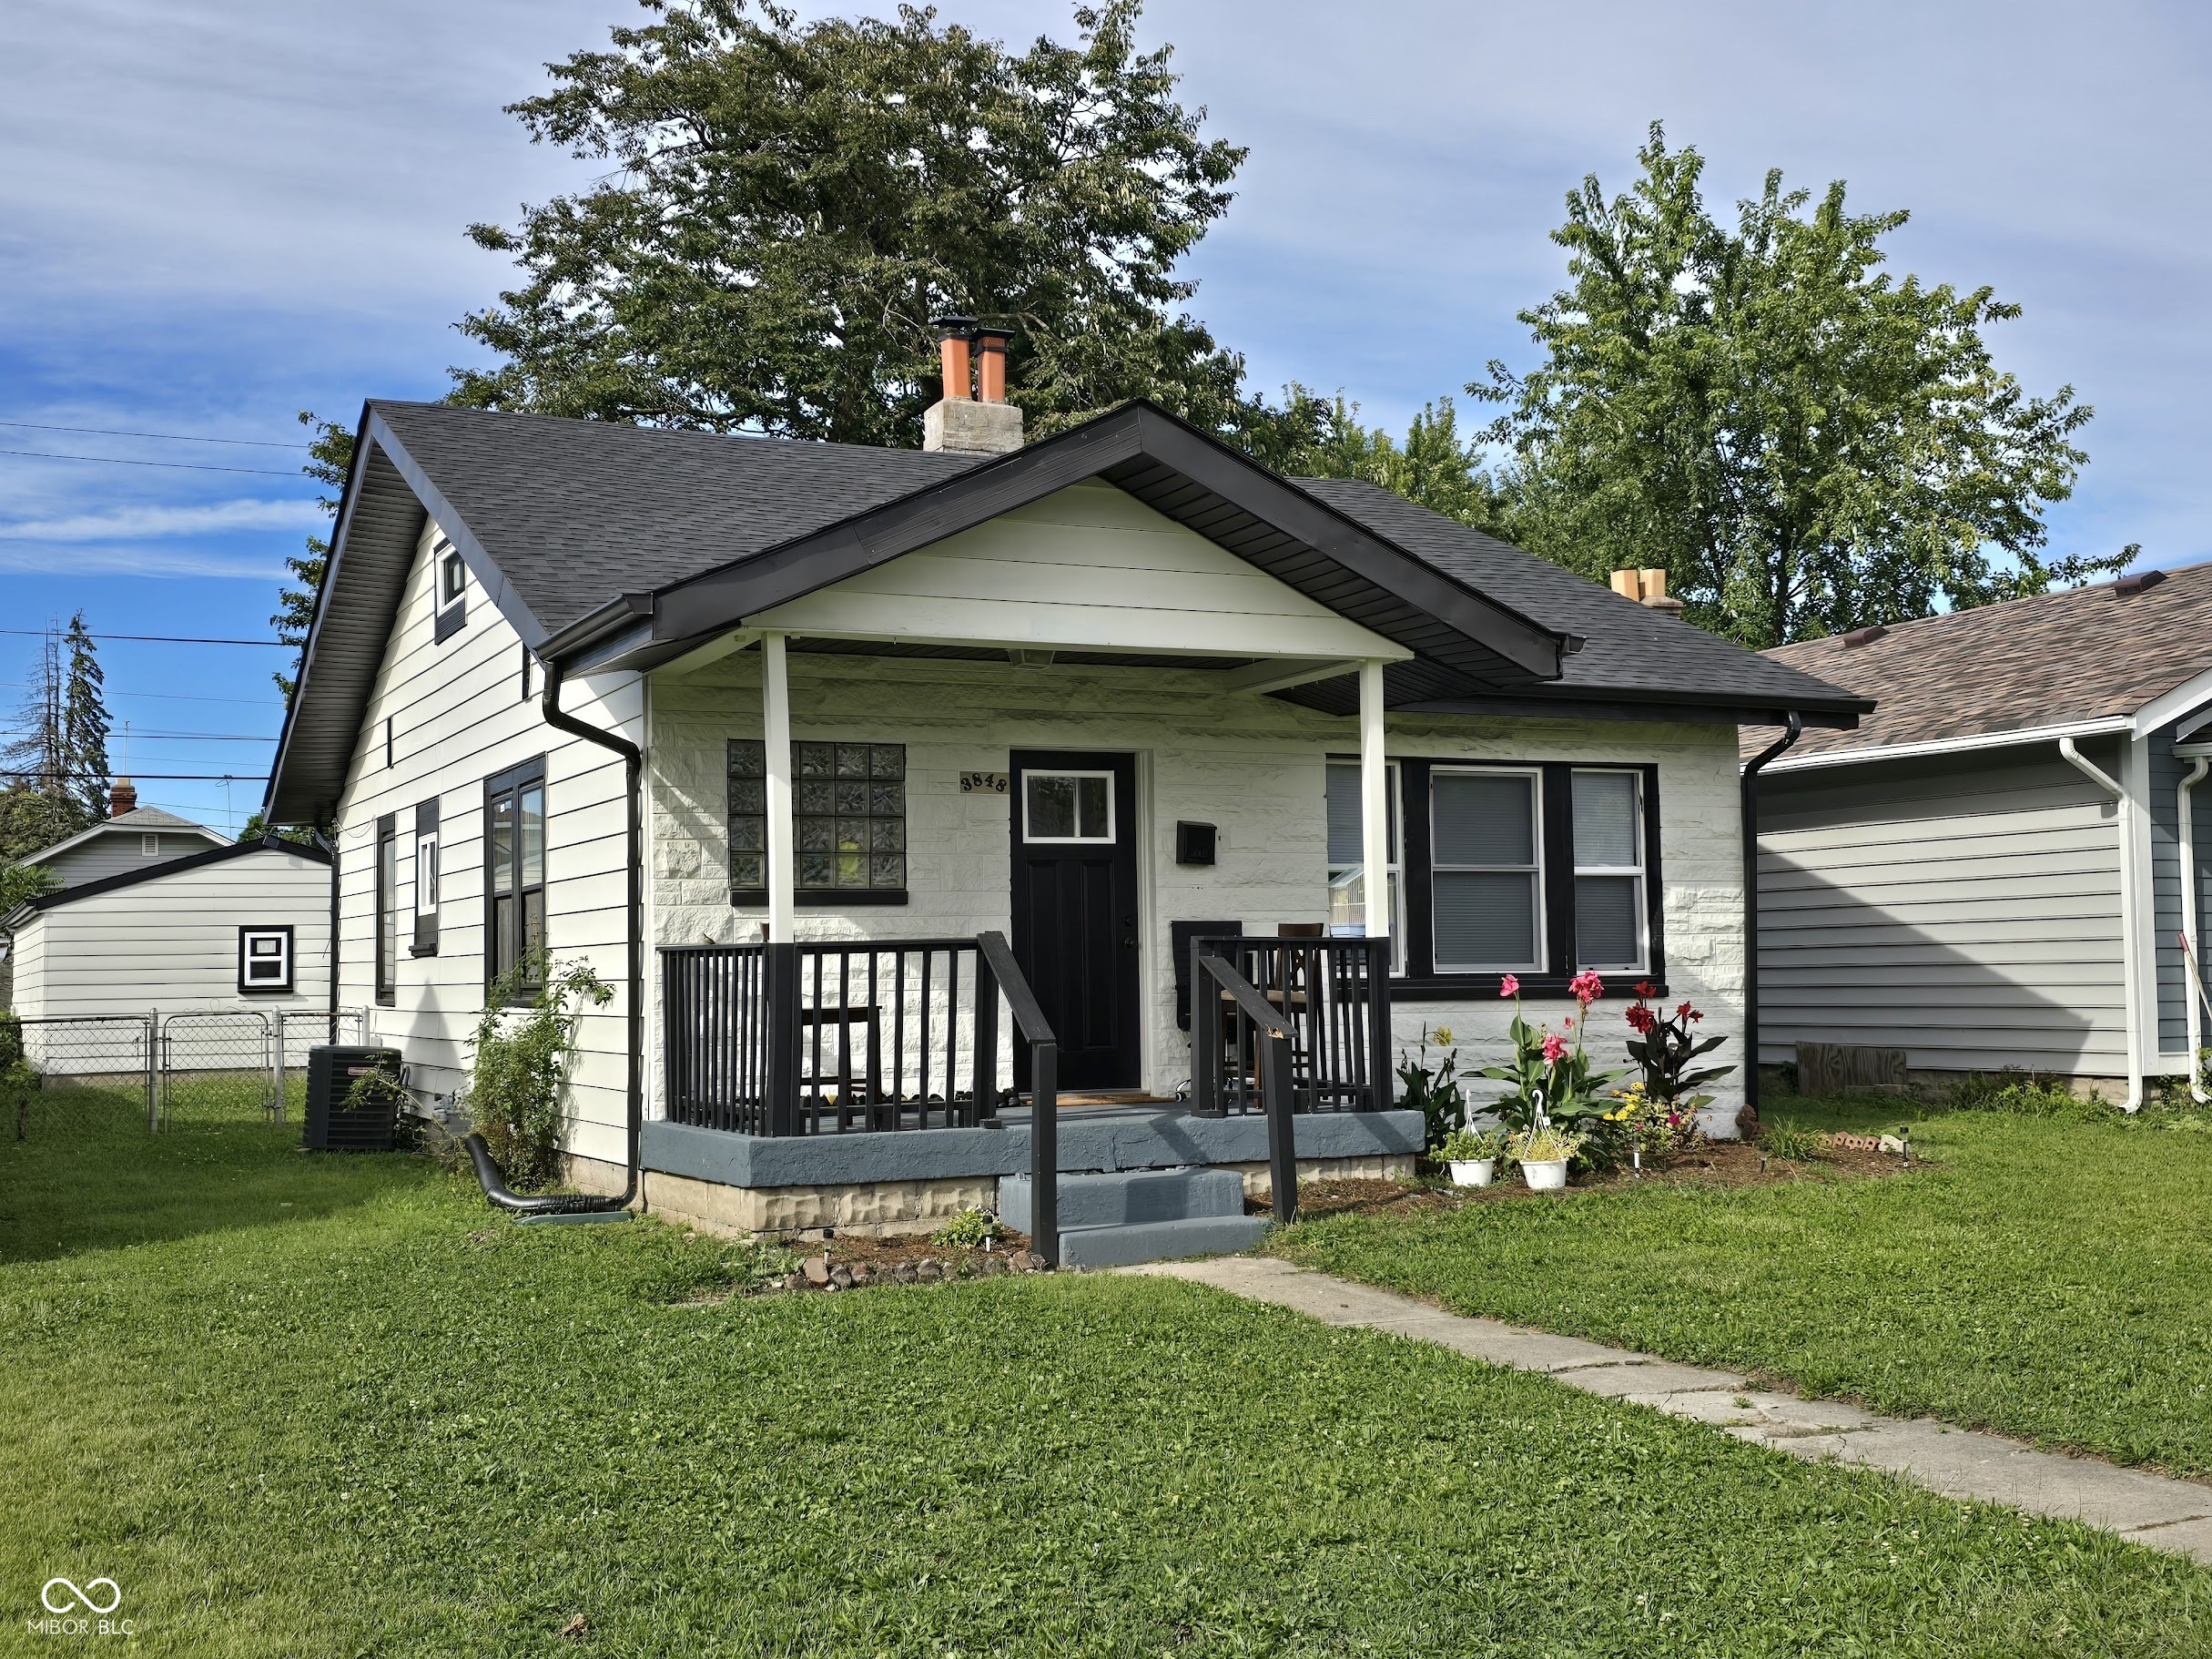
Active
$150,000
2
bds
|
1
ba
|
984
sqft
|
built
1931
3848 Spann Ave, Indianapolis, IN 46203
$336
Cash flow
11.7%
Cash-on-Cash Return
8.8%
Cap rate
1.1%
Rent to Value Ratio
Active
$189,000
2
bds
|
0
ba
|
0
sqft
|
built
1920
4710 E Michigan St, Indianapolis, IN 46201
$-347
Cash flow
-9.6%
Cash-on-Cash Return
3.9%
Cap rate
0.5%
Rent to Value Ratio