Indianapolis, IN Investment Properties for Sale
Browse homes for sale and investment properties in Indianapolis, IN. Refine your search by price, property type, or more.
Best cash flowing properties in Indianapolis, IN
Active
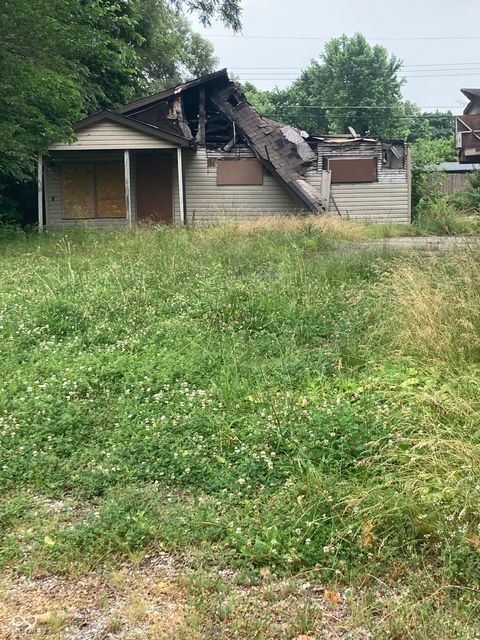
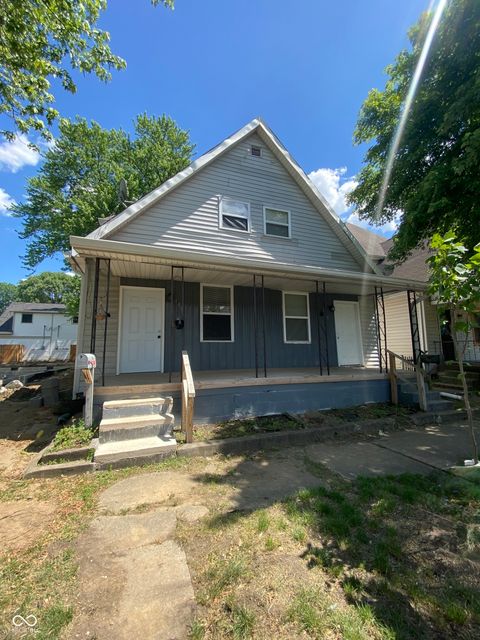
$50,000
1
bds
|
0
ba
|
840
sqft
|
built
1935
3343 S Lyons Ave, Indianapolis, IN 46221
$759
Cash flow
17.7%
Cash-on-Cash Return
18.2%
Cap rate
2.2%
Rent to Value Ratio

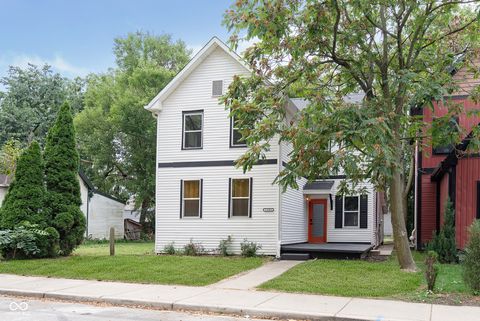
Active
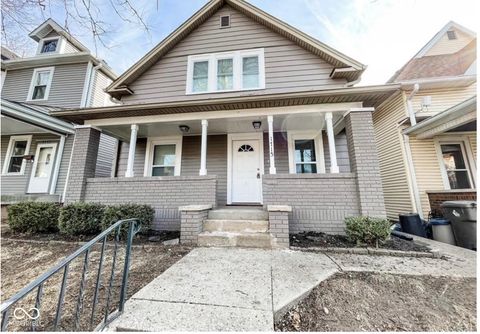
$105,000
2
bds
|
1
ba
|
895
sqft
|
built
1918
2335 Union St, Indianapolis, IN 46225
$418
Cash flow
20.8%
Cash-on-Cash Return
11.0%
Cap rate
1.3%
Rent to Value Ratio
2,136 out of 2,292 properties for sale in Indianapolis, IN
Limited Results Shown
Create a free account, or log in to reveal all property listings and enjoy the complete experience.

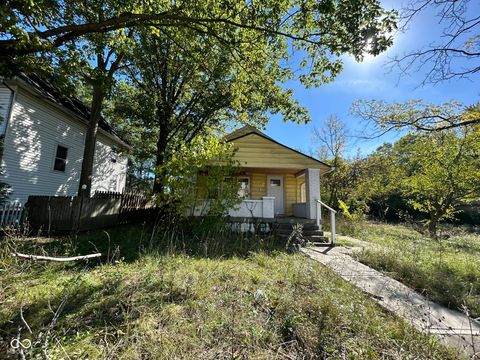
Active
$169,999
3
bds
|
1
ba
|
1,080
sqft
|
built
1968
1704 Nelson Ave, Indianapolis, IN 46203
$78
Cash flow
2.4%
Cash-on-Cash Return
6.8%
Cap rate
0.8%
Rent to Value Ratio
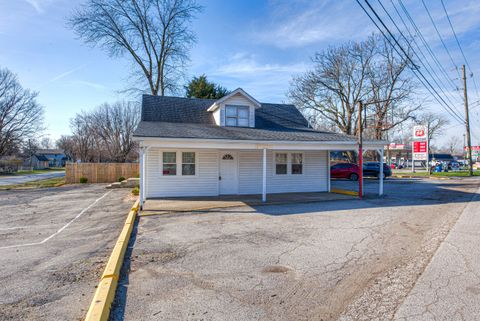
Active
$290,000
4
bds
|
2
ba
|
2,220
sqft
|
built
1915
1715 Union St, Indianapolis, IN 46225
$142
Cash flow
2.6%
Cash-on-Cash Return
6.9%
Cap rate
0.8%
Rent to Value Ratio
Active
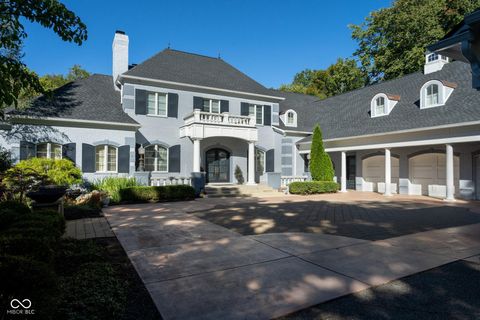
$2,250,000
5
bds
|
6
ba
|
10,675
sqft
|
built
2005
8358 Hidden Point Dr, Indianapolis, IN 46256
$-7,442
Cash flow
-17.3%
Cash-on-Cash Return
2.3%
Cap rate
0.3%
Rent to Value Ratio

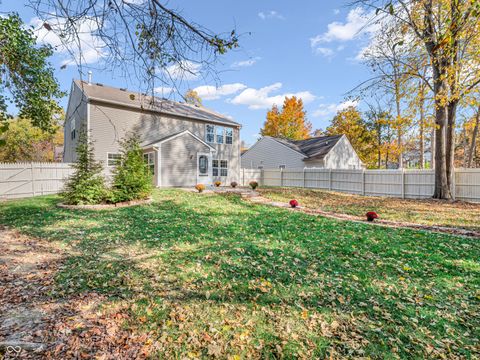
Active
$343,900
4
bds
|
3
ba
|
2,690
sqft
|
built
1992
636 Creston Point Cir, Indianapolis, IN 46239
$-156
Cash flow
-2.4%
Cash-on-Cash Return
5.7%
Cap rate
0.7%
Rent to Value Ratio
Active
$299,500
3
bds
|
3
ba
|
2,504
sqft
|
built
2004
11411 Shady Hollow Ln, Indianapolis, IN 46229
$161
Cash flow
2.8%
Cash-on-Cash Return
6.9%
Cap rate
0.8%
Rent to Value Ratio
Active
$279,000
3
bds
|
2
ba
|
1,325
sqft
|
built
1900
2028 Hoyt Ave, Indianapolis, IN 46203
$130
Cash flow
2.4%
Cash-on-Cash Return
6.8%
Cap rate
0.8%
Rent to Value Ratio
Active
$459,900
5
bds
|
4
ba
|
3,546
sqft
|
built
1965
7722 Shady Hills Dr W, Indianapolis, IN 46278
$-323
Cash flow
-3.7%
Cash-on-Cash Return
5.4%
Cap rate
0.7%
Rent to Value Ratio
Active
$499,900
4
bds
|
4
ba
|
3,972
sqft
|
built
2003
8418 Mesic Ct, Indianapolis, IN 46278
$-299
Cash flow
-3.1%
Cash-on-Cash Return
5.5%
Cap rate
0.7%
Rent to Value Ratio
Active
$599,000
5
bds
|
4
ba
|
3,511
sqft
|
built
1929
3860 N Delaware St, Indianapolis, IN 46205
$-91
Cash flow
-0.8%
Cash-on-Cash Return
6.1%
Cap rate
0.7%
Rent to Value Ratio
Active
$329,000
3
bds
|
2
ba
|
1,550
sqft
|
built
1890
1046 Dawson St, Indianapolis, IN 46203
$7
Cash flow
0.1%
Cash-on-Cash Return
6.3%
Cap rate
0.8%
Rent to Value Ratio
Active
$159,900
3
bds
|
2
ba
|
1,671
sqft
|
built
1915
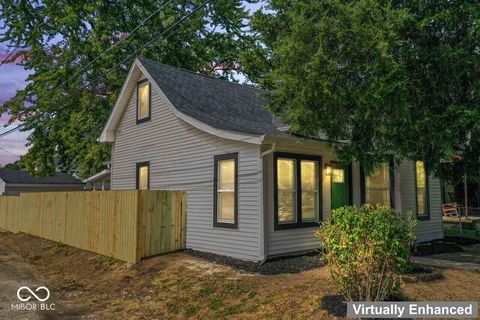
41 S Sherman Dr, Indianapolis, IN 46201
$269
Cash flow
8.8%
Cash-on-Cash Return
8.3%
Cap rate
1.0%
Rent to Value Ratio
Active
$2,495,000
6
bds
|
8
ba
|
11,116
sqft
|
built
2002
9088 Nautical Watch Dr, Indianapolis, IN 46236
$-8,652
Cash flow
-18.1%
Cash-on-Cash Return
2.1%
Cap rate
0.3%
Rent to Value Ratio

Active
$169,000
0
bds
|
0
ba
|
0
sqft
|
built
1902
28 S Hawthorne Ln, Indianapolis, IN 46219
$-261
Cash flow
-8.1%
Cash-on-Cash Return
4.4%
Cap rate
0.5%
Rent to Value Ratio

Active
$215,000
3
bds
|
1
ba
|
1,058
sqft
|
built
2018
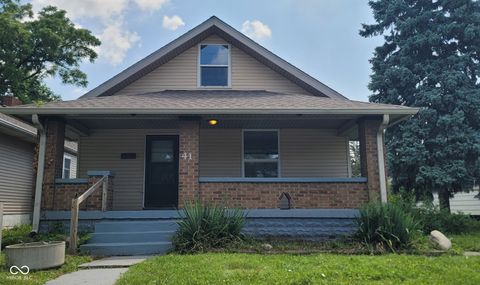
441 N Temple Ave, Indianapolis, IN 46201
$-156
Cash flow
-3.8%
Cash-on-Cash Return
5.4%
Cap rate
0.7%
Rent to Value Ratio

Active
$549,000
2
bds
|
0
ba
|
0
sqft
|
built
1900
2716 E New York St, Indianapolis, IN 46201
$-2,314
Cash flow
-22.0%
Cash-on-Cash Return
1.2%
Cap rate
0.1%
Rent to Value Ratio
Active
$1,250,000
4
bds
|
5
ba
|
6,882
sqft
|
built
1988
3748 Bay Road South Dr, Indianapolis, IN 46240
$-2,735
Cash flow
-11.4%
Cash-on-Cash Return
3.6%
Cap rate
0.5%
Rent to Value Ratio

Active
$239,900
3
bds
|
2
ba
|
2,080
sqft
|
built
1962
3720 E Southern Ave, Indianapolis, IN 46203
$-10
Cash flow
-0.2%
Cash-on-Cash Return
6.2%
Cap rate
0.8%
Rent to Value Ratio
Active
$245,000
3
bds
|
0
ba
|
0
sqft
|
built
1990
653 Birch Ave, Indianapolis, IN 46221
$-589
Cash flow
-12.5%
Cash-on-Cash Return
3.4%
Cap rate
0.4%
Rent to Value Ratio

Active
$239,900
3
bds
|
3
ba
|
1,644
sqft
|
built
1906
3835 N Kenwood Ave, Indianapolis, IN 46208
$-493
Cash flow
-10.7%
Cash-on-Cash Return
3.8%
Cap rate
0.5%
Rent to Value Ratio
Active
$279,000
4
bds
|
3
ba
|
1,968
sqft
|
built
1922
1306 S Talbott St, Indianapolis, IN 46225
$268
Cash flow
5.0%
Cash-on-Cash Return
7.4%
Cap rate
0.9%
Rent to Value Ratio

Active
$273,000
6
bds
|
0
ba
|
0
sqft
|
built
1900
516 N Dearborn St, Indianapolis, IN 46201
$-666
Cash flow
-12.7%
Cash-on-Cash Return
3.3%
Cap rate
0.4%
Rent to Value Ratio

Active
$174,900
2
bds
|
2
ba
|
844
sqft
|
built
1910
929 Roache St, Indianapolis, IN 46208
$191
Cash flow
5.7%
Cash-on-Cash Return
7.6%
Cap rate
0.9%
Rent to Value Ratio

Active
$125,000
3
bds
|
1
ba
|
1,120
sqft
|
built
1900
212 Hancock St, Indianapolis, IN 46222
$175
Cash flow
7.3%
Cash-on-Cash Return
7.9%
Cap rate
1.0%
Rent to Value Ratio
Active
$94,900
3
bds
|
2
ba
|
976
sqft
|
built
1932
3221 E 38th St, Indianapolis, IN 46218
$264
Cash flow
14.5%
Cash-on-Cash Return
9.6%
Cap rate
1.2%
Rent to Value Ratio

Active
$292,000
3
bds
|
3
ba
|
1,109
sqft
|
built
1955
249 N Hamilton Ave, Indianapolis, IN 46201
$-765
Cash flow
-13.7%
Cash-on-Cash Return
3.1%
Cap rate
0.4%
Rent to Value Ratio

Active
$104,900
2
bds
|
1
ba
|
840
sqft
|
built
1958
1140 Mc Dougal St, Indianapolis, IN 46203
$211
Cash flow
10.5%
Cash-on-Cash Return
8.7%
Cap rate
1.0%
Rent to Value Ratio
Active
$254,900
bds
|
0
ba
|
0
sqft
|
built
1939
3135 Kentucky Ave, Indianapolis, IN 46221
$-365
Cash flow
-7.5%
Cash-on-Cash Return
4.5%
Cap rate
0.5%
Rent to Value Ratio
Active
$50,000
1
bds
|
0
ba
|
840
sqft
|
built
1935
3343 S Lyons Ave, Indianapolis, IN 46221
$759
Cash flow
17.7%
Cash-on-Cash Return
18.2%
Cap rate
2.2%
Rent to Value Ratio

Active
$575,000
4
bds
|
4
ba
|
2,240
sqft
|
built
1910
48 N Audubon Rd, Indianapolis, IN 46219
$-1,277
Cash flow
-11.6%
Cash-on-Cash Return
3.6%
Cap rate
0.4%
Rent to Value Ratio

Active
$165,000
3
bds
|
1
ba
|
1,344
sqft
|
built
1920
638 W 30th St, Indianapolis, IN 46208
$243
Cash flow
7.7%
Cash-on-Cash Return
8.0%
Cap rate
1.0%
Rent to Value Ratio

Active
$300,000
3
bds
|
2
ba
|
1,638
sqft
|
built
2016
923 S State Ave, Indianapolis, IN 46203
$-324
Cash flow
-5.6%
Cash-on-Cash Return
5.0%
Cap rate
0.6%
Rent to Value Ratio

Active
$210,000
2
bds
|
2
ba
|
1,214
sqft
|
built
1981
7950 Eagle Valley Pass, Indianapolis, IN 46214
$-331
Cash flow
-8.2%
Cash-on-Cash Return
4.4%
Cap rate
0.7%
Rent to Value Ratio

Active
$375,000
3
bds
|
3
ba
|
2,528
sqft
|
built
1896
1518 S Talbott St, Indianapolis, IN 46225
$-164
Cash flow
-2.3%
Cash-on-Cash Return
5.7%
Cap rate
0.7%
Rent to Value Ratio

Active
$329,900
3
bds
|
3
ba
|
2,079
sqft
|
built
1956
1002 Payton Ave, Indianapolis, IN 46219
$-204
Cash flow
-3.2%
Cash-on-Cash Return
5.5%
Cap rate
0.7%
Rent to Value Ratio

Active
$309,999
3
bds
|
2
ba
|
1,762
sqft
|
built
1920
1201 Villa Ave, Indianapolis, IN 46203
$176
Cash flow
3.0%
Cash-on-Cash Return
6.9%
Cap rate
0.8%
Rent to Value Ratio
Active
$278,500
3
bds
|
3
ba
|
2,264
sqft
|
built
2004
8211 Firefly Way, Indianapolis, IN 46259
$26
Cash flow
0.5%
Cash-on-Cash Return
6.4%
Cap rate
0.8%
Rent to Value Ratio

Active
$309,900
4
bds
|
3
ba
|
2,307
sqft
|
built
2003
8531 Friendship Ln, Indianapolis, IN 46217
$-238
Cash flow
-4.0%
Cash-on-Cash Return
5.3%
Cap rate
0.6%
Rent to Value Ratio
Active
$174,900
2
bds
|
1
ba
|
1,295
sqft
|
built
1946
3153 N Layman Ave, Indianapolis, IN 46218
$191
Cash flow
5.7%
Cash-on-Cash Return
7.6%
Cap rate
0.9%
Rent to Value Ratio
Active
$105,000
2
bds
|
1
ba
|
895
sqft
|
built
1918
2335 Union St, Indianapolis, IN 46225
$418
Cash flow
20.8%
Cash-on-Cash Return
11.0%
Cap rate
1.3%
Rent to Value Ratio

Active
$144,900
2
bds
|
1
ba
|
948
sqft
|
built
1959
1725 Medford Ave, Indianapolis, IN 46222
$210
Cash flow
7.6%
Cash-on-Cash Return
8.0%
Cap rate
1.0%
Rent to Value Ratio