Indianapolis, IN Investment Properties for Sale
Browse homes for sale and investment properties in Indianapolis, IN. Refine your search by price, property type, or more.
Best cash flowing properties in Indianapolis, IN
Active
$68,000
2
bds
|
1
ba
|
960
sqft
|
built
1949
3242 S Rybolt Ave, Indianapolis, IN 46221
$621
Cash flow
10.6%
Cash-on-Cash Return
11.0%
Cap rate
1.3%
Rent to Value Ratio
Active
$650,000
4
bds
|
4
ba
|
3,696
sqft
|
built
1988
10455 Courageous Dr, Indianapolis, IN 46236
$487
Cash flow
3.9%
Cash-on-Cash Return
7.2%
Cap rate
0.9%
Rent to Value Ratio
1,974 out of 2,115 properties for sale in Indianapolis, IN
Limited Results Shown
Create a free account, or log in to reveal all property listings and enjoy the complete experience.
Active
$139,500
1
bds
|
1
ba
|
1,000
sqft
|
built
1968
4000 N Meridian St, Indianapolis, IN 46208
$-386
Cash flow
-14.4%
Cash-on-Cash Return
3.0%
Cap rate
1.2%
Rent to Value Ratio
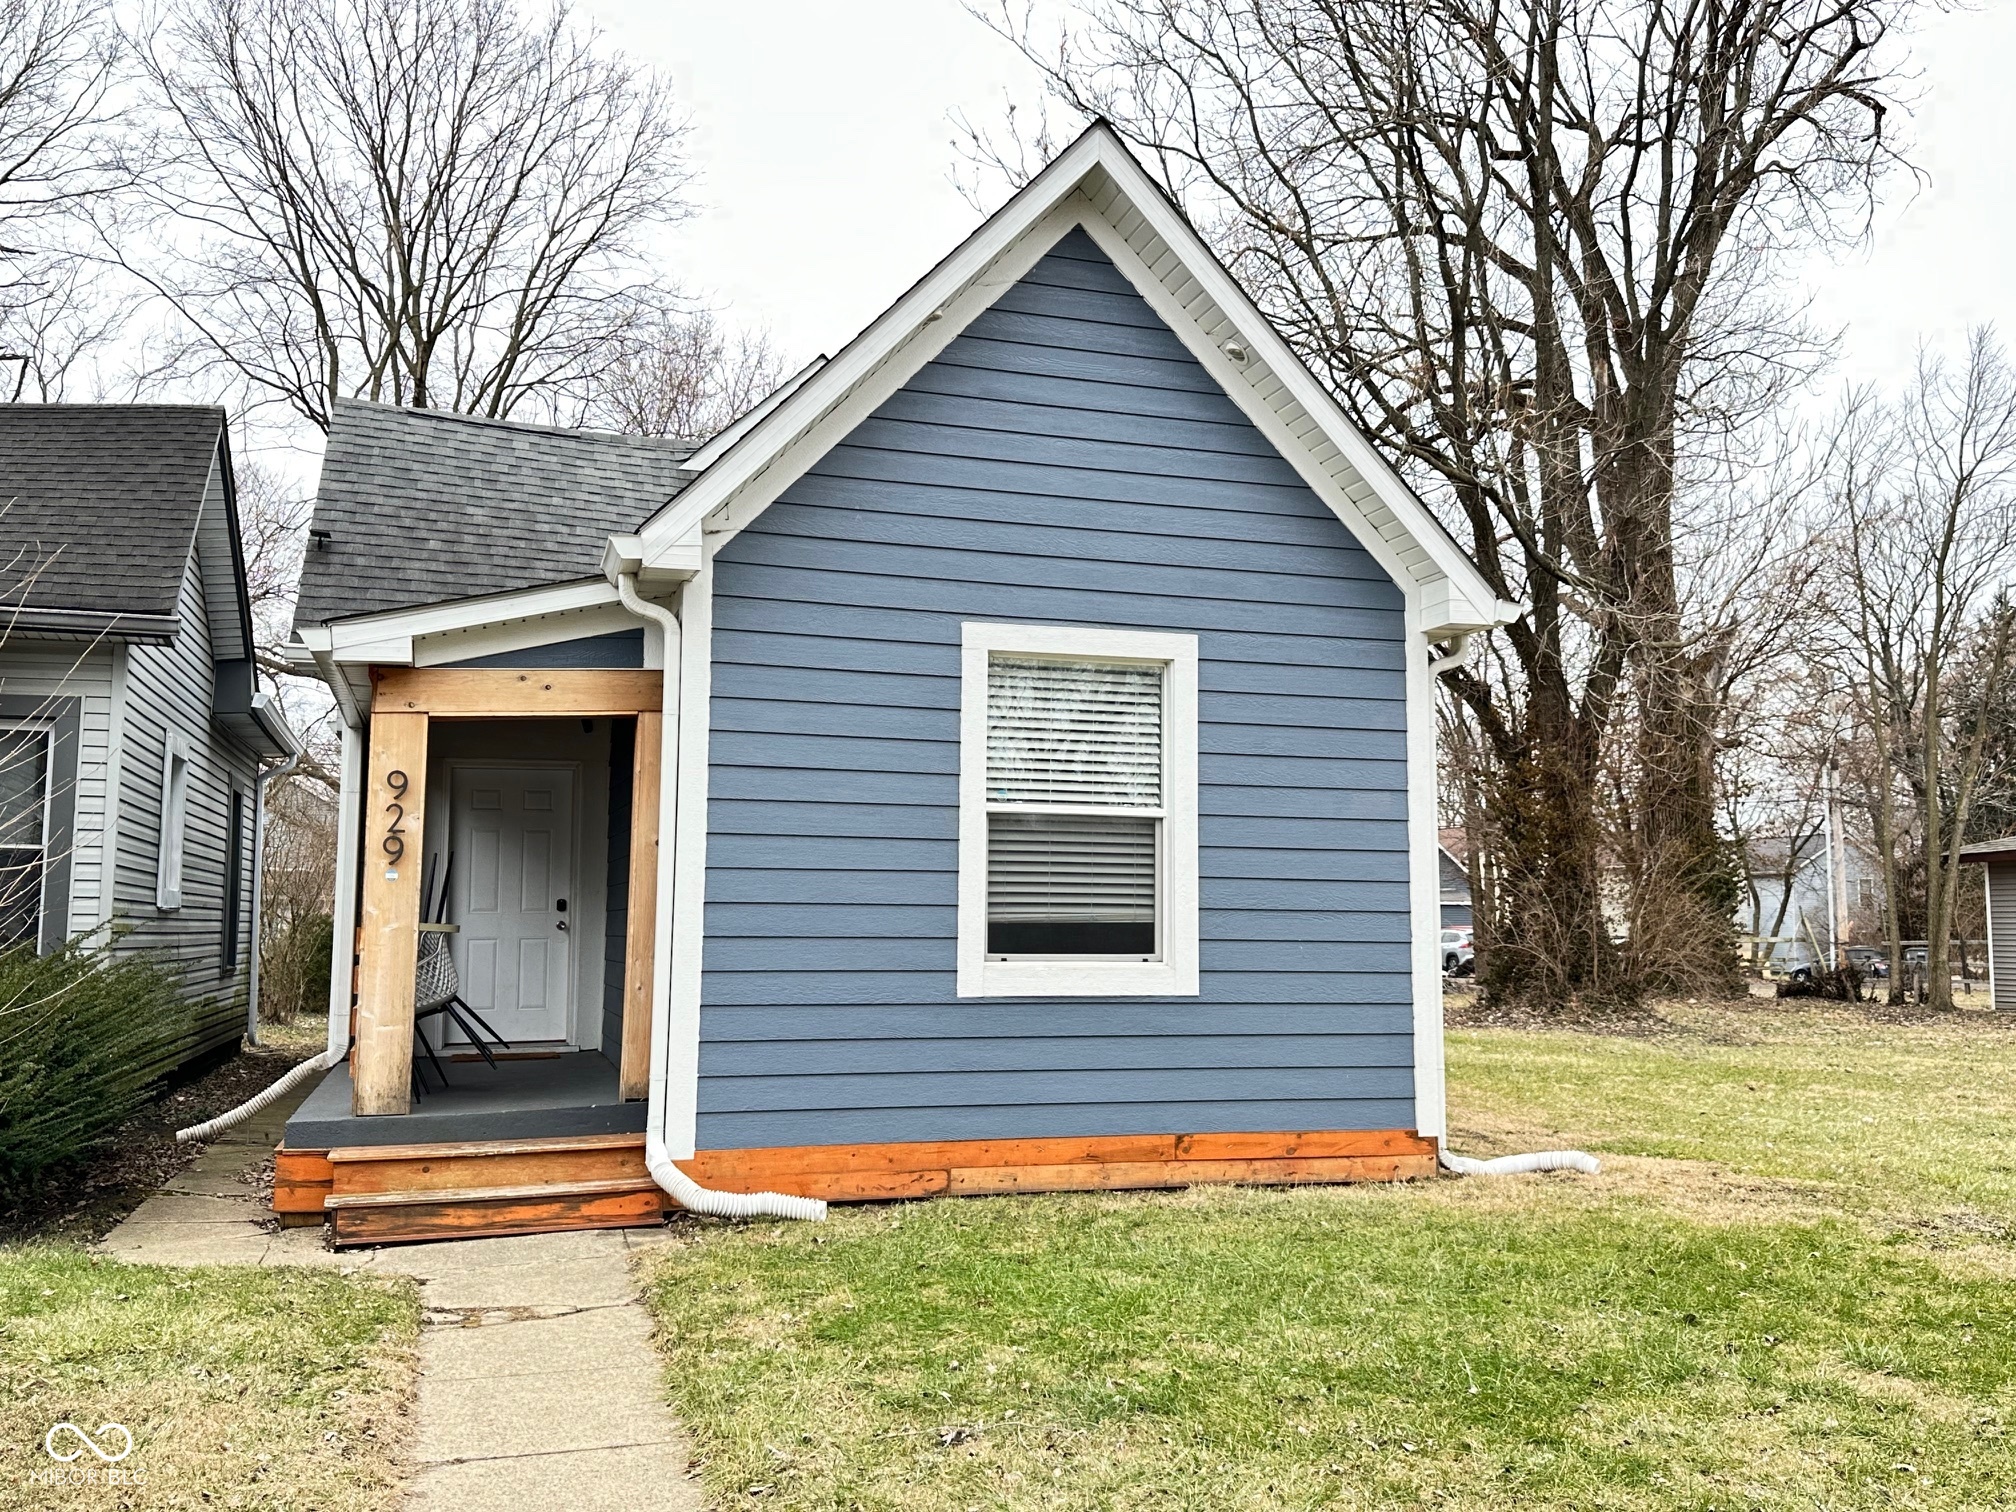
Active
$174,900
2
bds
|
2
ba
|
844
sqft
|
built
1910
929 Roache St, Indianapolis, IN 46208
$188
Cash flow
5.6%
Cash-on-Cash Return
7.6%
Cap rate
0.9%
Rent to Value Ratio
Active
$294,000
4
bds
|
3
ba
|
2,402
sqft
|
built
1910
3031 N New Jersey St, Indianapolis, IN 46205
$392
Cash flow
7.0%
Cash-on-Cash Return
7.9%
Cap rate
1.0%
Rent to Value Ratio
Active
$379,900
4
bds
|
3
ba
|
2,920
sqft
|
built
1910
337 N Beville Ave, Indianapolis, IN 46201
$-57
Cash flow
-0.8%
Cash-on-Cash Return
6.1%
Cap rate
0.7%
Rent to Value Ratio
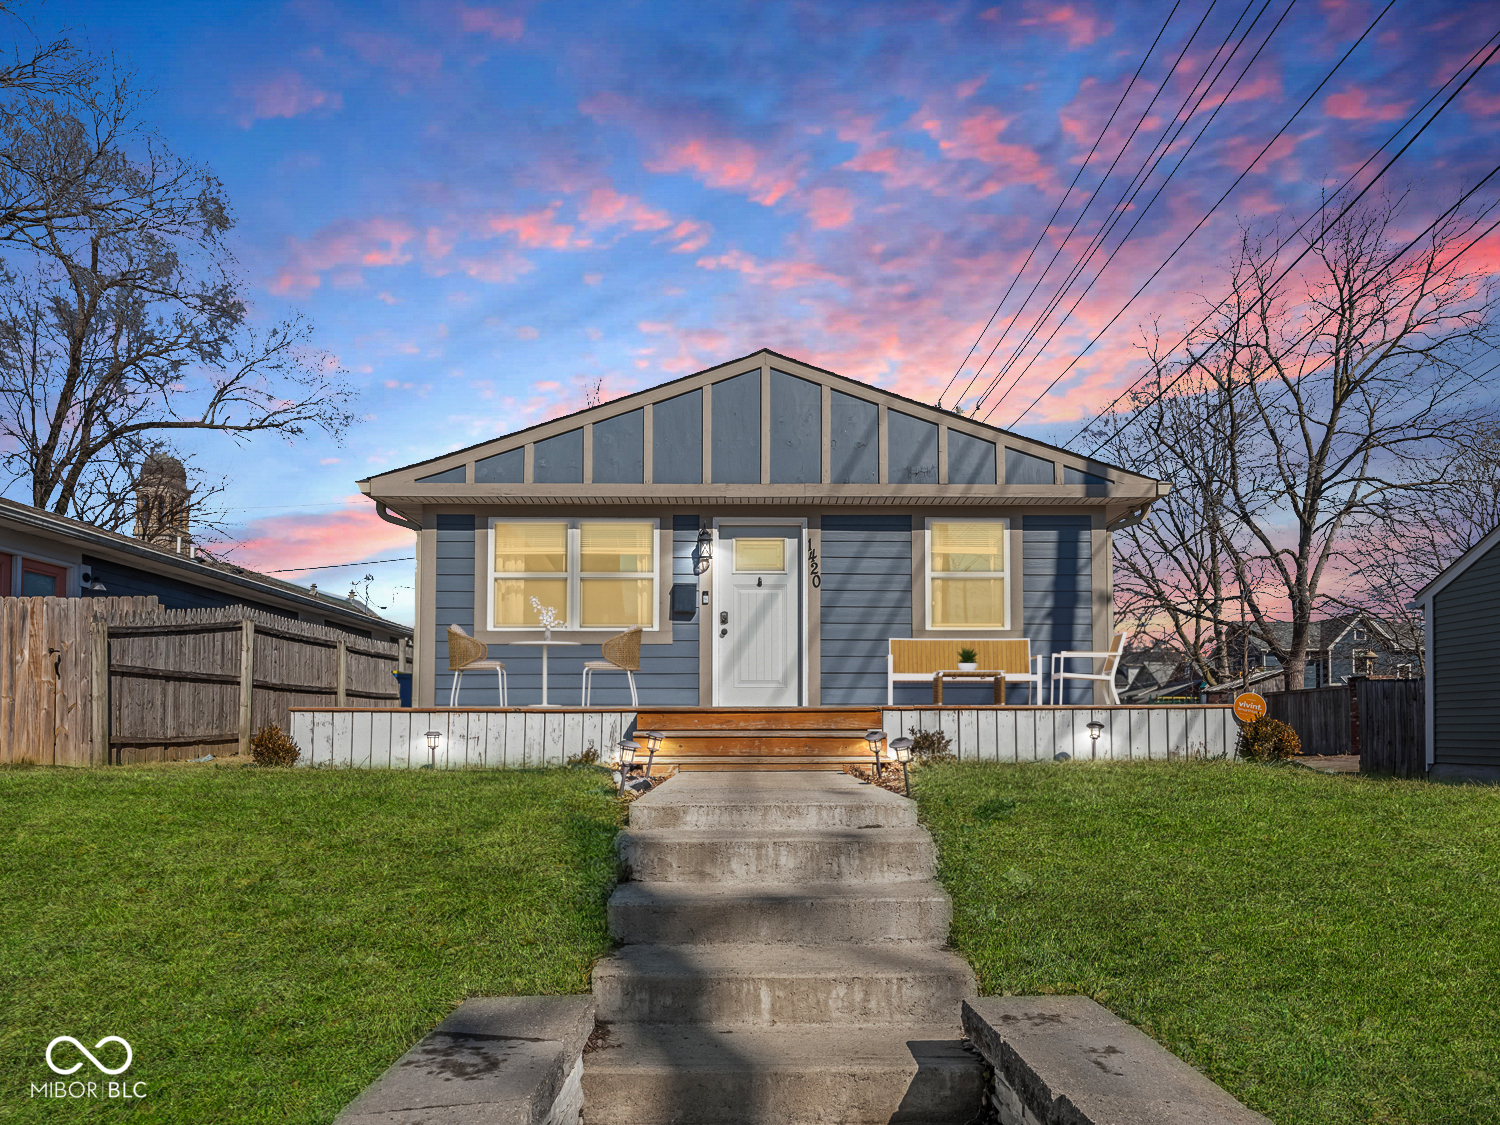
Active
$244,900
3
bds
|
2
ba
|
1,104
sqft
|
built
1970
1420 E Market St, Indianapolis, IN 46201
$-178
Cash flow
-3.8%
Cash-on-Cash Return
5.4%
Cap rate
0.7%
Rent to Value Ratio
Active
$113,900
3
bds
|
1
ba
|
920
sqft
|
built
1920
3209 Bethel Ave, Indianapolis, IN 46203
$301
Cash flow
13.8%
Cash-on-Cash Return
9.5%
Cap rate
1.1%
Rent to Value Ratio
Active
$262,500
3
bds
|
3
ba
|
1,964
sqft
|
built
1920
1601 Spruce St, Indianapolis, IN 46203
$5
Cash flow
0.1%
Cash-on-Cash Return
6.3%
Cap rate
0.8%
Rent to Value Ratio
Active
$292,000
3
bds
|
3
ba
|
1,109
sqft
|
built
1955
249 N Hamilton Ave, Indianapolis, IN 46201
$-770
Cash flow
-13.8%
Cash-on-Cash Return
3.1%
Cap rate
0.4%
Rent to Value Ratio
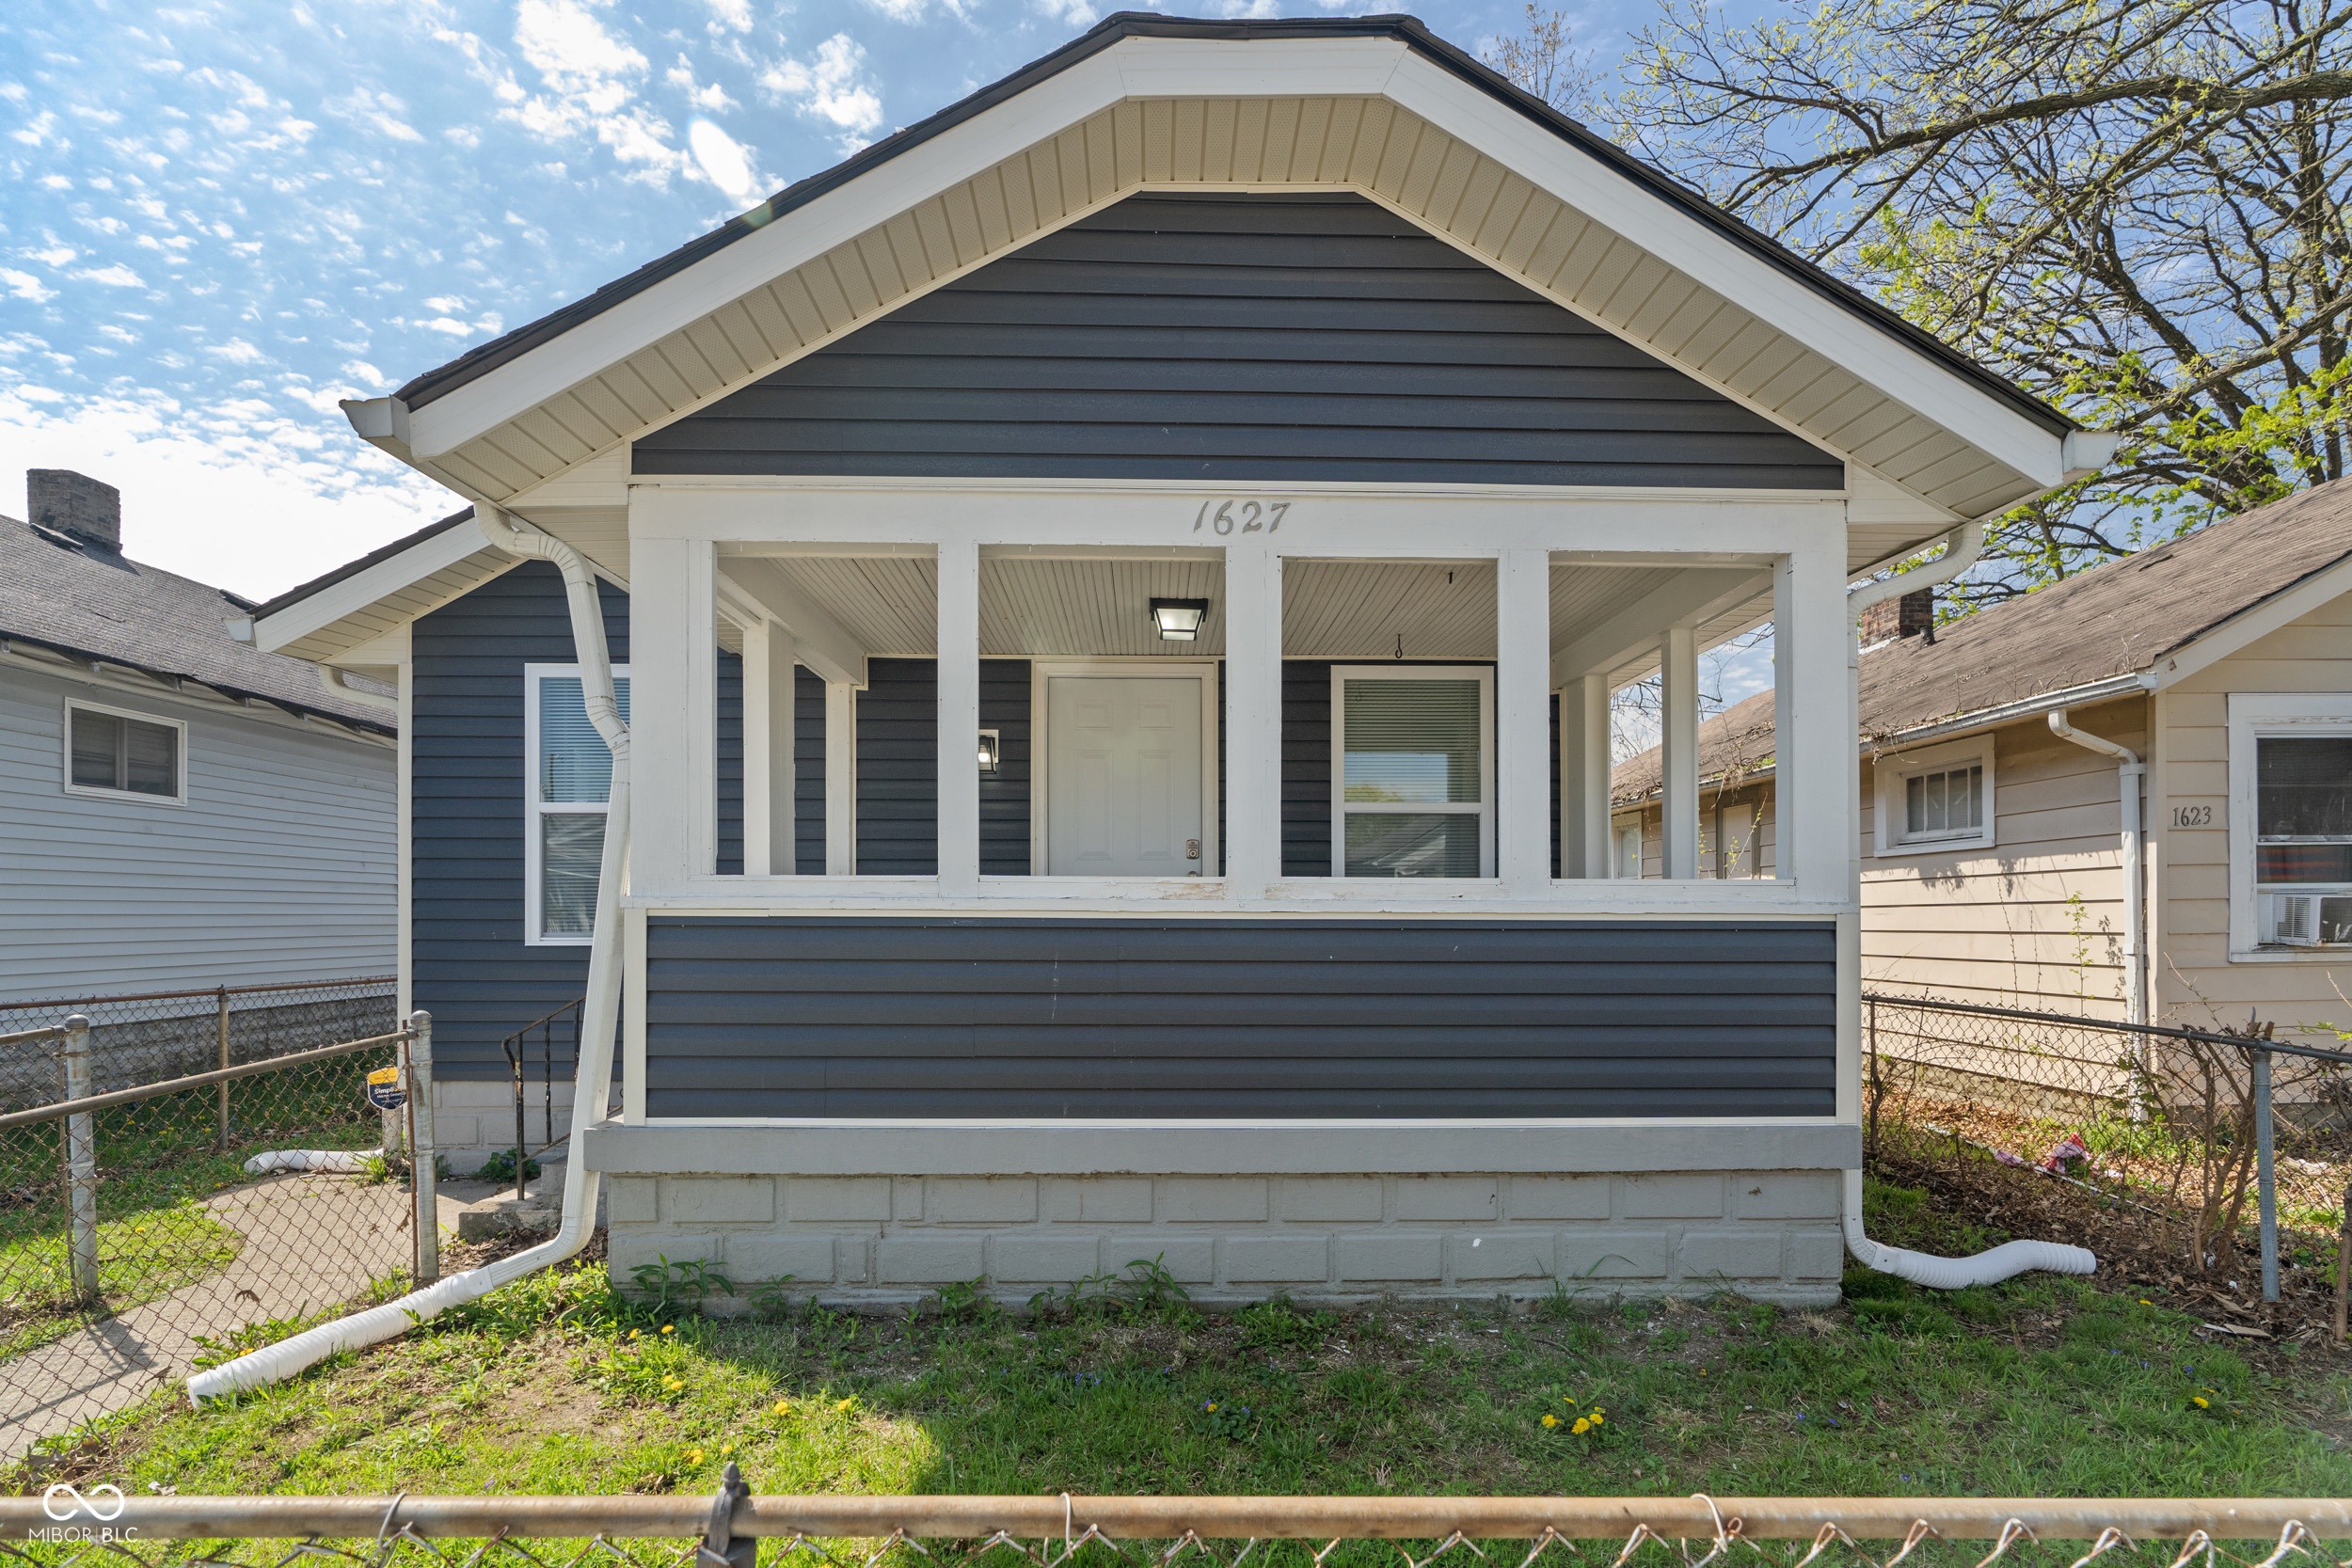
Active
$189,889
2
bds
|
2
ba
|
748
sqft
|
built
1930
1627 Lawton Ave, Indianapolis, IN 46203
$-28
Cash flow
-0.8%
Cash-on-Cash Return
6.1%
Cap rate
0.7%
Rent to Value Ratio
Active
$288,900
5
bds
|
2
ba
|
2,289
sqft
|
built
1956
1607 Elmhurst Dr, Indianapolis, IN 46219
$-271
Cash flow
-4.9%
Cash-on-Cash Return
5.2%
Cap rate
0.6%
Rent to Value Ratio
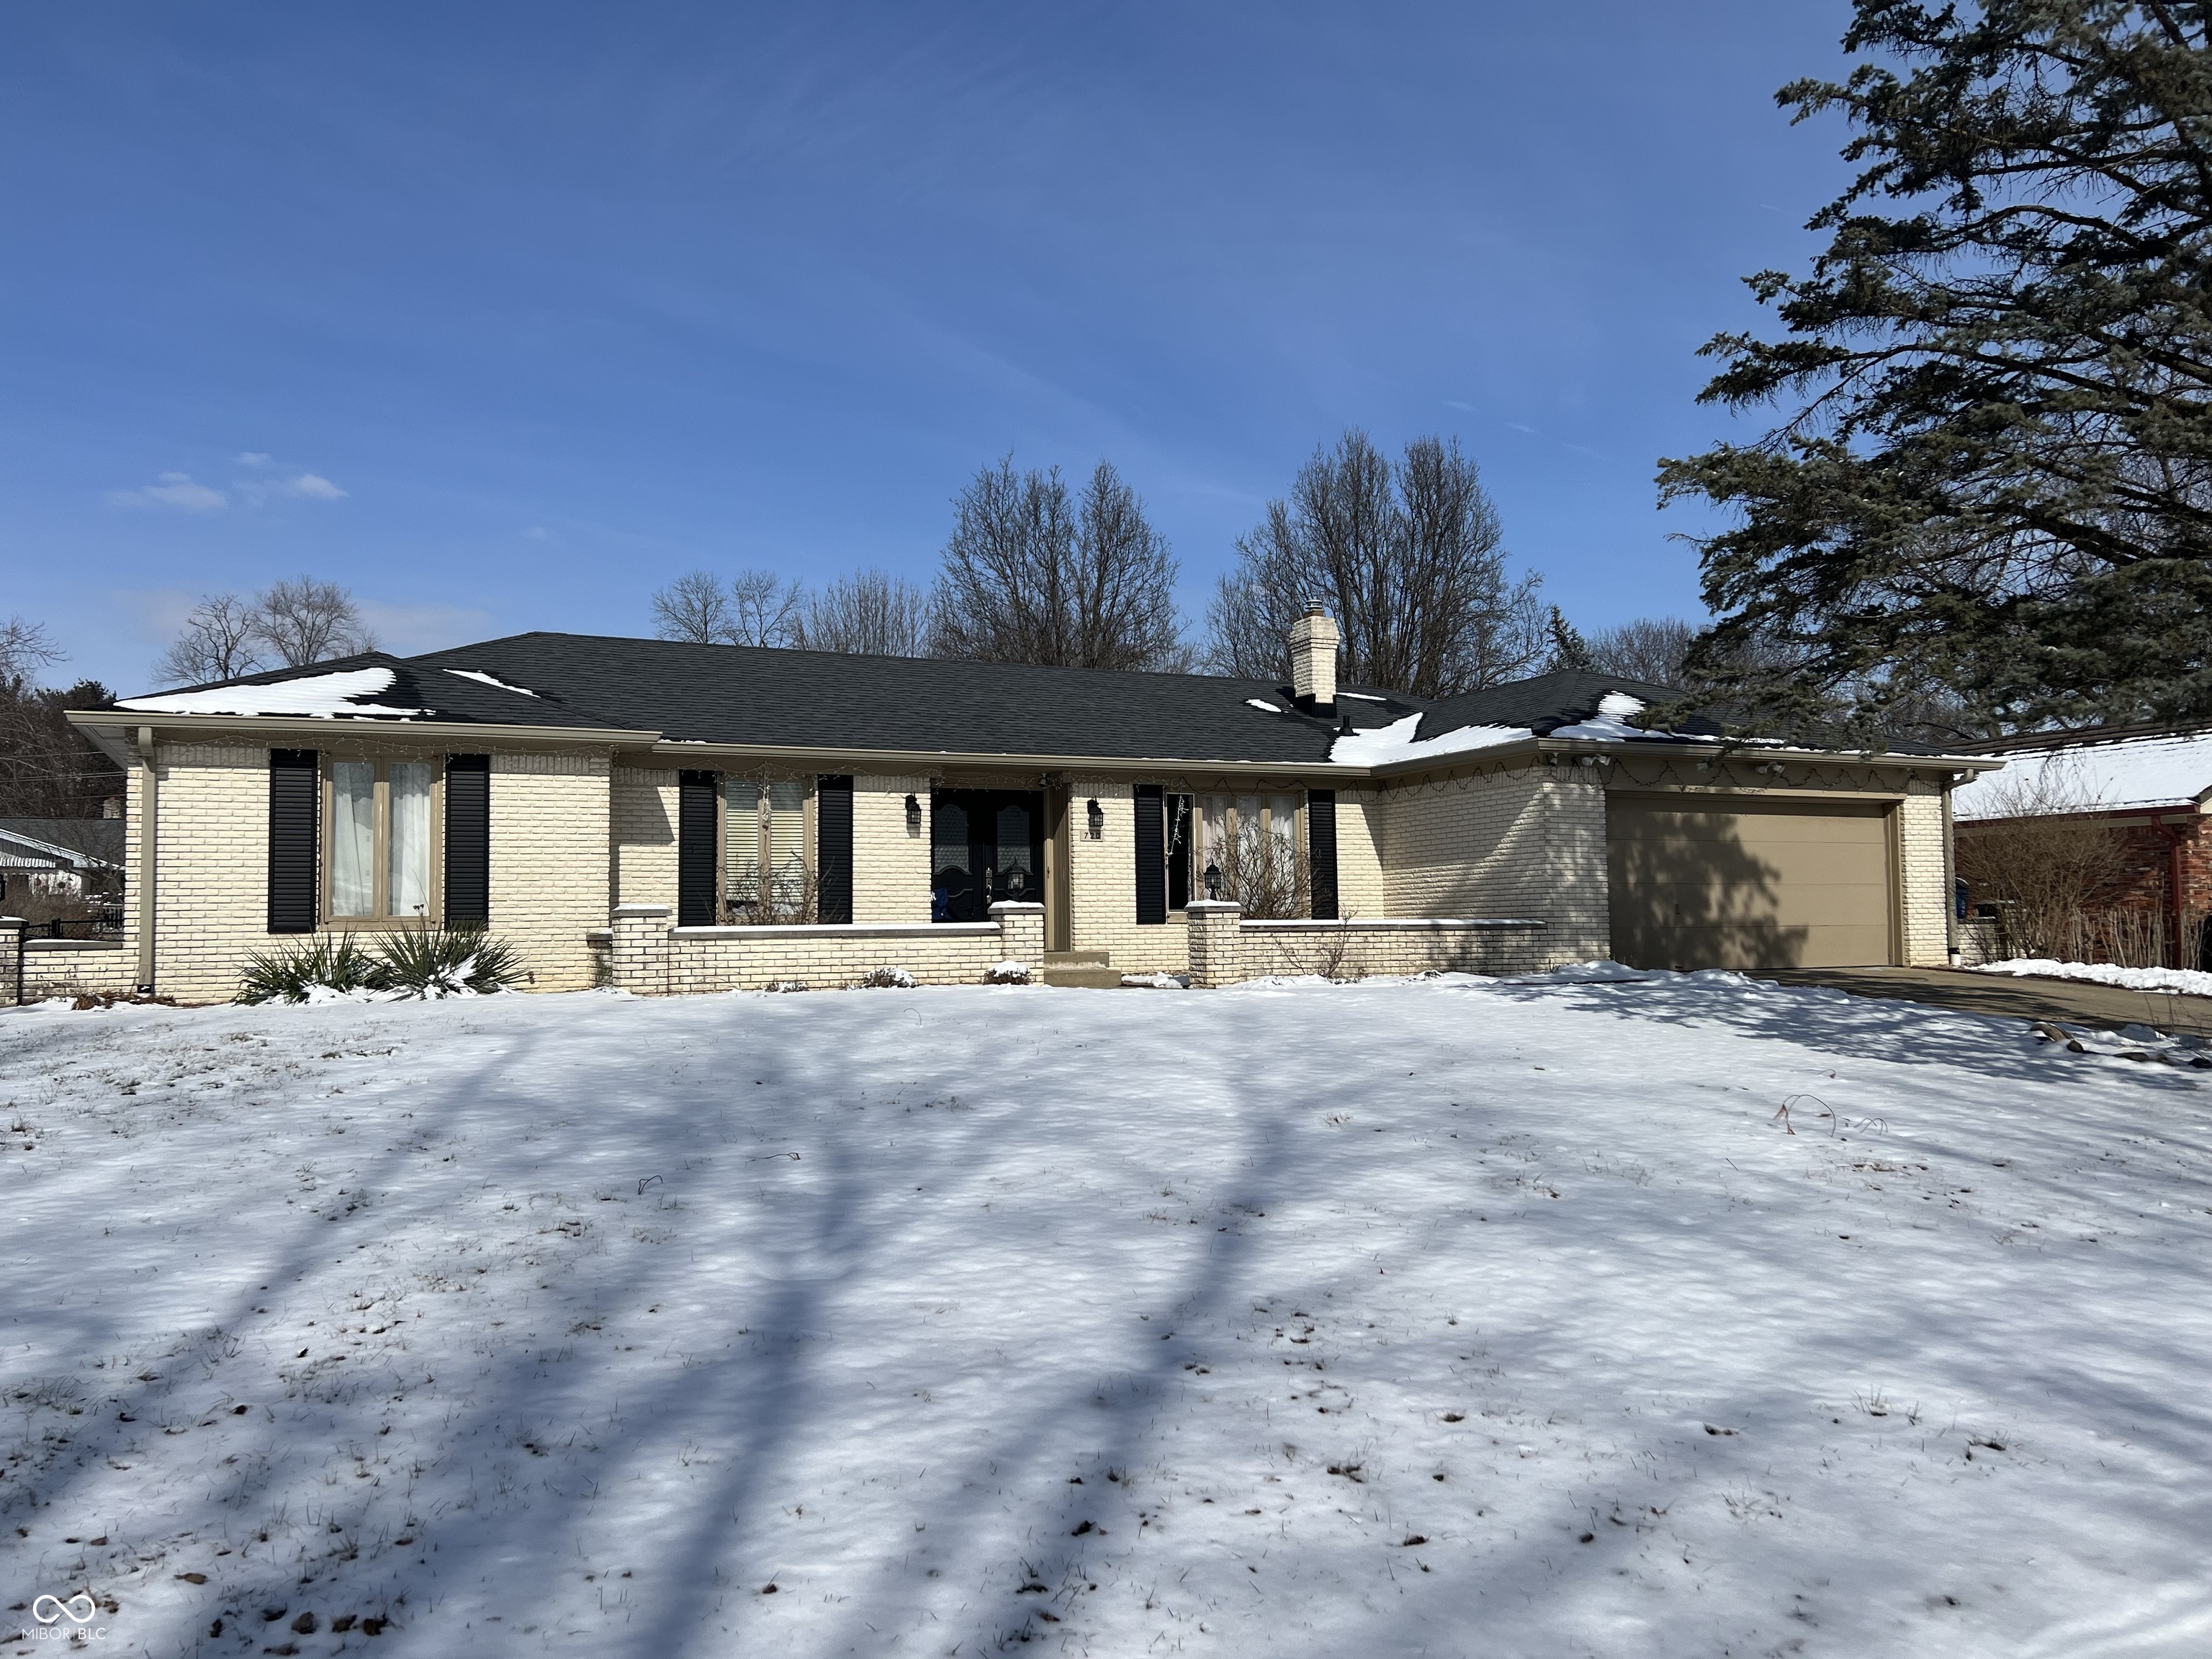
Active
$309,900
3
bds
|
2
ba
|
1,651
sqft
|
built
1972
720 Mount Rainier Dr, Indianapolis, IN 46217
$-411
Cash flow
-6.9%
Cash-on-Cash Return
4.7%
Cap rate
0.6%
Rent to Value Ratio
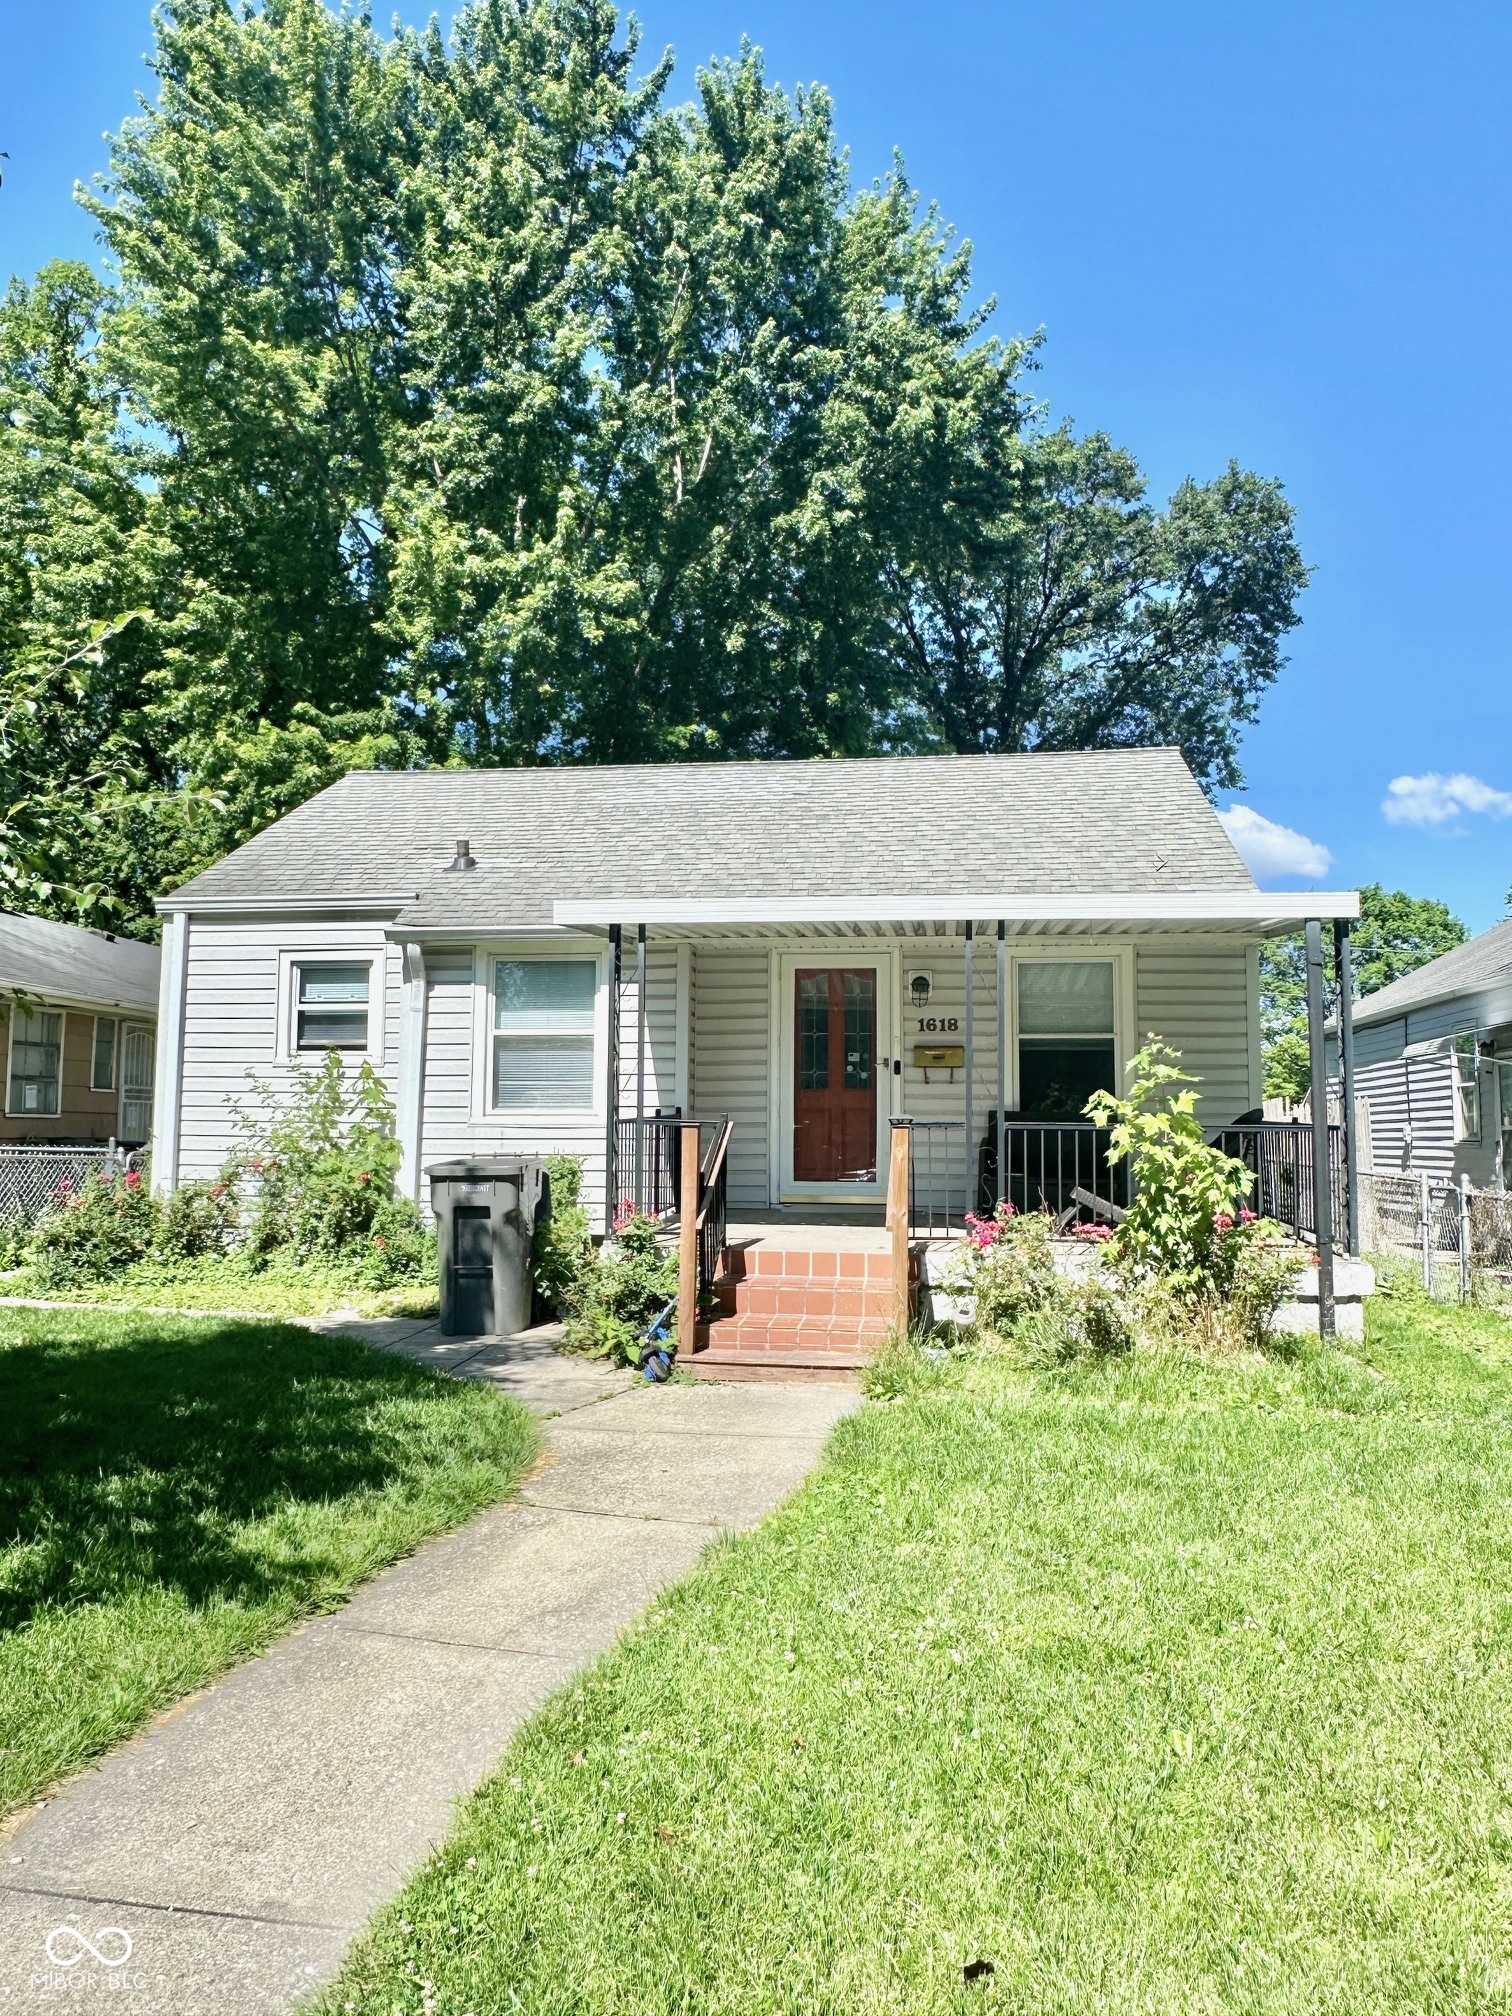
Active
$125,000
2
bds
|
1
ba
|
720
sqft
|
built
1950
1618 N Linwood Ave, Indianapolis, IN 46218
$242
Cash flow
10.1%
Cash-on-Cash Return
8.6%
Cap rate
1.0%
Rent to Value Ratio
Active
$105,000
2
bds
|
1
ba
|
895
sqft
|
built
1918
2335 Union St, Indianapolis, IN 46225
$416
Cash flow
20.7%
Cash-on-Cash Return
11.0%
Cap rate
1.3%
Rent to Value Ratio

Active
$145,000
2
bds
|
1
ba
|
726
sqft
|
built
1946
3128 S Holt Rd, Indianapolis, IN 46221
$138
Cash flow
5.0%
Cash-on-Cash Return
7.4%
Cap rate
0.9%
Rent to Value Ratio
Active
$225,000
4
bds
|
1
ba
|
1,809
sqft
|
built
1910
2534 Carrollton Ave, Indianapolis, IN 46205
$-212
Cash flow
-4.9%
Cash-on-Cash Return
5.2%
Cap rate
0.6%
Rent to Value Ratio
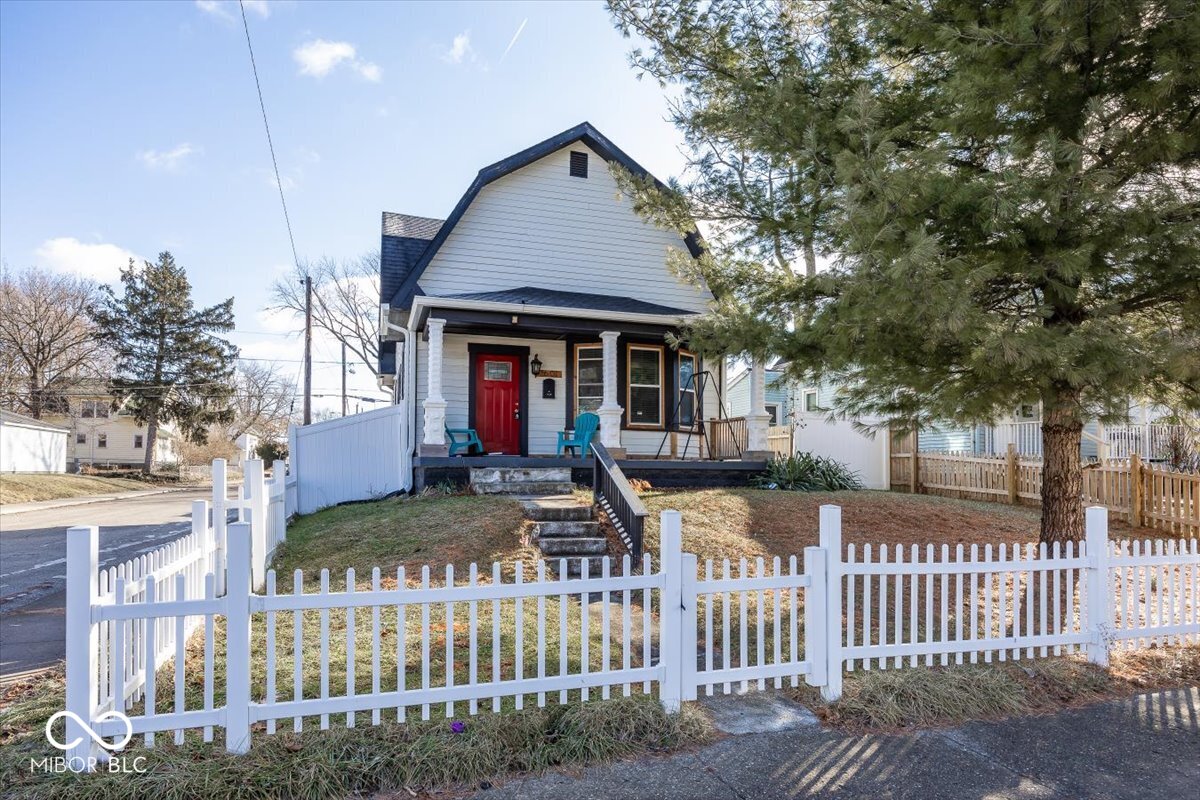
Active
$650,000
4
bds
|
4
ba
|
3,696
sqft
|
built
1988
10455 Courageous Dr, Indianapolis, IN 46236
$487
Cash flow
3.9%
Cash-on-Cash Return
7.2%
Cap rate
0.9%
Rent to Value Ratio
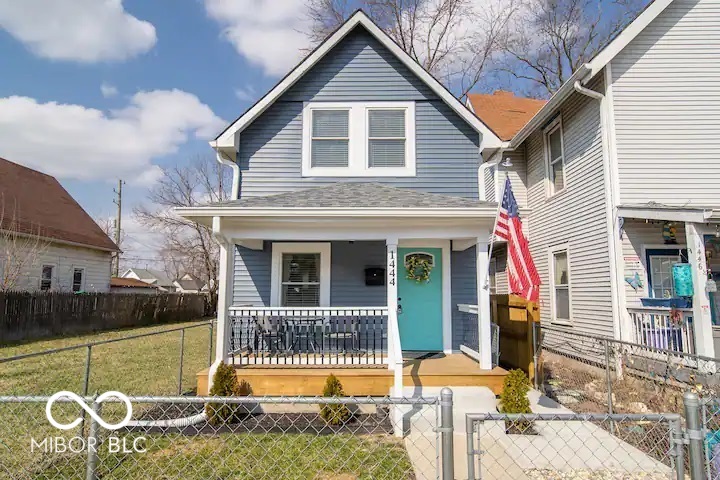
Pending
$315,000
3
bds
|
2
ba
|
1,190
sqft
|
built
1900
1444 English Ave, Indianapolis, IN 46201
$-270
Cash flow
-4.5%
Cash-on-Cash Return
5.3%
Cap rate
0.6%
Rent to Value Ratio
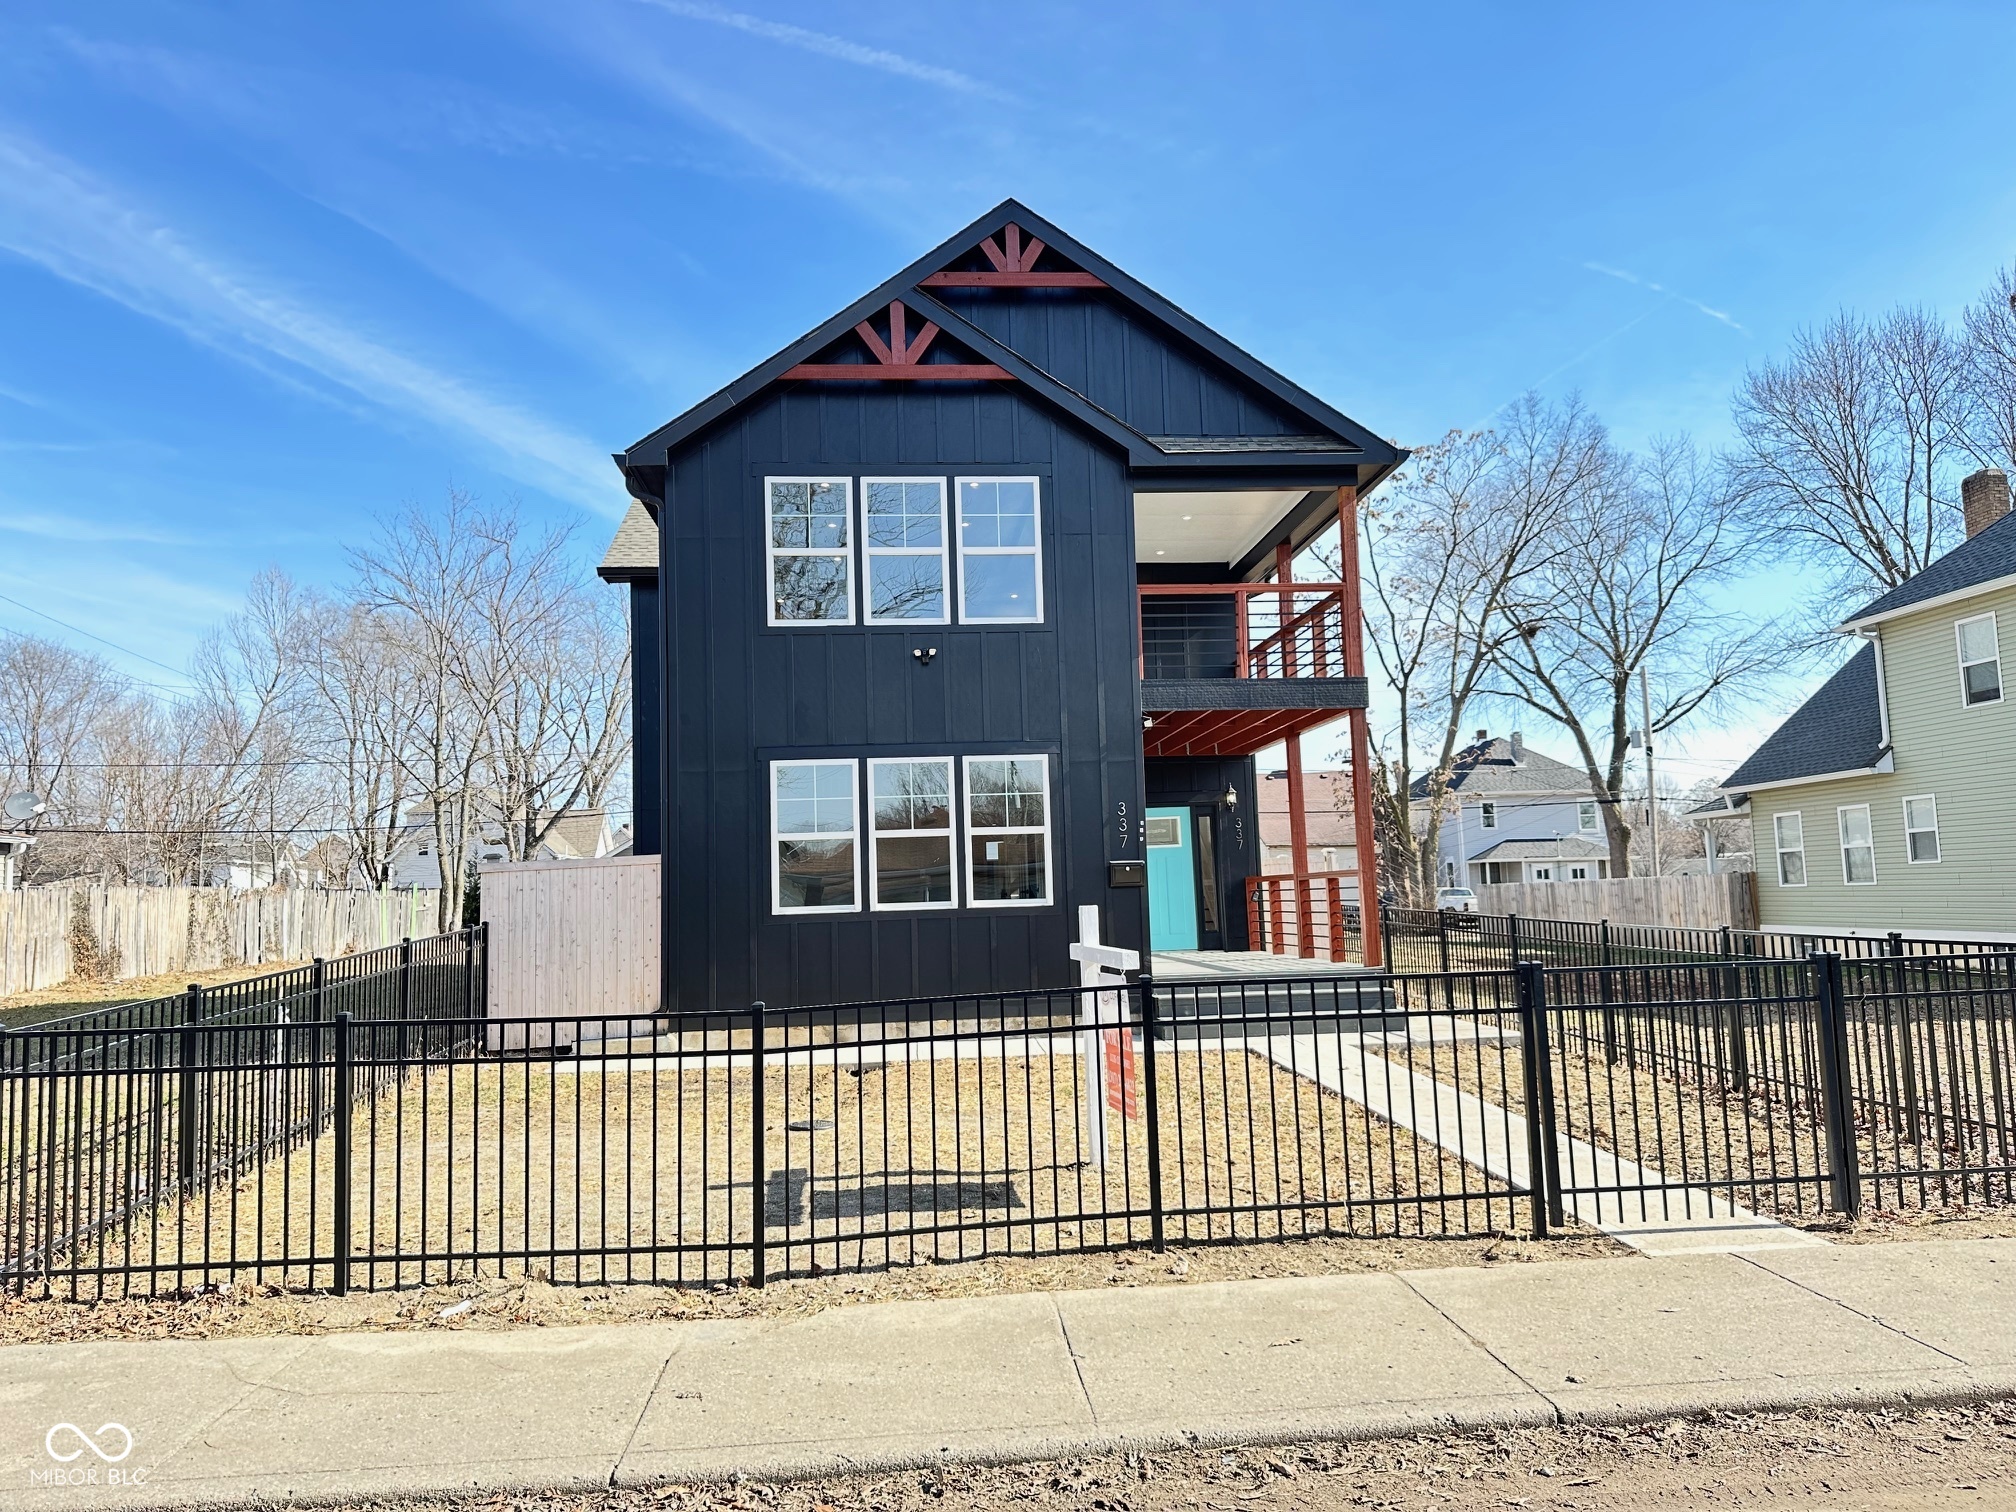
Active
$384,900
4
bds
|
3
ba
|
2,642
sqft
|
built
1926
1209 N Rural St, Indianapolis, IN 46201
$-222
Cash flow
-3.0%
Cash-on-Cash Return
5.6%
Cap rate
0.7%
Rent to Value Ratio
Active
$68,000
2
bds
|
1
ba
|
960
sqft
|
built
1949
3242 S Rybolt Ave, Indianapolis, IN 46221
$621
Cash flow
10.6%
Cash-on-Cash Return
11.0%
Cap rate
1.3%
Rent to Value Ratio
Active
$125,000
3
bds
|
1
ba
|
1,120
sqft
|
built
1900
212 Hancock St, Indianapolis, IN 46222
$173
Cash flow
7.2%
Cash-on-Cash Return
7.9%
Cap rate
1.0%
Rent to Value Ratio
Active
$273,000
6
bds
|
0
ba
|
0
sqft
|
built
1900
516 N Dearborn St, Indianapolis, IN 46201
$-671
Cash flow
-12.8%
Cash-on-Cash Return
3.3%
Cap rate
0.4%
Rent to Value Ratio
Active
$149,900
2
bds
|
1
ba
|
736
sqft
|
built
1948
1612 E Raymond St, Indianapolis, IN 46203
$181
Cash flow
6.3%
Cash-on-Cash Return
7.7%
Cap rate
0.9%
Rent to Value Ratio
Pending
$215,000
2
bds
|
3
ba
|
1,646
sqft
|
built
1993
6354 Cotton Bay Dr N, Indianapolis, IN 46254
$-79
Cash flow
-1.9%
Cash-on-Cash Return
5.8%
Cap rate
0.8%
Rent to Value Ratio
Active
$399,900
4
bds
|
3
ba
|
3,861
sqft
|
built
1920
909 E 38th St, Indianapolis, IN 46205
$-369
Cash flow
-4.8%
Cash-on-Cash Return
5.2%
Cap rate
0.6%
Rent to Value Ratio
Active
$249,900
4
bds
|
0
ba
|
0
sqft
|
built
1980
1802 Woodlawn Ave, Indianapolis, IN 46203
$-550
Cash flow
-11.5%
Cash-on-Cash Return
3.6%
Cap rate
0.4%
Rent to Value Ratio
Active
$124,000
3
bds
|
1
ba
|
840
sqft
|
built
1920
3142 N Euclid Ave, Indianapolis, IN 46218
$110
Cash flow
4.6%
Cash-on-Cash Return
7.3%
Cap rate
0.9%
Rent to Value Ratio
Active
$149,900
2
bds
|
2
ba
|
1,508
sqft
|
built
1920
1137 W 34th St, Indianapolis, IN 46208
$-26
Cash flow
-0.9%
Cash-on-Cash Return
6.1%
Cap rate
0.7%
Rent to Value Ratio
Active
$615,000
4
bds
|
5
ba
|
4,342
sqft
|
built
1994
6640 Greenridge Dr, Indianapolis, IN 46278
$-676
Cash flow
-5.7%
Cash-on-Cash Return
5.0%
Cap rate
0.6%
Rent to Value Ratio
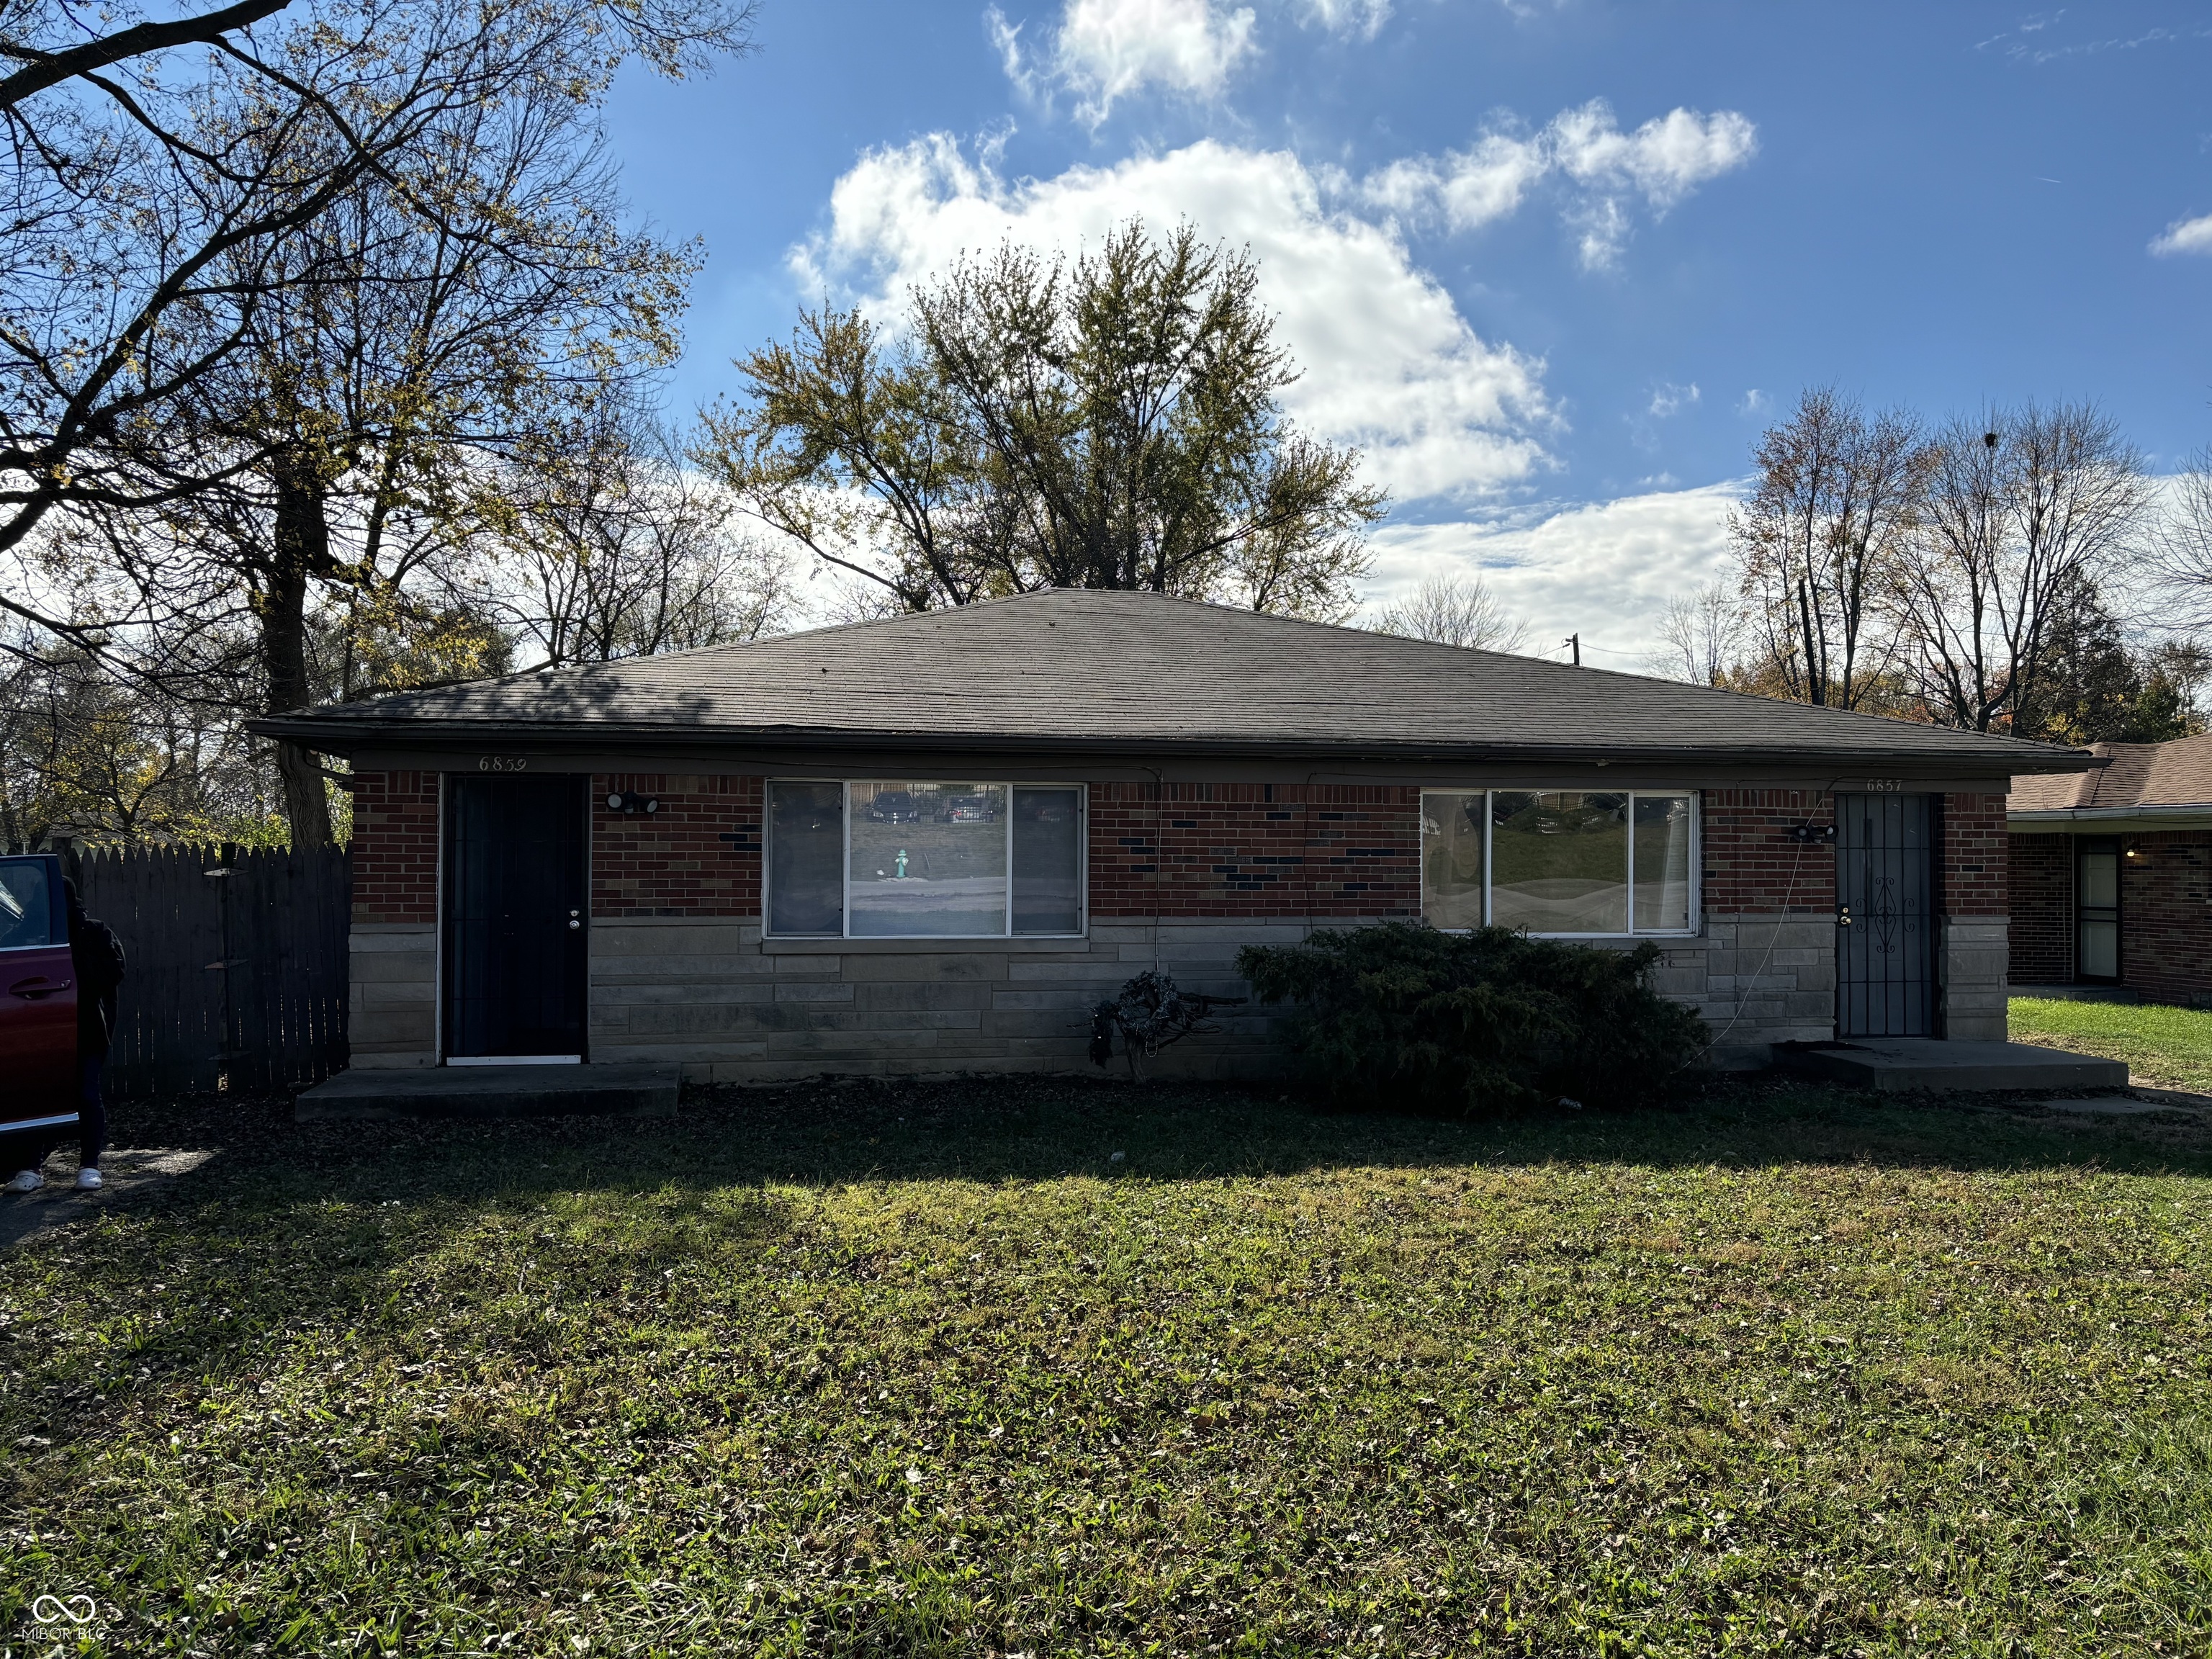
Active
$210,000
bds
|
0
ba
|
0
sqft
|
built
1965
6857 E 42nd St, Indianapolis, IN 46226
$-341
Cash flow
-8.5%
Cash-on-Cash Return
4.3%
Cap rate
0.5%
Rent to Value Ratio
Active
$139,900
3
bds
|
2
ba
|
1,300
sqft
|
built
1973
4984 W 59th St, Indianapolis, IN 46254
$26
Cash flow
1.0%
Cash-on-Cash Return
6.5%
Cap rate
1.1%
Rent to Value Ratio
Active
$347,000
4
bds
|
3
ba
|
3,660
sqft
|
built
1999
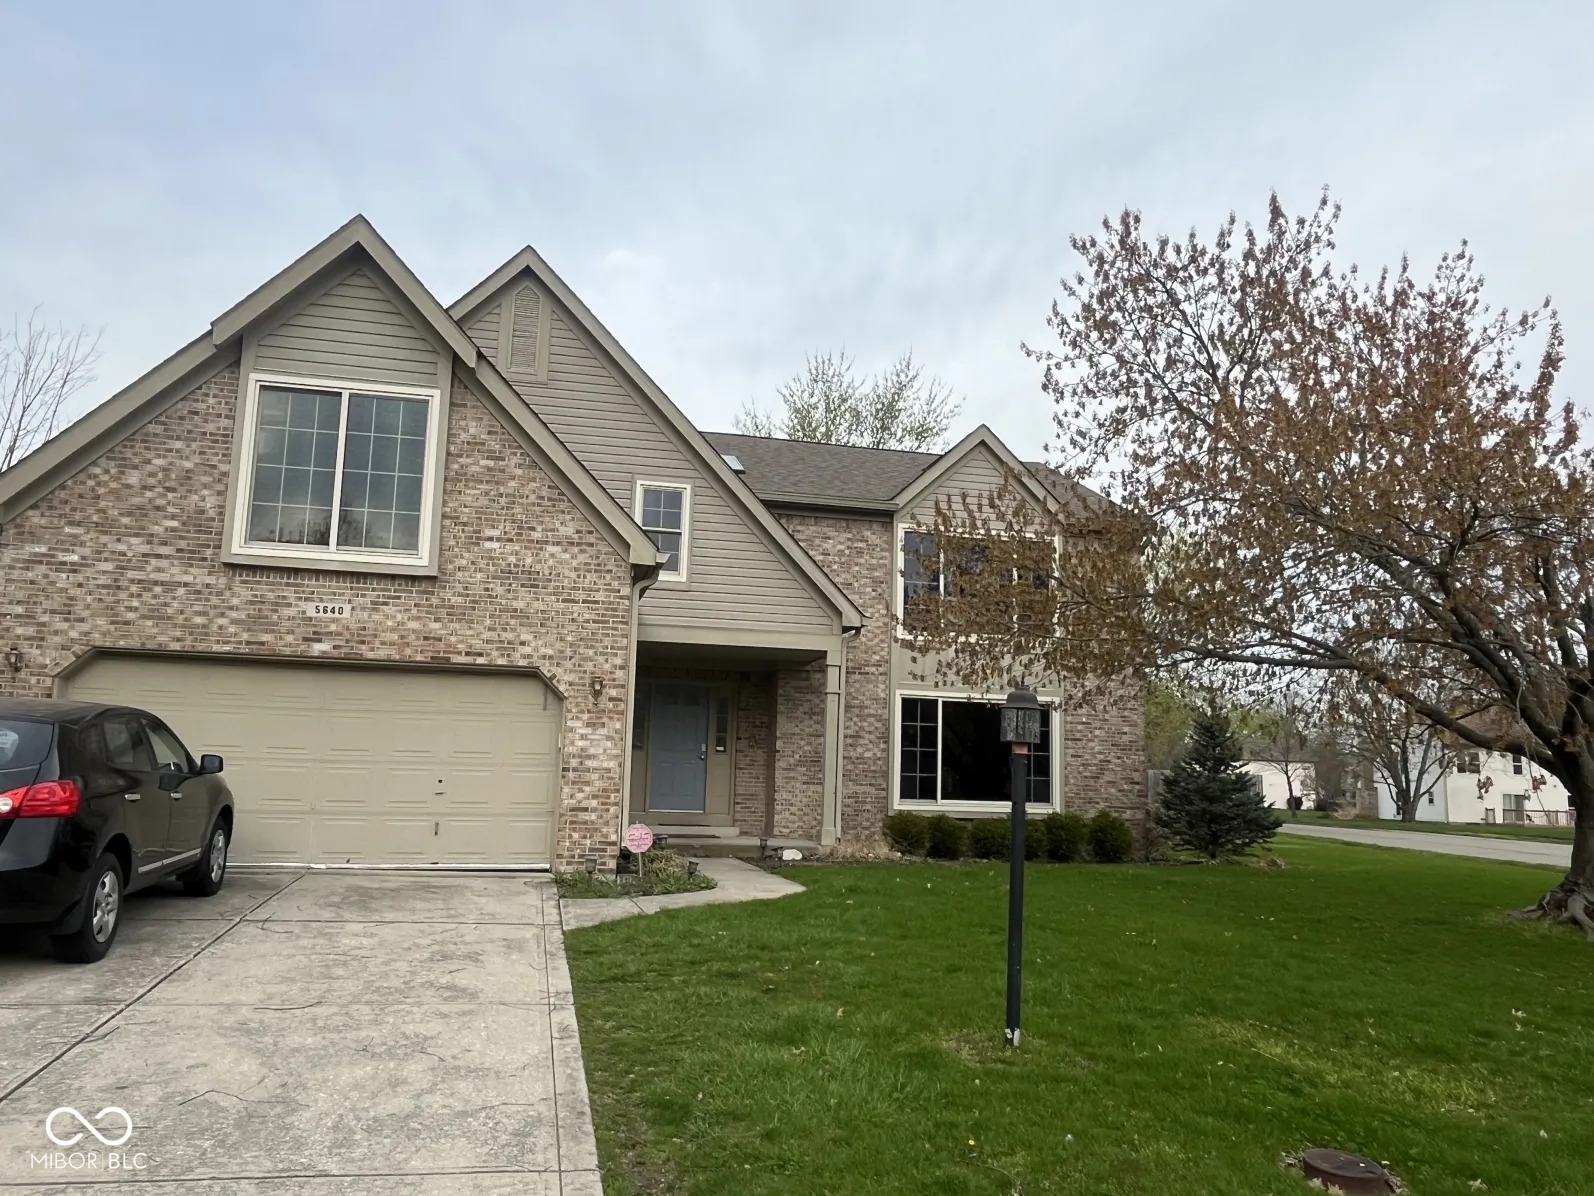
5640 Dapple Ct, Indianapolis, IN 46228
$23
Cash flow
0.3%
Cash-on-Cash Return
6.4%
Cap rate
0.8%
Rent to Value Ratio
Active
$370,000
4
bds
|
3
ba
|
2,247
sqft
|
built
1913
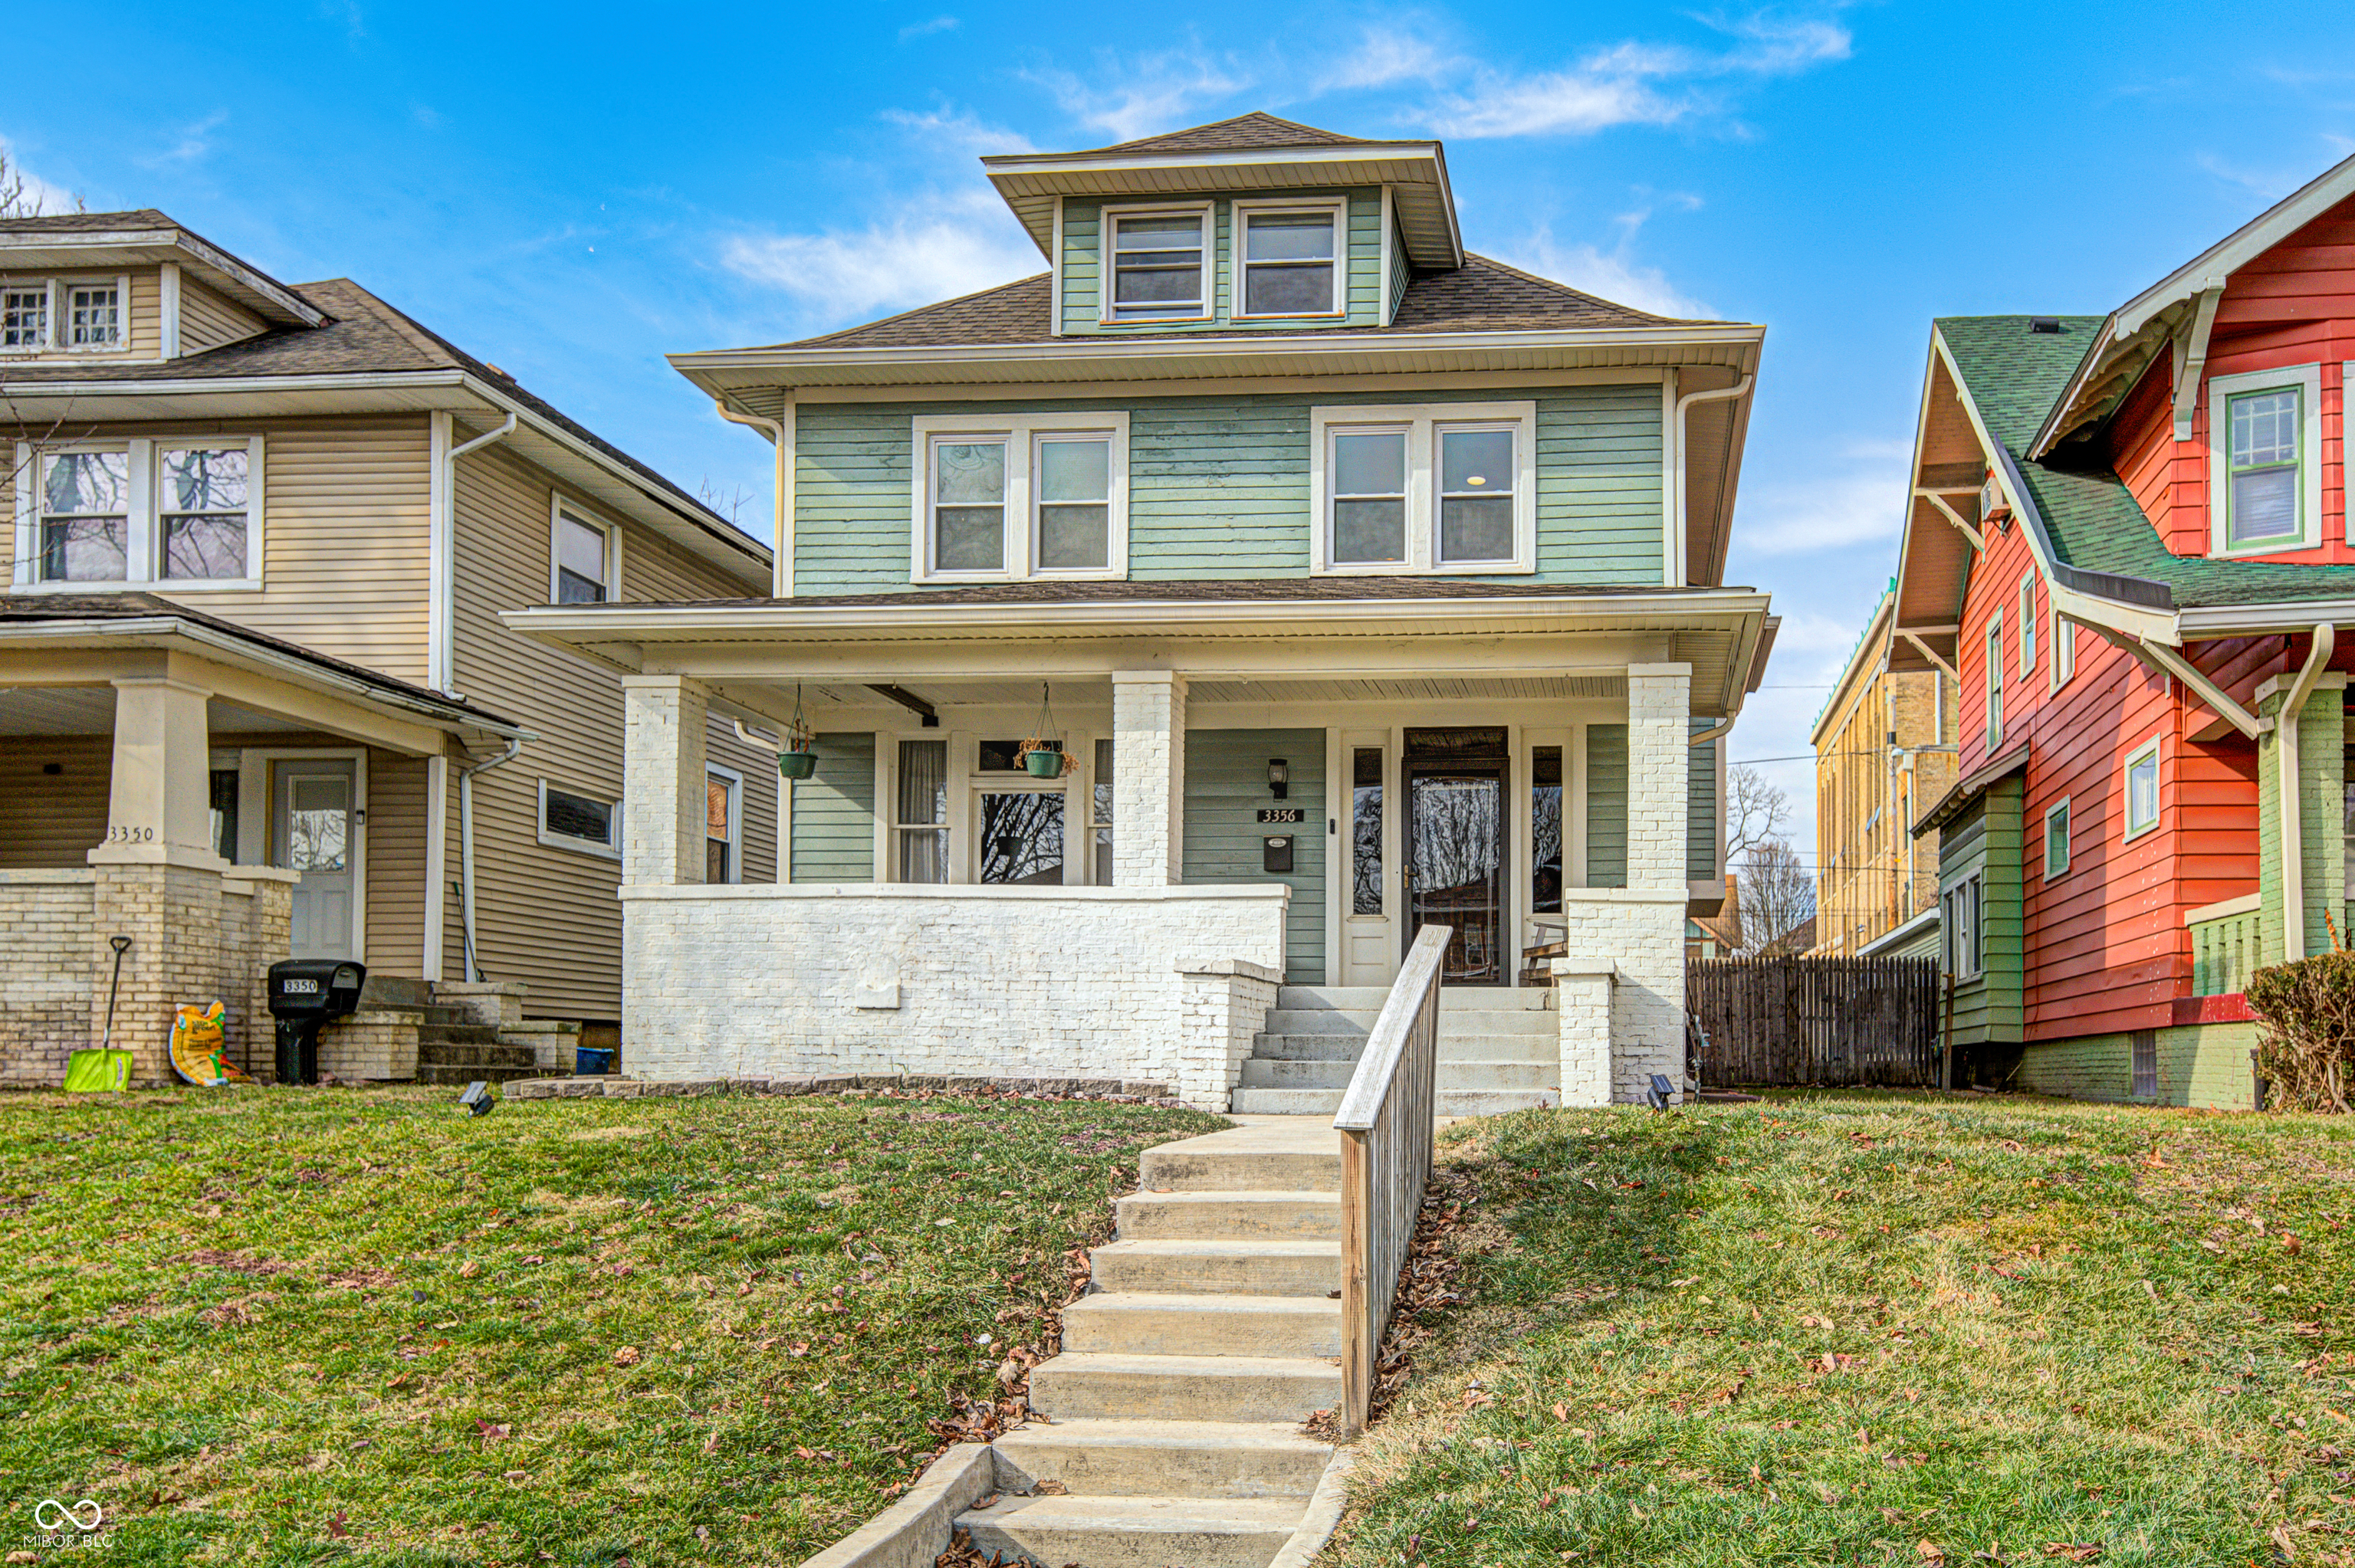
3356 N Park Ave, Indianapolis, IN 46205
$-144
Cash flow
-2.0%
Cash-on-Cash Return
5.8%
Cap rate
0.7%
Rent to Value Ratio
Pending
$210,000
4
bds
|
2
ba
|
1,367
sqft
|
built
1920
3940 N Drexel Ave, Indianapolis, IN 46226
$-203
Cash flow
-5.0%
Cash-on-Cash Return
5.1%
Cap rate
0.6%
Rent to Value Ratio
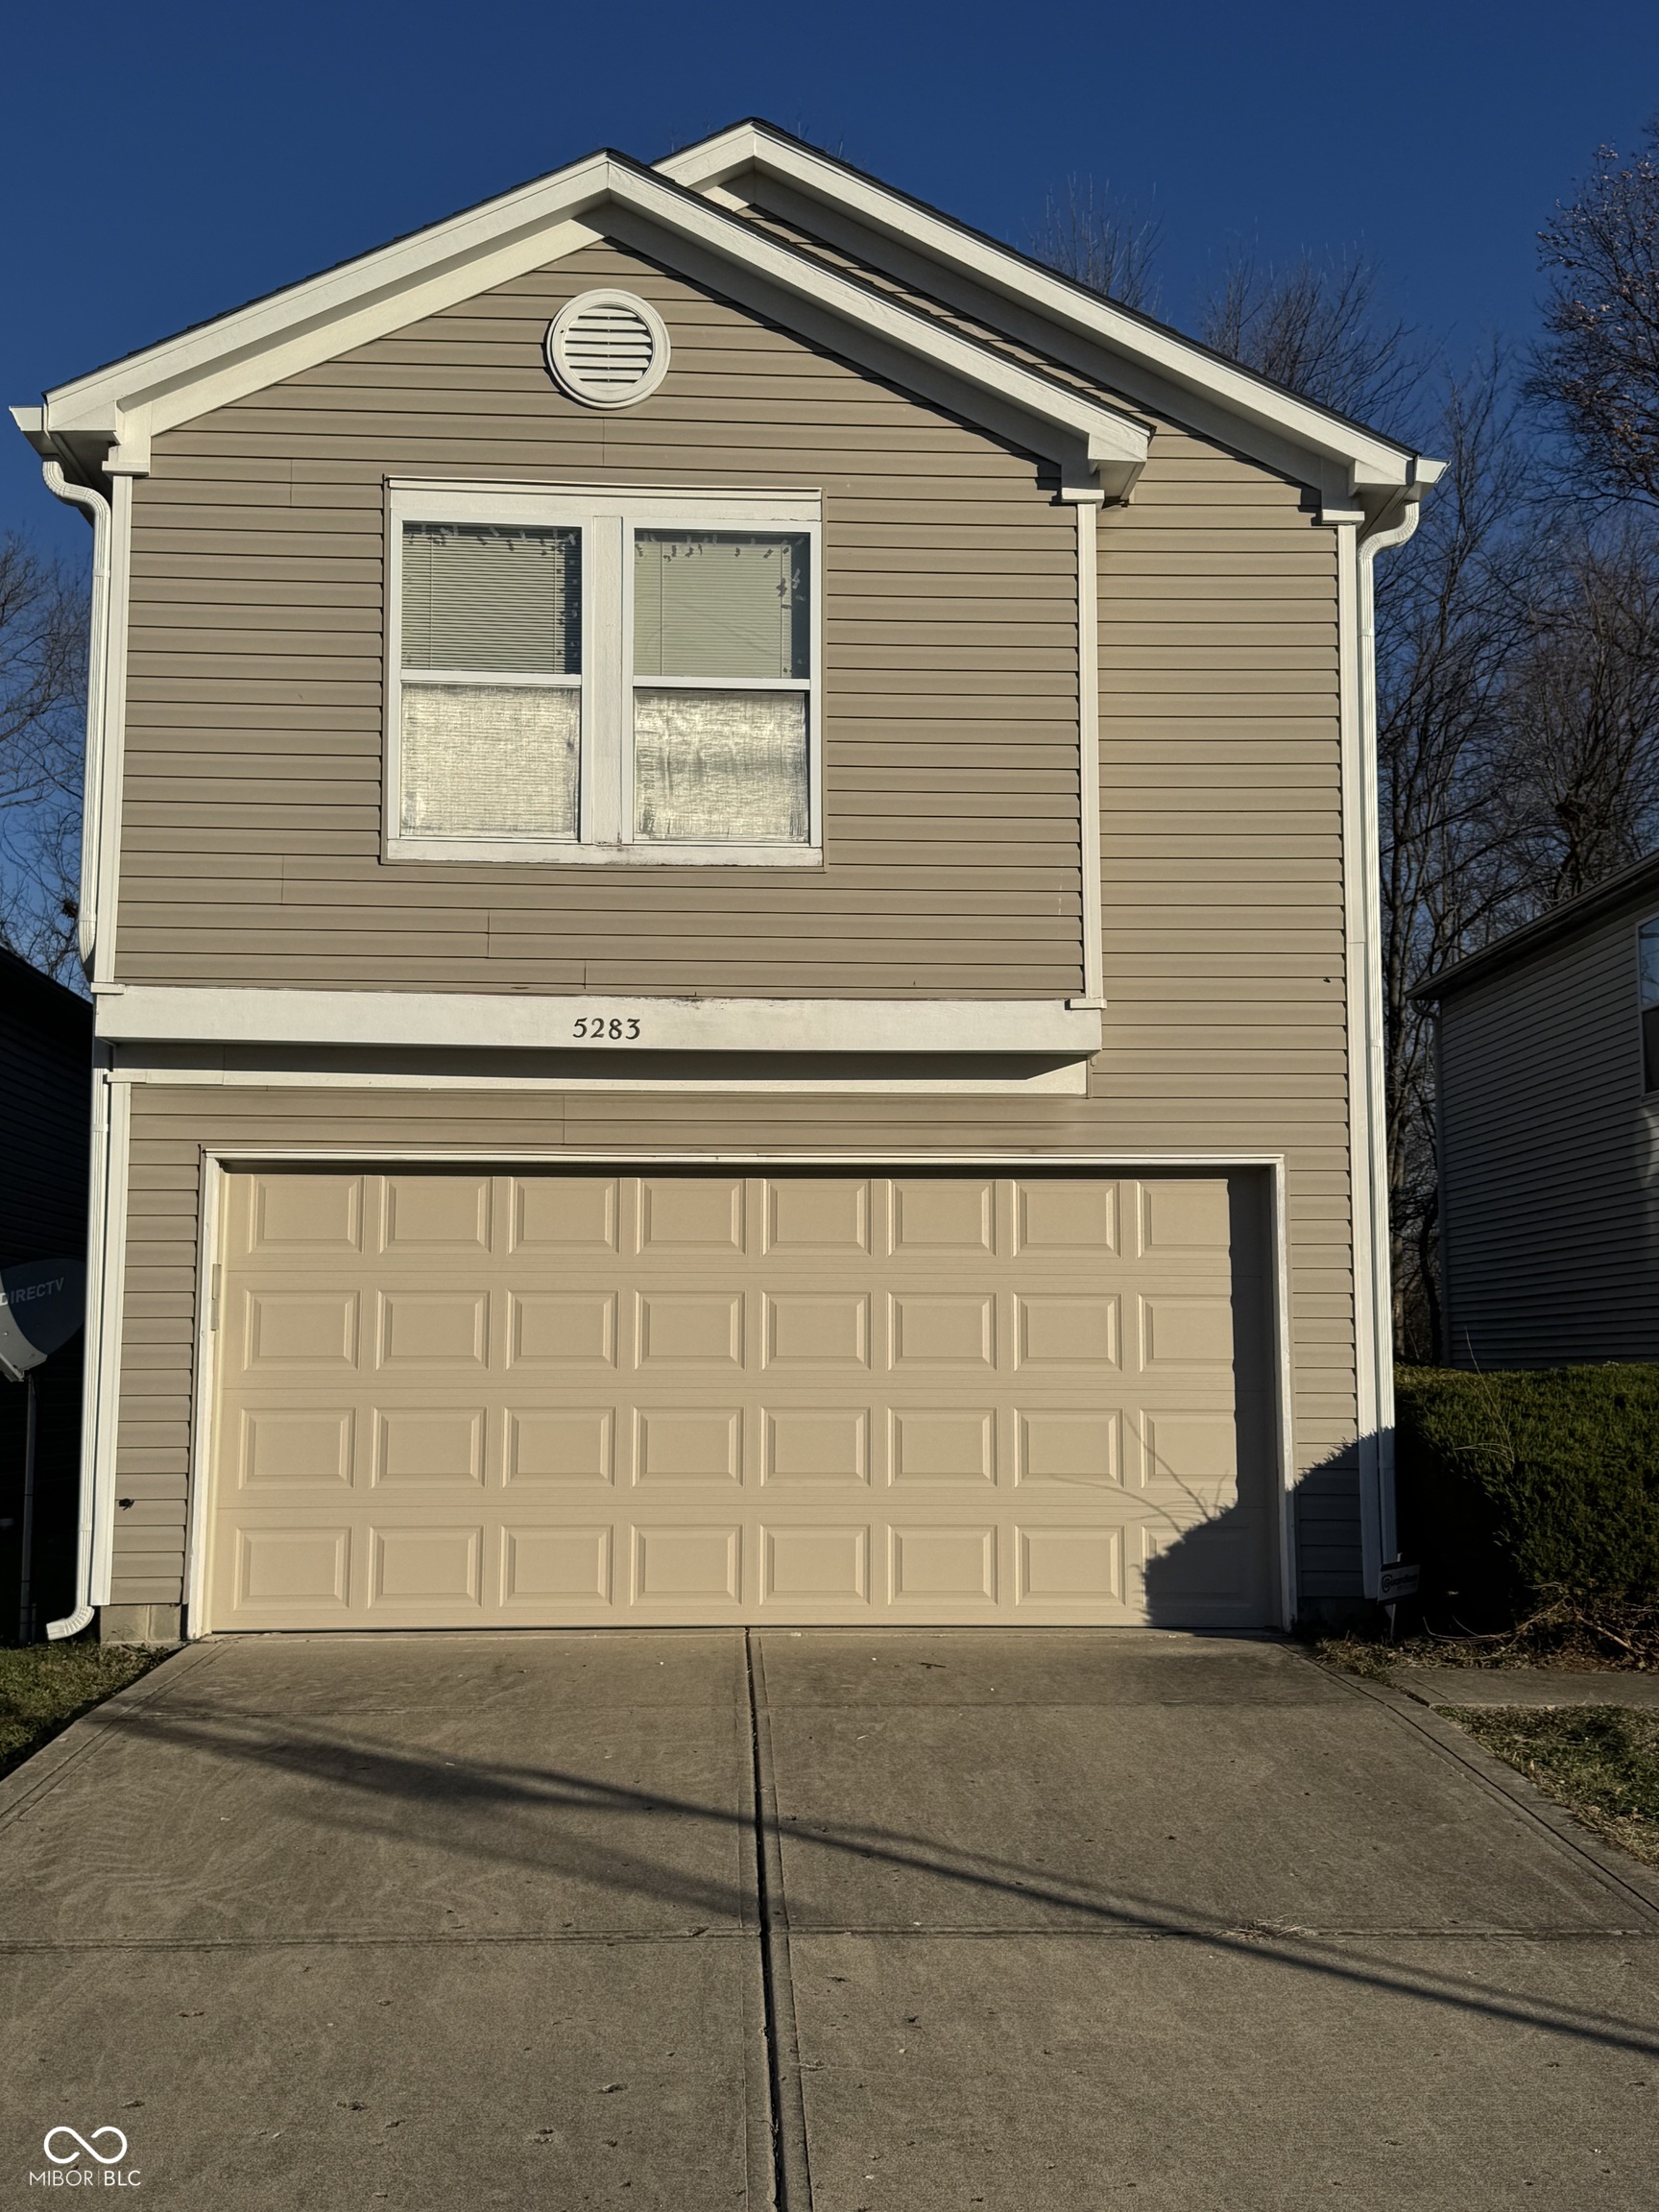
Active
$235,000
3
bds
|
4
ba
|
1,727
sqft
|
built
1998
5283 Tufton Dr, Indianapolis, IN 46254
$11
Cash flow
0.2%
Cash-on-Cash Return
6.3%
Cap rate
0.8%
Rent to Value Ratio
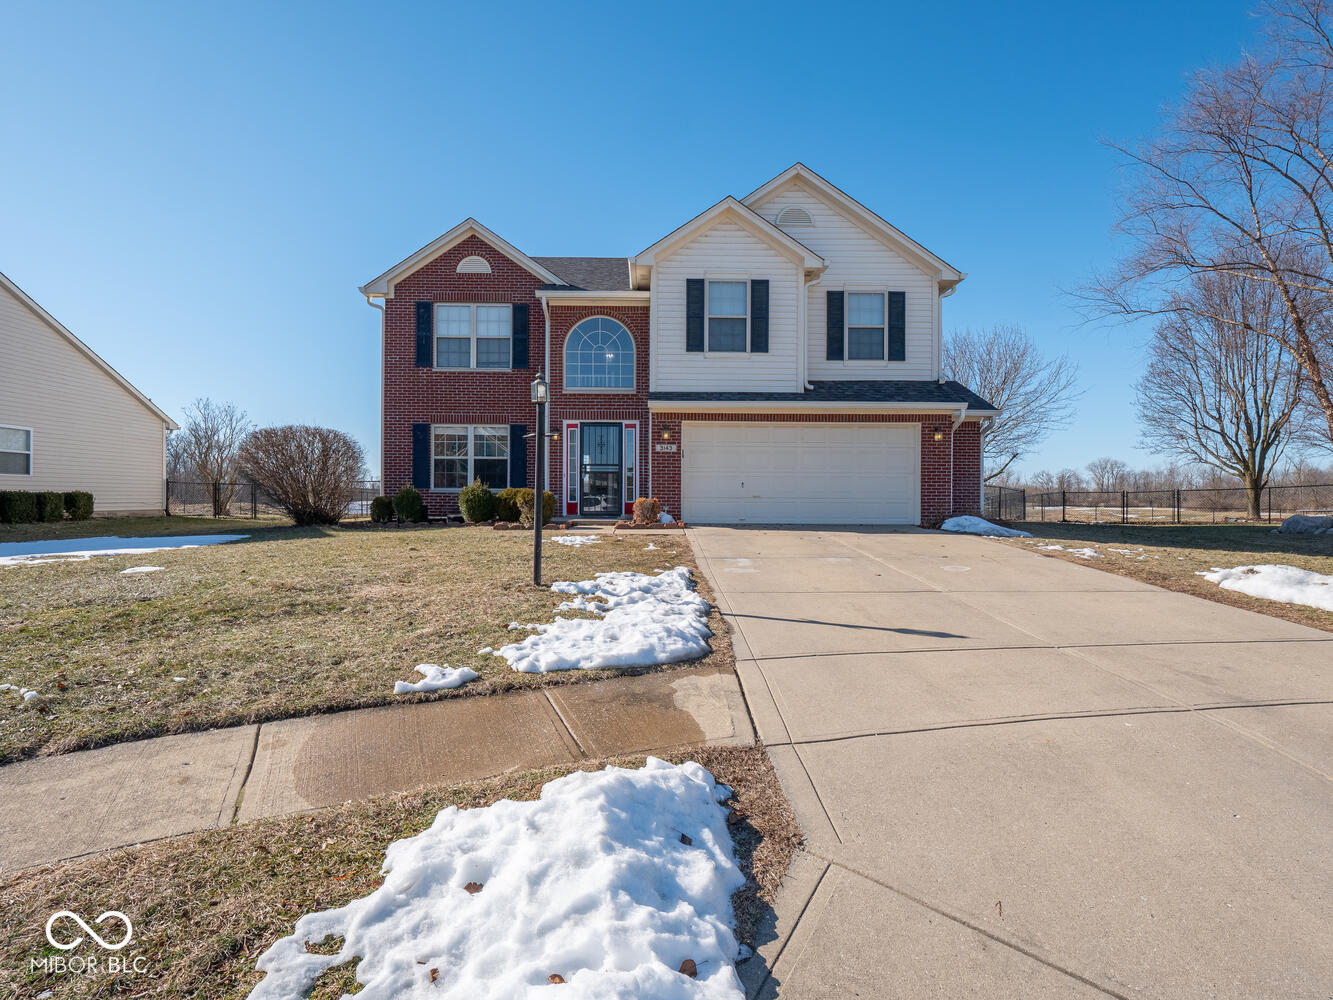
Active
$334,990
4
bds
|
3
ba
|
2,178
sqft
|
built
2000
3143 Shadow Lake Dr, Indianapolis, IN 46217
$-407
Cash flow
-6.3%
Cash-on-Cash Return
4.8%
Cap rate
0.6%
Rent to Value Ratio
Active
$699,000
5
bds
|
3
ba
|
3,218
sqft
|
built
1913
140 E 44th St, Indianapolis, IN 46205
$-1,866
Cash flow
-13.9%
Cash-on-Cash Return
3.1%
Cap rate
0.4%
Rent to Value Ratio
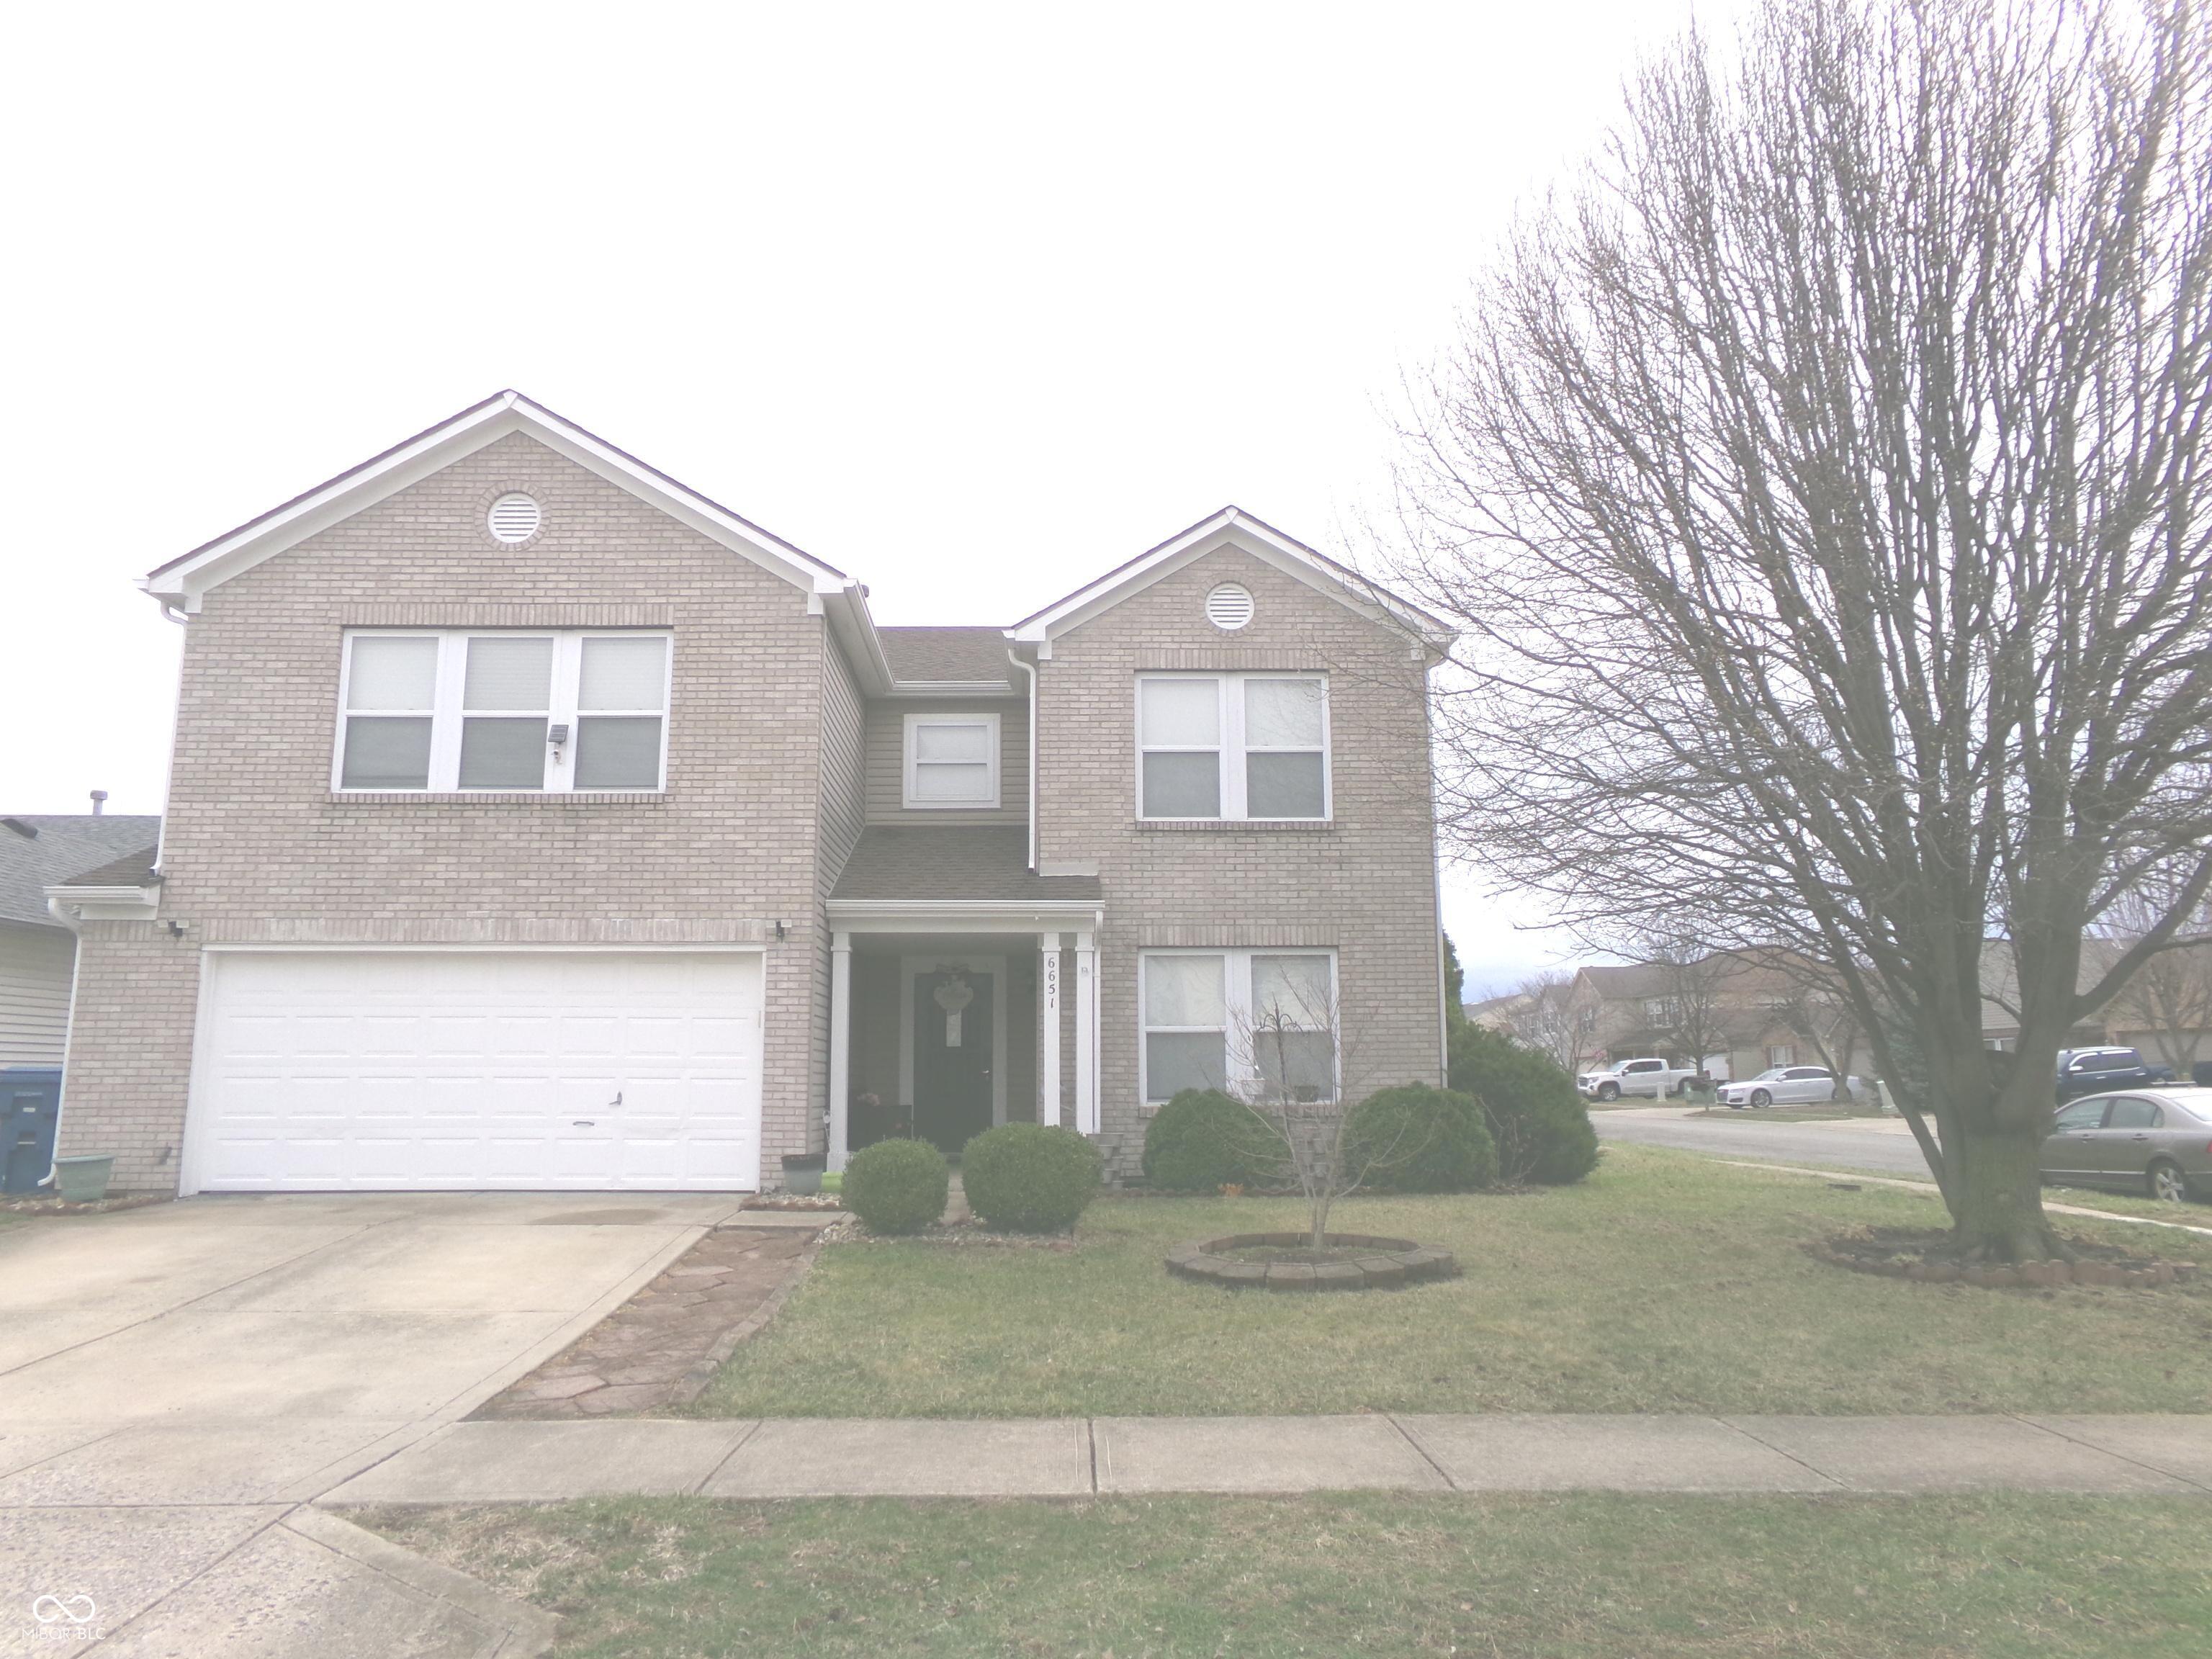
Active
$380,000
5
bds
|
3
ba
|
3,361
sqft
|
built
2000
6651 Sonesta Dr, Indianapolis, IN 46217
$-493
Cash flow
-6.8%
Cash-on-Cash Return
4.7%
Cap rate
0.6%
Rent to Value Ratio
Active
$355,000
4
bds
|
3
ba
|
1,848
sqft
|
built
1992
7383 Poppyseed Dr, Indianapolis, IN 46237
$-513
Cash flow
-7.5%
Cash-on-Cash Return
4.5%
Cap rate
0.6%
Rent to Value Ratio
Active
$165,000
3
bds
|
2
ba
|
1,409
sqft
|
built
1920
3608 N Kenwood Ave, Indianapolis, IN 46208
$309
Cash flow
9.8%
Cash-on-Cash Return
8.5%
Cap rate
1.0%
Rent to Value Ratio
Pending
$158,000
2
bds
|
2
ba
|
1,128
sqft
|
built
1915
601 Wallace Ave, Indianapolis, IN 46201
$139
Cash flow
4.6%
Cash-on-Cash Return
7.3%
Cap rate
0.9%
Rent to Value Ratio