Indianapolis, IN Investment Properties for Sale
Browse homes for sale and investment properties in Indianapolis, IN. Refine your search by price, property type, or more.
Best cash flowing properties in Indianapolis, IN

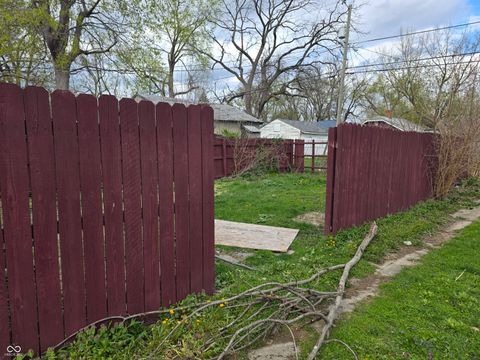
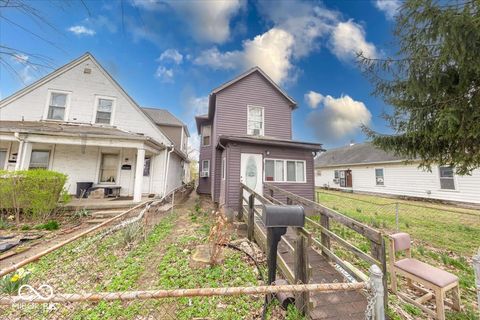
Closed
$125,000
2
bds
|
1
ba
|
952
sqft
|
built
1941
1507 N Luett Ave, Indianapolis, IN 46222
$395
Cash flow
16.5%
Cash-on-Cash Return
9.9%
Cap rate
1.2%
Rent to Value Ratio
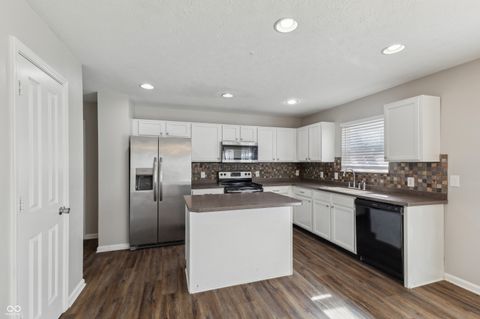
Active
$85,000
2
bds
|
1
ba
|
756
sqft
|
built
1923
335 S Dearborn St, Indianapolis, IN 46201
$324
Cash flow
19.9%
Cash-on-Cash Return
10.7%
Cap rate
1.3%
Rent to Value Ratio
1,947 out of 2,087 properties for sale in Indianapolis, IN
Limited Results Shown
Create a free account, or log in to reveal all property listings and enjoy the complete experience.
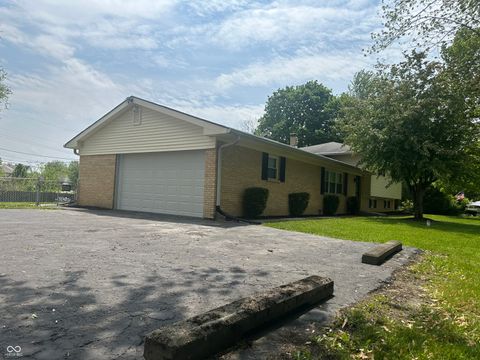
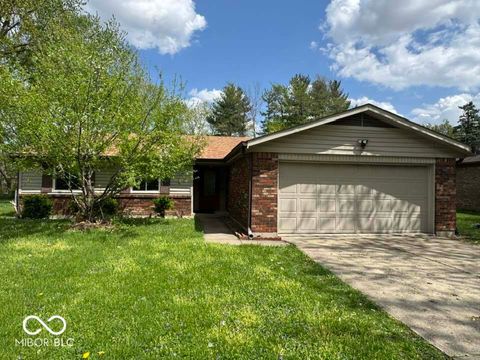
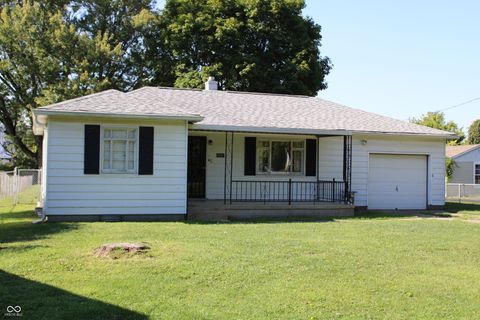
Active
$283,000
3
bds
|
3
ba
|
1,976
sqft
|
built
1964
8417 S Sherman Dr, Indianapolis, IN 46237
$-415
Cash flow
-7.7%
Cash-on-Cash Return
4.4%
Cap rate
0.5%
Rent to Value Ratio

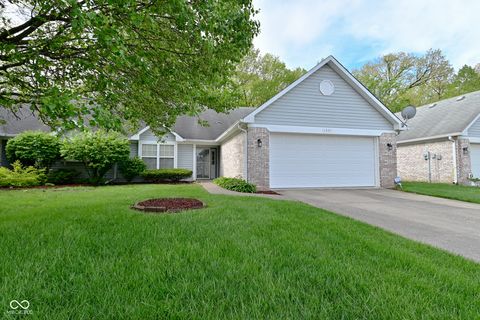
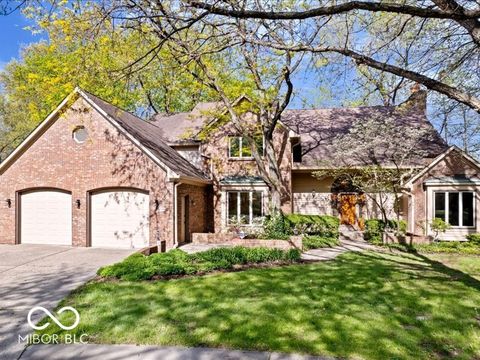
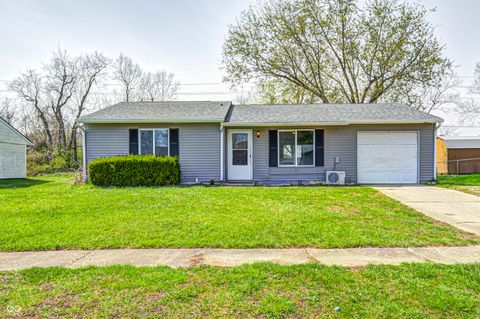
Active
$657,000
5
bds
|
4
ba
|
5,118
sqft
|
built
1994
4601 Fairhope Dr, Indianapolis, IN 46237
$-894
Cash flow
-7.1%
Cash-on-Cash Return
4.5%
Cap rate
0.5%
Rent to Value Ratio
Closed
$125,000
2
bds
|
1
ba
|
952
sqft
|
built
1941
1507 N Luett Ave, Indianapolis, IN 46222
$395
Cash flow
16.5%
Cash-on-Cash Return
9.9%
Cap rate
1.2%
Rent to Value Ratio

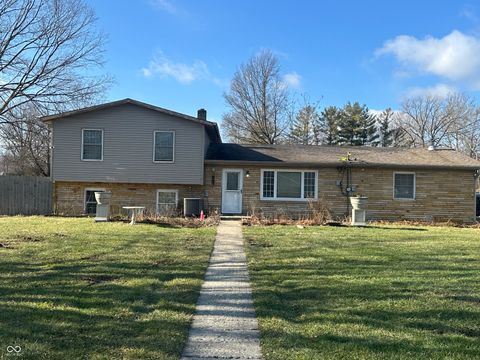
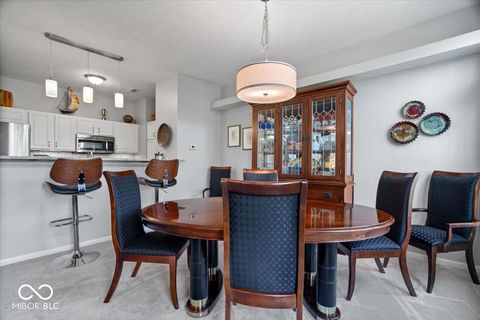
Active
$549,900
5
bds
|
3
ba
|
2,544
sqft
|
built
1923
4447 N College Ave, Indianapolis, IN 46205
$-816
Cash flow
-7.7%
Cash-on-Cash Return
4.4%
Cap rate
0.5%
Rent to Value Ratio

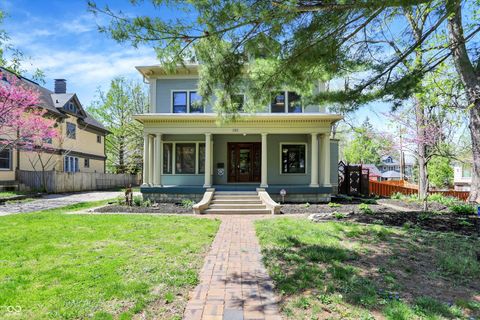
Active
$325,000
2
bds
|
2
ba
|
1,176
sqft
|
built
2017
829 Olive St, Indianapolis, IN 46203
$-423
Cash flow
-6.8%
Cash-on-Cash Return
4.6%
Cap rate
0.6%
Rent to Value Ratio
Active
$205,000
2
bds
|
2
ba
|
1,504
sqft
|
built
1996
11541 Coastal Dr, Indianapolis, IN 46229
$-79
Cash flow
-2.0%
Cash-on-Cash Return
5.7%
Cap rate
0.8%
Rent to Value Ratio

Pending
$324,900
3
bds
|
2
ba
|
1,728
sqft
|
built
1921
5603 S Randolph St, Indianapolis, IN 46227
$-560
Cash flow
-9.0%
Cash-on-Cash Return
4.1%
Cap rate
0.5%
Rent to Value Ratio

Active
$162,500
2
bds
|
2
ba
|
1,080
sqft
|
built
1978
5713 Bradston Way, Indianapolis, IN 46237
$-139
Cash flow
-4.5%
Cash-on-Cash Return
5.1%
Cap rate
0.9%
Rent to Value Ratio

Active
$345,000
4
bds
|
2
ba
|
2,000
sqft
|
built
1910
1641 English Ave, Indianapolis, IN 46201
$-801
Cash flow
-12.1%
Cash-on-Cash Return
3.4%
Cap rate
0.4%
Rent to Value Ratio

Active
$238,999
3
bds
|
2
ba
|
1,250
sqft
|
built
1958
2350 Brewer Dr, Indianapolis, IN 46227
$-120
Cash flow
-2.6%
Cash-on-Cash Return
5.5%
Cap rate
0.7%
Rent to Value Ratio

Pending
$260,000
3
bds
|
2
ba
|
1,596
sqft
|
built
1972
645 Boulder Rd, Indianapolis, IN 46217
$-255
Cash flow
-5.1%
Cash-on-Cash Return
5.0%
Cap rate
0.6%
Rent to Value Ratio

Active
$279,000
4
bds
|
4
ba
|
1,680
sqft
|
built
1914
2216 Bethel Ave, Indianapolis, IN 46203
$-394
Cash flow
-7.4%
Cash-on-Cash Return
4.5%
Cap rate
0.5%
Rent to Value Ratio
Active
$325,000
4
bds
|
2
ba
|
2,258
sqft
|
built
1962
406 S Fenton Ave, Indianapolis, IN 46219
$-768
Cash flow
-12.3%
Cash-on-Cash Return
3.3%
Cap rate
0.4%
Rent to Value Ratio
Active
$255,000
3
bds
|
2
ba
|
1,380
sqft
|
built
1980
7833 Broadview Dr, Indianapolis, IN 46227
$-202
Cash flow
-4.1%
Cash-on-Cash Return
5.2%
Cap rate
0.6%
Rent to Value Ratio
Active
$499,000
4
bds
|
3
ba
|
3,873
sqft
|
built
1988
6744 Robin Hood Ct, Indianapolis, IN 46227
$-398
Cash flow
-4.2%
Cash-on-Cash Return
5.2%
Cap rate
0.6%
Rent to Value Ratio

Active
$319,000
3
bds
|
2
ba
|
1,420
sqft
|
built
1992
4411 Rotterdam Dr, Indianapolis, IN 46228
$-263
Cash flow
-4.3%
Cash-on-Cash Return
5.2%
Cap rate
0.6%
Rent to Value Ratio
Active
$351,000
2
bds
|
3
ba
|
1,816
sqft
|
built
1996
11264 Fonthill Dr, Indianapolis, IN 46236
$-643
Cash flow
-9.6%
Cash-on-Cash Return
3.9%
Cap rate
0.7%
Rent to Value Ratio
Active
$750,000
4
bds
|
4
ba
|
4,393
sqft
|
built
1875
828 Woodruff Place Middle Dr, Indianapolis, IN 46201
$-1,082
Cash flow
-7.5%
Cash-on-Cash Return
4.4%
Cap rate
0.5%
Rent to Value Ratio
Pending
$389,900
5
bds
|
3
ba
|
3,522
sqft
|
built
2003
5924 Skyward Ln, Indianapolis, IN 46234
$-310
Cash flow
-4.1%
Cash-on-Cash Return
5.2%
Cap rate
0.6%
Rent to Value Ratio

Active
$689,975
5
bds
|
4
ba
|
3,932
sqft
|
built
1991
138 Fairway Dr, Indianapolis, IN 46260
$-1,119
Cash flow
-8.5%
Cash-on-Cash Return
4.2%
Cap rate
0.5%
Rent to Value Ratio
Closed
$265,000
4
bds
|
2
ba
|
1,888
sqft
|
built
2005
11631 Tucker Ct, Indianapolis, IN 46229
$23
Cash flow
0.5%
Cash-on-Cash Return
6.2%
Cap rate
0.8%
Rent to Value Ratio
Active
$85,000
2
bds
|
1
ba
|
756
sqft
|
built
1923
335 S Dearborn St, Indianapolis, IN 46201
$324
Cash flow
19.9%
Cash-on-Cash Return
10.7%
Cap rate
1.3%
Rent to Value Ratio
Pending
$359,000
4
bds
|
3
ba
|
2,337
sqft
|
built
2017
4622 Crosby Buck Dr, Indianapolis, IN 46237
$-285
Cash flow
-4.1%
Cash-on-Cash Return
5.2%
Cap rate
0.6%
Rent to Value Ratio

Active
$194,000
2
bds
|
2
ba
|
1,234
sqft
|
built
1985
9449 Maple Way, Indianapolis, IN 46268
$-60
Cash flow
-1.6%
Cash-on-Cash Return
5.8%
Cap rate
0.9%
Rent to Value Ratio
Active
$179,900
3
bds
|
1
ba
|
1,104
sqft
|
built
1941
4818 E 14th St, Indianapolis, IN 46201
$251
Cash flow
7.3%
Cash-on-Cash Return
7.8%
Cap rate
0.9%
Rent to Value Ratio
Pending
$167,000
3
bds
|
1
ba
|
884
sqft
|
built
1980
4506 Phoenix Dr, Indianapolis, IN 46241
$42
Cash flow
1.3%
Cash-on-Cash Return
6.4%
Cap rate
0.8%
Rent to Value Ratio
Active
$184,900
3
bds
|
1
ba
|
900
sqft
|
built
1957
5368 Southeastern Ave, Indianapolis, IN 46203
$157
Cash flow
4.4%
Cash-on-Cash Return
7.2%
Cap rate
0.9%
Rent to Value Ratio
Active
$399,900
5
bds
|
3
ba
|
2,597
sqft
|
built
2003
7233 Capel Dr, Indianapolis, IN 46259
$-356
Cash flow
-4.6%
Cash-on-Cash Return
5.1%
Cap rate
0.6%
Rent to Value Ratio
Active
$724,900
5
bds
|
4
ba
|
5,954
sqft
|
built
2001
7259 Josiah Ct, Indianapolis, IN 46259
$-760
Cash flow
-5.5%
Cash-on-Cash Return
4.9%
Cap rate
0.6%
Rent to Value Ratio
Active
$115,000
3
bds
|
1
ba
|
1,114
sqft
|
built
1910
215 S Warman Ave, Indianapolis, IN 46222
$170
Cash flow
7.7%
Cash-on-Cash Return
7.9%
Cap rate
1.0%
Rent to Value Ratio

Active
$259,000
3
bds
|
1
ba
|
1,312
sqft
|
built
1905
430 Parkway Ave, Indianapolis, IN 46225
$-16
Cash flow
-0.3%
Cash-on-Cash Return
6.1%
Cap rate
0.7%
Rent to Value Ratio
Active
$410,000
5
bds
|
3
ba
|
3,083
sqft
|
built
2009
4747 Summit Lake Pl, Indianapolis, IN 46239
$-168
Cash flow
-2.1%
Cash-on-Cash Return
5.7%
Cap rate
0.7%
Rent to Value Ratio
Active
$224,900
2
bds
|
1
ba
|
936
sqft
|
built
1957
10327 Old National Rd, Indianapolis, IN 46231
$-186
Cash flow
-4.3%
Cash-on-Cash Return
5.2%
Cap rate
0.6%
Rent to Value Ratio
Pending
$219,900
3
bds
|
2
ba
|
1,632
sqft
|
built
1980
6124 Dry Den Ct, Indianapolis, IN 46221
$-229
Cash flow
-5.4%
Cash-on-Cash Return
4.9%
Cap rate
0.6%
Rent to Value Ratio
Active
$479,000
0
bds
|
0
ba
|
0
sqft
|
built
1910
961 Woodruff Place West Dr, Indianapolis, IN 46201
$-1,350
Cash flow
-14.7%
Cash-on-Cash Return
2.8%
Cap rate
0.3%
Rent to Value Ratio

Active
$549,900
3
bds
|
3
ba
|
3,949
sqft
|
built
1967
3244 Devereaux Dr, Indianapolis, IN 46228
$-885
Cash flow
-8.4%
Cash-on-Cash Return
4.2%
Cap rate
0.5%
Rent to Value Ratio
Active
$285,000
2
bds
|
2
ba
|
1,016
sqft
|
built
1920
1727 N New Jersey St, Indianapolis, IN 46202
$-52
Cash flow
-1.0%
Cash-on-Cash Return
5.9%
Cap rate
0.8%
Rent to Value Ratio
Active
$339,000
4
bds
|
3
ba
|
2,352
sqft
|
built
1935
3601 Carrollton Ave, Indianapolis, IN 46205
$-12
Cash flow
-0.2%
Cash-on-Cash Return
6.1%
Cap rate
0.7%
Rent to Value Ratio
Active
$327,900
2
bds
|
2
ba
|
1,465
sqft
|
built
2001
110 E Washington Street, Indianapolis, IN 46204
n/a
Cash flow
n/a
Cash-on-Cash Return
n/a
Cap rate
n/a
Rent to Value Ratio
Active
$230,000
3
bds
|
2
ba
|
1,426
sqft
|
built
1973
731 W Stop 11 Rd, Indianapolis, IN 46217
$-74
Cash flow
-1.7%
Cash-on-Cash Return
5.8%
Cap rate
0.7%
Rent to Value Ratio