Indianapolis, IN Investment Properties for Sale
Browse homes for sale and investment properties in Indianapolis, IN. Refine your search by price, property type, or more.
Best cash flowing properties in Indianapolis, IN

Active
$100,000
2
bds
|
1
ba
|
1,160
sqft
|
built
1950
1102 S Dequincy St, Indianapolis, IN 46203
$444
Cash flow
23.2%
Cash-on-Cash Return
11.6%
Cap rate
1.4%
Rent to Value Ratio

Active
$114,900
4
bds
|
2
ba
|
1,748
sqft
|
built
1924
364 S Cole St, Indianapolis, IN 46241
$366
Cash flow
16.6%
Cash-on-Cash Return
10.1%
Cap rate
1.2%
Rent to Value Ratio
1,717 out of 2,339 properties for sale in Indianapolis, IN
Limited Results Shown
Create a free account, or log in to reveal all property listings and enjoy the complete experience.

Active
$417,500
3
bds
|
3
ba
|
1,844
sqft
|
built
1914
4040 Carrollton Ave, Indianapolis, IN 46205
$28
Cash flow
0.3%
Cash-on-Cash Return
6.3%
Cap rate
0.8%
Rent to Value Ratio

Active
$239,900
3
bds
|
2
ba
|
1,032
sqft
|
built
1957
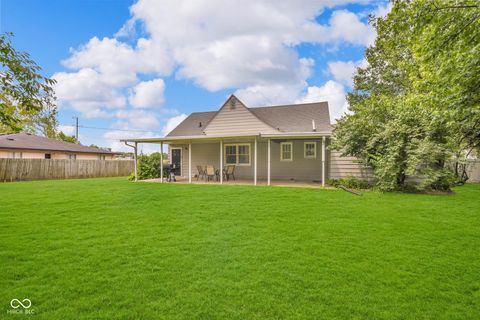
7088 Sandalwood Dr, Indianapolis, IN 46217
$-217
Cash flow
-4.7%
Cash-on-Cash Return
5.2%
Cap rate
0.6%
Rent to Value Ratio
Active
$200,000
4
bds
|
2
ba
|
1,271
sqft
|
built
1943
1141 N Shadeland Ave, Indianapolis, IN 46219
$-285
Cash flow
-7.4%
Cash-on-Cash Return
4.6%
Cap rate
0.5%
Rent to Value Ratio

Active
$389,995
5
bds
|
4
ba
|
3,220
sqft
|
built
2020
10358 Pronghorn Ln, Indianapolis, IN 46239
$-350
Cash flow
-4.7%
Cash-on-Cash Return
5.2%
Cap rate
0.6%
Rent to Value Ratio

Active
$299,000
3
bds
|
3
ba
|
2,172
sqft
|
built
2002
11138 Bear Hollow Dr, Indianapolis, IN 46229
$-65
Cash flow
-1.1%
Cash-on-Cash Return
6.0%
Cap rate
0.7%
Rent to Value Ratio
Active
$185,000
0
bds
|
0
ba
|
0
sqft
|
built
1917
2913 Boulevard Pl, Indianapolis, IN 46208
$-138
Cash flow
-3.9%
Cash-on-Cash Return
5.4%
Cap rate
0.6%
Rent to Value Ratio

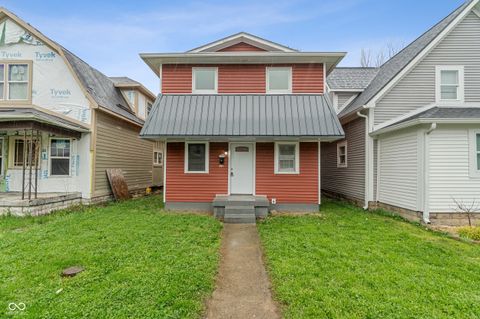
Active
$105,900
3
bds
|
1
ba
|
1,170
sqft
|
built
1920
2349 Indianapolis Ave, Indianapolis, IN 46208
$344
Cash flow
16.9%
Cash-on-Cash Return
10.2%
Cap rate
1.2%
Rent to Value Ratio

Active
$234,900
4
bds
|
2
ba
|
1,066
sqft
|
built
1911
424 S Parker Ave, Indianapolis, IN 46201
$-467
Cash flow
-10.4%
Cash-on-Cash Return
3.9%
Cap rate
0.5%
Rent to Value Ratio

Active
$315,000
4
bds
|
2
ba
|
1,984
sqft
|
built
1954
2314 E 58th St, Indianapolis, IN 46220
$-403
Cash flow
-6.7%
Cash-on-Cash Return
4.7%
Cap rate
0.6%
Rent to Value Ratio

Active
$275,000
3
bds
|
2
ba
|
1,130
sqft
|
built
1930
337 E Minnesota St, Indianapolis, IN 46225
$-263
Cash flow
-5.0%
Cash-on-Cash Return
5.1%
Cap rate
0.6%
Rent to Value Ratio
Active
$210,000
3
bds
|
2
ba
|
1,200
sqft
|
built
1972
2935 Highland Pl, Indianapolis, IN 46208
$-199
Cash flow
-4.9%
Cash-on-Cash Return
5.1%
Cap rate
0.6%
Rent to Value Ratio

Active
$142,000
3
bds
|
1
ba
|
920
sqft
|
built
1951
3521 N Riley Ave, Indianapolis, IN 46218
$156
Cash flow
5.7%
Cash-on-Cash Return
7.6%
Cap rate
0.9%
Rent to Value Ratio

Active
$685,000
5
bds
|
5
ba
|
5,851
sqft
|
built
1989
2308 Galahad Dr, Indianapolis, IN 46228
$-747
Cash flow
-5.7%
Cash-on-Cash Return
5.0%
Cap rate
0.6%
Rent to Value Ratio
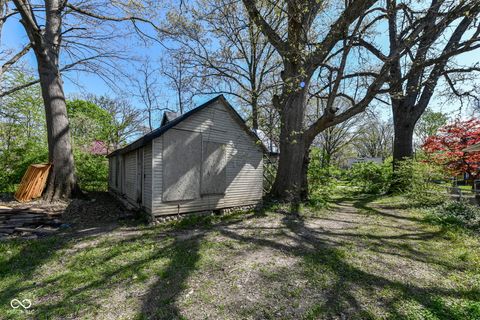
Active
$125,000
2
bds
|
0
ba
|
872
sqft
|
built
1870
324 Burgess Ave, Indianapolis, IN 46219
$313
Cash flow
13.1%
Cash-on-Cash Return
9.3%
Cap rate
1.1%
Rent to Value Ratio

Active
$404,900
4
bds
|
3
ba
|
2,828
sqft
|
built
2009
7140 Lakeland Trails Blvd, Indianapolis, IN 46259
$-145
Cash flow
-1.9%
Cash-on-Cash Return
5.8%
Cap rate
0.7%
Rent to Value Ratio

Active
$249,999
3
bds
|
2
ba
|
1,222
sqft
|
built
1989
8810 Summer Walk Dr E, Indianapolis, IN 46227
$-408
Cash flow
-8.5%
Cash-on-Cash Return
4.3%
Cap rate
0.5%
Rent to Value Ratio

Active
$309,900
3
bds
|
4
ba
|
1,960
sqft
|
built
1930
213 S State Ave, Indianapolis, IN 46201
$-859
Cash flow
-14.5%
Cash-on-Cash Return
2.9%
Cap rate
0.4%
Rent to Value Ratio

Active
$600,000
4
bds
|
2
ba
|
1,600
sqft
|
built
1925
507 W 29th St, Indianapolis, IN 46208
$-2,373
Cash flow
-20.6%
Cash-on-Cash Return
1.5%
Cap rate
0.2%
Rent to Value Ratio
Active
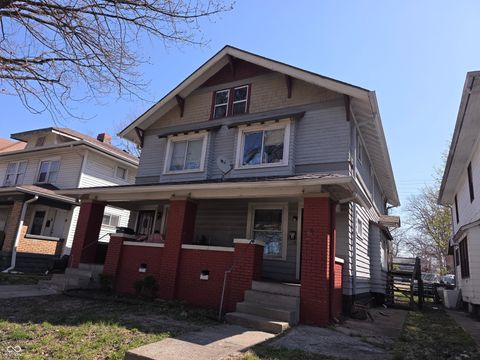
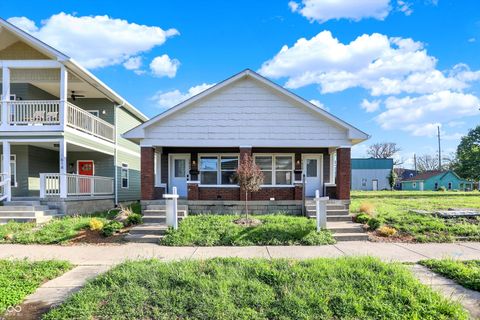
$114,900
4
bds
|
2
ba
|
1,748
sqft
|
built
1924
364 S Cole St, Indianapolis, IN 46241
$366
Cash flow
16.6%
Cash-on-Cash Return
10.1%
Cap rate
1.2%
Rent to Value Ratio

Active
$295,000
3
bds
|
2
ba
|
1,600
sqft
|
built
2010
10522 Hunters Crossing Blvd, Indianapolis, IN 46239
$-199
Cash flow
-3.5%
Cash-on-Cash Return
5.5%
Cap rate
0.7%
Rent to Value Ratio

Active
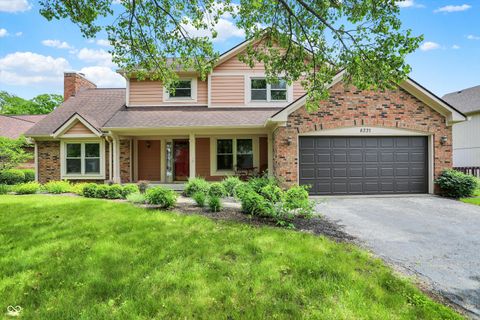
$339,990
3
bds
|
3
ba
|
3,218
sqft
|
built
2003
9873 Blue Ridge Way, Indianapolis, IN 46234
$-295
Cash flow
-4.5%
Cash-on-Cash Return
5.2%
Cap rate
0.6%
Rent to Value Ratio

Active
$250,000
3
bds
|
3
ba
|
1,800
sqft
|
built
2007
9704 Gull Lake Dr, Indianapolis, IN 46239
$75
Cash flow
1.6%
Cash-on-Cash Return
6.6%
Cap rate
0.8%
Rent to Value Ratio

Active
$215,000
2
bds
|
1
ba
|
1,000
sqft
|
built
1920
2035 S Pennsylvania St, Indianapolis, IN 46225
$-156
Cash flow
-3.8%
Cash-on-Cash Return
5.4%
Cap rate
0.7%
Rent to Value Ratio

Active
$239,900
2
bds
|
2
ba
|
1,620
sqft
|
built
1989
8651 Jaffa Court East Dr, Indianapolis, IN 46260
$-312
Cash flow
-6.8%
Cash-on-Cash Return
4.7%
Cap rate
0.9%
Rent to Value Ratio
Active
$216,000
3
bds
|
2
ba
|
1,586
sqft
|
built
1999
3149 Carson Ave, Indianapolis, IN 46227
$-93
Cash flow
-2.2%
Cash-on-Cash Return
5.8%
Cap rate
0.7%
Rent to Value Ratio

Active
$349,900
3
bds
|
2
ba
|
1,690
sqft
|
built
1963
5609 E Southern Ave, Indianapolis, IN 46203
$-309
Cash flow
-4.6%
Cash-on-Cash Return
5.2%
Cap rate
0.6%
Rent to Value Ratio
Active
$369,000
2
bds
|
3
ba
|
1,774
sqft
|
built
1910
1622 Prospect St, Indianapolis, IN 46203
$-753
Cash flow
-10.6%
Cash-on-Cash Return
3.8%
Cap rate
0.5%
Rent to Value Ratio

Active
$465,000
6
bds
|
0
ba
|
0
sqft
|
built
1917
1315 Union St, Indianapolis, IN 46225
$-1,324
Cash flow
-14.9%
Cash-on-Cash Return
2.8%
Cap rate
0.3%
Rent to Value Ratio
Active
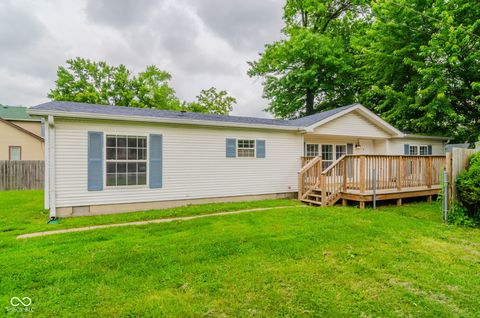
$100,000
2
bds
|
1
ba
|
1,160
sqft
|
built
1950
1102 S Dequincy St, Indianapolis, IN 46203
$444
Cash flow
23.2%
Cash-on-Cash Return
11.6%
Cap rate
1.4%
Rent to Value Ratio

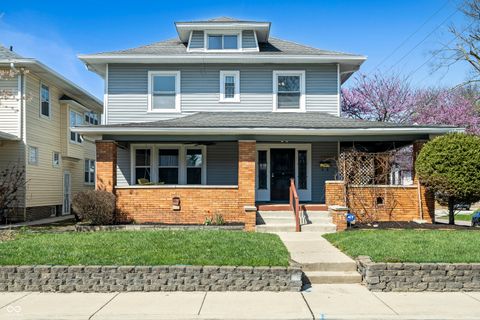
Active
$211,000
3
bds
|
2
ba
|
1,184
sqft
|
built
1926
2026 Spruce St, Indianapolis, IN 46203
$-688
Cash flow
-17.0%
Cash-on-Cash Return
2.4%
Cap rate
0.3%
Rent to Value Ratio

Active
$300,000
3
bds
|
1
ba
|
1,152
sqft
|
built
1994
2612 E Northgate St, Indianapolis, IN 46220
$-186
Cash flow
-3.2%
Cash-on-Cash Return
5.5%
Cap rate
0.7%
Rent to Value Ratio
Active
$358,000
3
bds
|
3
ba
|
2,155
sqft
|
built
1987
8331 Tequista Ct, Indianapolis, IN 46236
$-194
Cash flow
-2.8%
Cash-on-Cash Return
5.6%
Cap rate
0.7%
Rent to Value Ratio
Active
$355,000
5
bds
|
4
ba
|
3,078
sqft
|
built
1925
3970 Broadway St, Indianapolis, IN 46205
$-335
Cash flow
-4.9%
Cash-on-Cash Return
5.1%
Cap rate
0.6%
Rent to Value Ratio

Active
$232,000
3
bds
|
2
ba
|
1,346
sqft
|
built
1964
8137 S Delaware St, Indianapolis, IN 46227
$-107
Cash flow
-2.4%
Cash-on-Cash Return
5.7%
Cap rate
0.7%
Rent to Value Ratio

Active
$209,900
2
bds
|
2
ba
|
1,530
sqft
|
built
1984
9415 Timber View Dr, Indianapolis, IN 46250
$-254
Cash flow
-6.3%
Cash-on-Cash Return
4.8%
Cap rate
0.7%
Rent to Value Ratio

Active
$698,000
3
bds
|
3
ba
|
2,572
sqft
|
built
1985
958 Tamarack Circle North Dr, Indianapolis, IN 46260
$-1,669
Cash flow
-12.5%
Cash-on-Cash Return
3.4%
Cap rate
0.5%
Rent to Value Ratio
Active
$239,000
3
bds
|
2
ba
|
1,926
sqft
|
built
1926
1720 Woodlawn Ave, Indianapolis, IN 46203
$-6
Cash flow
-0.1%
Cash-on-Cash Return
6.2%
Cap rate
0.8%
Rent to Value Ratio

Active
$279,900
4
bds
|
3
ba
|
1,997
sqft
|
built
2006
8249 Retreat Ln, Indianapolis, IN 46259
$-81
Cash flow
-1.5%
Cash-on-Cash Return
5.9%
Cap rate
0.7%
Rent to Value Ratio

Active
$190,000
4
bds
|
2
ba
|
1,269
sqft
|
built
1971
415 W Gimber St, Indianapolis, IN 46225
$-26
Cash flow
-0.7%
Cash-on-Cash Return
6.1%
Cap rate
0.7%
Rent to Value Ratio
Active
$750,000
5
bds
|
4
ba
|
3,060
sqft
|
built
1994
9909 E Mc Gregor Rd, Indianapolis, IN 46259
$-1,432
Cash flow
-10.0%
Cash-on-Cash Return
4.0%
Cap rate
0.5%
Rent to Value Ratio