Jackson, MS Investment Properties for Sale
Browse homes for sale and investment properties in Jackson, MS. Refine your search by price, property type, or more.
Best cash flowing properties in Jackson, MS

Active
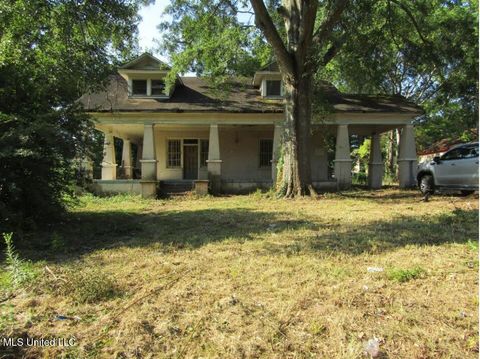
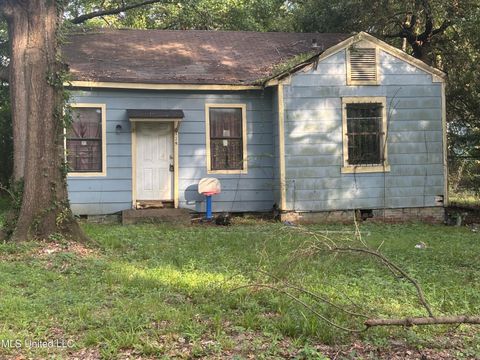
$60,000
3
bds
|
2
ba
|
0
sqft
|
built
1922
122 Glenmary St, Jackson, MS 39203
$926
Cash flow
18.0%
Cash-on-Cash Return
18.5%
Cap rate
2.3%
Rent to Value Ratio
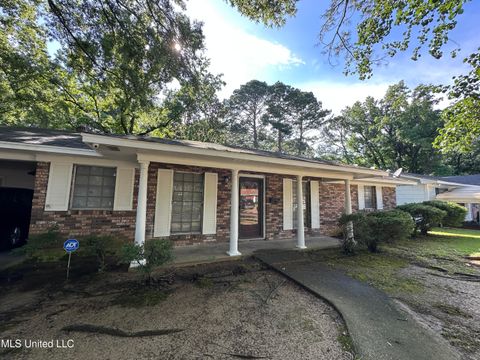
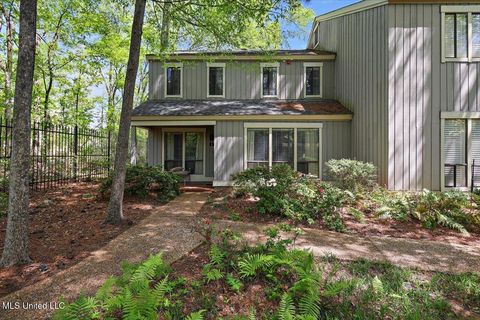
Active
$64,350
4
bds
|
1
ba
|
0
sqft
|
built
1920
1655 Saint Charles St, Jackson, MS 39209
$864
Cash flow
15.6%
Cash-on-Cash Return
16.1%
Cap rate
2.3%
Rent to Value Ratio
415 out of 428 properties for sale in Jackson, MS
Limited Results Shown
Create a free account, or log in to reveal all property listings and enjoy the complete experience.
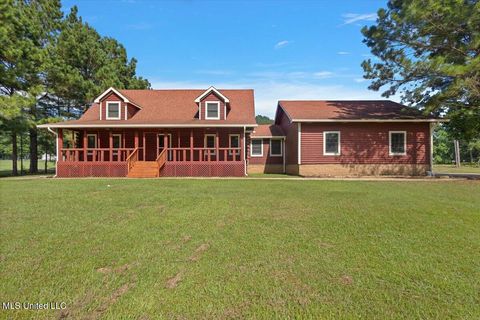
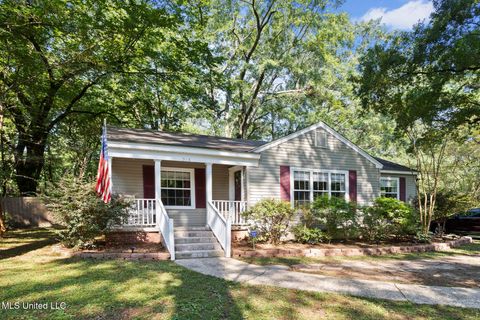
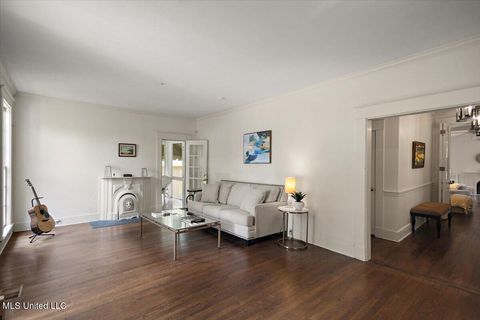
Active
$125,000
3
bds
|
2
ba
|
0
sqft
|
built
1967
5347 Cedar Park Dr, Jackson, MS 39206
$564
Cash flow
23.5%
Cash-on-Cash Return
11.1%
Cap rate
1.4%
Rent to Value Ratio
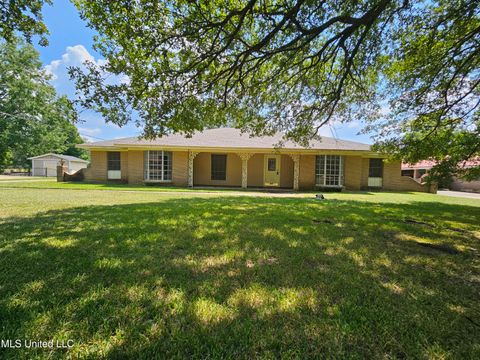
Active
$344,997
4
bds
|
3
ba
|
0
sqft
|
built
2005
126 Parks Rd, Jackson, MS 39212
$-34
Cash flow
-0.5%
Cash-on-Cash Return
5.6%
Cap rate
0.7%
Rent to Value Ratio

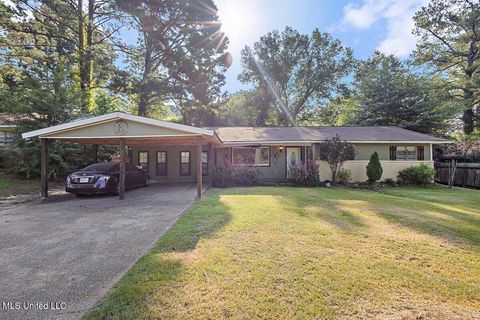
Active
$92,000
3
bds
|
2
ba
|
0
sqft
|
built
1971
4668 Norway Dr, Jackson, MS 39206
$629
Cash flow
35.7%
Cash-on-Cash Return
13.9%
Cap rate
2.0%
Rent to Value Ratio
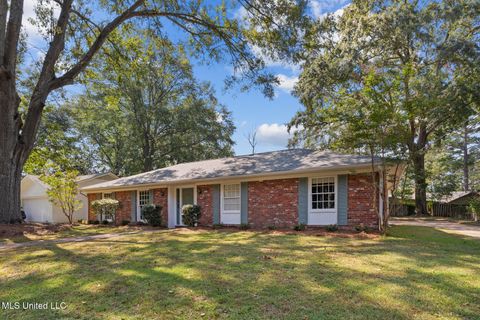
Active
$169,900
3
bds
|
2
ba
|
0
sqft
|
built
1970
329 Swan Lake Dr, Jackson, MS 39212
$-93
Cash flow
-2.9%
Cash-on-Cash Return
5.0%
Cap rate
0.8%
Rent to Value Ratio
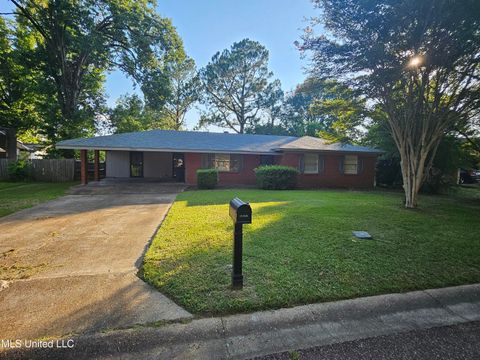
Active
$65,000
3
bds
|
1
ba
|
0
sqft
|
built
1980
1723 Casteel Dr, Jackson, MS 39204
$650
Cash flow
11.7%
Cash-on-Cash Return
12.0%
Cap rate
1.7%
Rent to Value Ratio
Active
$56,000
3
bds
|
2
ba
|
0
sqft
|
built
1973
613 Upper Darby Rd, Jackson, MS 39212
$811
Cash flow
16.9%
Cash-on-Cash Return
17.4%
Cap rate
2.5%
Rent to Value Ratio
Active
$262,500
3
bds
|
2
ba
|
0
sqft
|
built
1960
1432 Belle Glade St, Jackson, MS 39211
$174
Cash flow
3.5%
Cash-on-Cash Return
6.5%
Cap rate
0.9%
Rent to Value Ratio
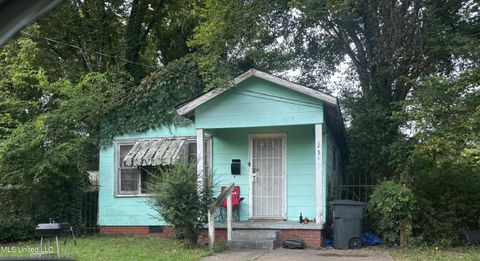
Active
$20,000
4
bds
|
2
ba
|
0
sqft
|
built
1948
3549 Hollywood Ave, Jackson, MS 39213
$703
Cash flow
41.0%
Cash-on-Cash Return
42.2%
Cap rate
5.5%
Rent to Value Ratio

Active
$235,900
3
bds
|
2
ba
|
0
sqft
|
built
1999
4954 Brookwood Pl, Jackson, MS 39272
$311
Cash flow
6.9%
Cash-on-Cash Return
7.3%
Cap rate
1.0%
Rent to Value Ratio
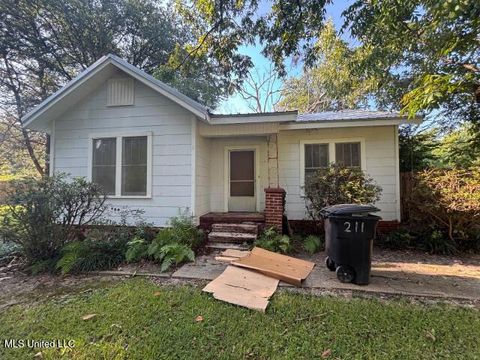
Active
$94,500
3
bds
|
1
ba
|
0
sqft
|
built
1935
211 Stokes Robertson Rd, Jackson, MS 39212
$149
Cash flow
8.2%
Cash-on-Cash Return
7.6%
Cap rate
1.1%
Rent to Value Ratio
Active
$165,000
2
bds
|
2
ba
|
0
sqft
|
built
1941
2905 Oxford Ave, Jackson, MS 39216
$400
Cash flow
12.6%
Cash-on-Cash Return
8.6%
Cap rate
1.1%
Rent to Value Ratio

Active
$27,000
3
bds
|
1
ba
|
0
sqft
|
built
1950
3419 Missouri St, Jackson, MS 39213
$556
Cash flow
24.0%
Cash-on-Cash Return
24.7%
Cap rate
4.4%
Rent to Value Ratio

Active
$139,000
3
bds
|
2
ba
|
0
sqft
|
built
1970
4832 Woodmont Dr, Jackson, MS 39206
$364
Cash flow
13.7%
Cash-on-Cash Return
8.8%
Cap rate
1.2%
Rent to Value Ratio
Active
$195,000
3
bds
|
2
ba
|
0
sqft
|
built
1979
27 Park Crest Pl, Jackson, MS 39211
$-152
Cash flow
-4.1%
Cash-on-Cash Return
4.7%
Cap rate
0.9%
Rent to Value Ratio
Active
$279,500
4
bds
|
2
ba
|
0
sqft
|
built
1969
5328 Hialeah Dr, Jackson, MS 39211
$140
Cash flow
2.6%
Cash-on-Cash Return
6.3%
Cap rate
0.9%
Rent to Value Ratio
Active
$108,000
2
bds
|
1
ba
|
0
sqft
|
built
1959
5201 Andover Dr, Jackson, MS 39209
$37
Cash flow
1.8%
Cash-on-Cash Return
6.1%
Cap rate
0.8%
Rent to Value Ratio
Active
$92,000
4
bds
|
3
ba
|
0
sqft
|
built
1962
1002 Autumn St, Jackson, MS 39212
$509
Cash flow
28.9%
Cash-on-Cash Return
12.3%
Cap rate
1.7%
Rent to Value Ratio
Active
$228,000
3
bds
|
3
ba
|
0
sqft
|
built
1973
5967 Huntview Dr, Jackson, MS 39206
$395
Cash flow
9.0%
Cash-on-Cash Return
7.8%
Cap rate
1.0%
Rent to Value Ratio
Active
$159,900
3
bds
|
2
ba
|
0
sqft
|
built
1940
1822 Howard St, Jackson, MS 39202
$498
Cash flow
16.2%
Cash-on-Cash Return
9.4%
Cap rate
1.3%
Rent to Value Ratio

Active
$189,900
4
bds
|
2
ba
|
0
sqft
|
built
1958
1645 Meadowbrook Rd, Jackson, MS 39211
$229
Cash flow
6.3%
Cash-on-Cash Return
7.1%
Cap rate
1.1%
Rent to Value Ratio
Active
$165,000
3
bds
|
1
ba
|
0
sqft
|
built
1951
316 Colonial Cir, Jackson, MS 39211
$209
Cash flow
6.6%
Cash-on-Cash Return
7.2%
Cap rate
1.0%
Rent to Value Ratio
Active
$160,000
4
bds
|
3
ba
|
0
sqft
|
built
1963
3142 Bienville Dr, Jackson, MS 39212
$259
Cash flow
8.4%
Cash-on-Cash Return
7.6%
Cap rate
1.0%
Rent to Value Ratio

Active
$85,000
3
bds
|
1
ba
|
0
sqft
|
built
1956
134 Wacker Dr, Jackson, MS 39206
$462
Cash flow
28.4%
Cash-on-Cash Return
12.2%
Cap rate
1.6%
Rent to Value Ratio
Active
$265,000
3
bds
|
2
ba
|
0
sqft
|
built
1966
5359 Reddoch Dr, Jackson, MS 39211
$-13
Cash flow
-0.3%
Cash-on-Cash Return
5.6%
Cap rate
0.9%
Rent to Value Ratio
Active
$155,000
4
bds
|
2
ba
|
0
sqft
|
built
1971
3731 John F Kennedy Blvd, Jackson, MS 39213
$501
Cash flow
16.9%
Cash-on-Cash Return
9.6%
Cap rate
1.2%
Rent to Value Ratio

Active
$165,000
4
bds
|
2
ba
|
0
sqft
|
built
1967
5730 Sedgwick Dr, Jackson, MS 39211
$240
Cash flow
7.6%
Cash-on-Cash Return
7.4%
Cap rate
1.1%
Rent to Value Ratio
Active
$35,000
2
bds
|
1
ba
|
0
sqft
|
built
1940
115 Tennessee Ave, Jackson, MS 39209
$512
Cash flow
17.0%
Cash-on-Cash Return
17.6%
Cap rate
2.3%
Rent to Value Ratio
Active
$349,000
3
bds
|
3
ba
|
0
sqft
|
built
1974
1 Eastbrooke St, Jackson, MS 39216
$-1,055
Cash flow
-15.8%
Cash-on-Cash Return
2.1%
Cap rate
0.7%
Rent to Value Ratio
Active
$39,000
2
bds
|
1
ba
|
0
sqft
|
built
1957
235 Taft St, Jackson, MS 39202
$724
Cash flow
21.6%
Cash-on-Cash Return
22.3%
Cap rate
2.8%
Rent to Value Ratio
Active
$320,000
2
bds
|
2
ba
|
0
sqft
|
built
1927
1717 Edgewood St, Jackson, MS 39202
$-68
Cash flow
-1.1%
Cash-on-Cash Return
5.4%
Cap rate
0.8%
Rent to Value Ratio
Active
$25,000
3
bds
|
2
ba
|
0
sqft
|
built
1966
1943 Bienville Dr, Jackson, MS 39212
$755
Cash flow
35.2%
Cash-on-Cash Return
36.2%
Cap rate
5.2%
Rent to Value Ratio
Active
$169,000
3
bds
|
2
ba
|
0
sqft
|
built
1961
5444 Ridgewood Rd, Jackson, MS 39211
$375
Cash flow
11.6%
Cash-on-Cash Return
8.3%
Cap rate
1.2%
Rent to Value Ratio

Active
$381,500
4
bds
|
3
ba
|
0
sqft
|
built
2003
2033 Elizabeth Chapman Dr, Jackson, MS 39212
$92
Cash flow
1.3%
Cash-on-Cash Return
6.0%
Cap rate
0.8%
Rent to Value Ratio
Active
$90,000
3
bds
|
1
ba
|
0
sqft
|
built
1956
1539 Woodburn St, Jackson, MS 39212
$240
Cash flow
13.9%
Cash-on-Cash Return
8.9%
Cap rate
1.2%
Rent to Value Ratio
Active
$513,000
4
bds
|
4
ba
|
0
sqft
|
built
1955
3678 Cavalier Dr, Jackson, MS 39216
$-225
Cash flow
-2.3%
Cash-on-Cash Return
5.2%
Cap rate
0.7%
Rent to Value Ratio
Active
$85,000
3
bds
|
1
ba
|
0
sqft
|
built
1956
4570 Ritchey Dr, Jackson, MS 39209
$429
Cash flow
26.3%
Cash-on-Cash Return
11.7%
Cap rate
1.5%
Rent to Value Ratio

Active
$139,900
2
bds
|
1
ba
|
0
sqft
|
built
1979
21 Park Crest Pl, Jackson, MS 39211
$-153
Cash flow
-5.7%
Cash-on-Cash Return
4.4%
Cap rate
1.0%
Rent to Value Ratio
Active
$157,400
2
bds
|
2
ba
|
0
sqft
|
built
1991
2016 Fox Hill Ln, Jackson, MS 39272
$35
Cash flow
1.2%
Cash-on-Cash Return
5.9%
Cap rate
0.8%
Rent to Value Ratio