East Baton Rouge Parish County Investment Properties for Sale
Browse homes for sale and investment properties in East Baton Rouge Parish County. Refine your search by price, property type, or more.
Best cash flowing properties in East Baton Rouge Parish County

Active
$50,000
3
bds
|
2
ba
|
1,112
sqft
|
built
1971
4936 Cadillac St, Baton Rouge, LA 70811
$897
Cash flow
20.9%
Cash-on-Cash Return
21.5%
Cap rate
2.6%
Rent to Value Ratio

Active
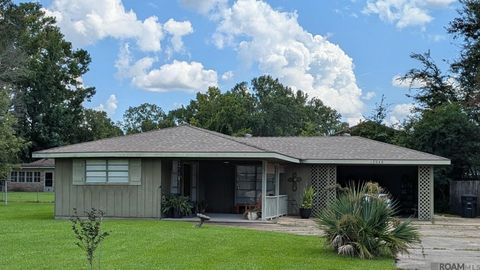
$70,000
3
bds
|
2
ba
|
1,675
sqft
|
built
1950
2855 Madison Ave, Baton Rouge, LA 70802
$828
Cash flow
13.8%
Cash-on-Cash Return
14.2%
Cap rate
1.7%
Rent to Value Ratio
851 out of 858 properties for sale in East Baton Rouge Parish County
Limited Results Shown
Create a free account, or log in to reveal all property listings and enjoy the complete experience.

Active
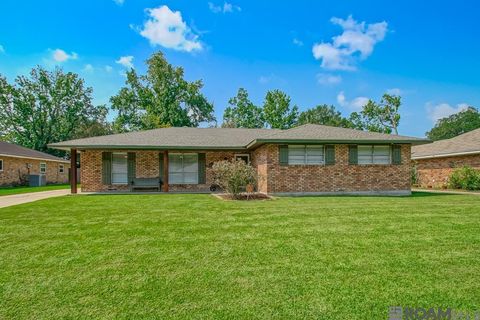
$169,000
3
bds
|
2
ba
|
1,189
sqft
|
built
1959
11733 Biscayne Dr, Baton Rouge, LA 70814
$304
Cash flow
9.4%
Cash-on-Cash Return
7.8%
Cap rate
0.9%
Rent to Value Ratio

Active
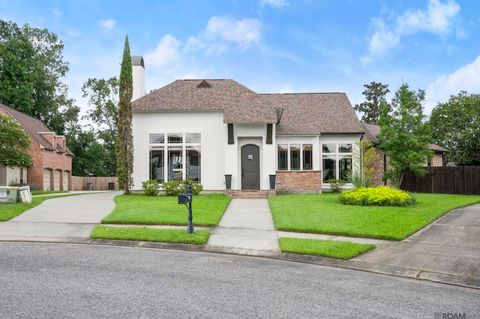
$324,900
4
bds
|
3
ba
|
2,047
sqft
|
built
2022
6443 Tiger Pointe Dr, Baton Rouge, LA 70817
$3
Cash flow
0.0%
Cash-on-Cash Return
5.7%
Cap rate
0.7%
Rent to Value Ratio

Active
$98,750
bds
|
0
ba
|
1,075
sqft
|
built
2227 Kentucky St, Baton Rouge, LA 70802
$223
Cash flow
11.8%
Cash-on-Cash Return
8.4%
Cap rate
1.0%
Rent to Value Ratio

Active
$315,000
bds
|
0
ba
|
3,908
sqft
|
built
1982
8271 Ned Ave, Baton Rouge, LA 70820
$27
Cash flow
0.4%
Cash-on-Cash Return
5.8%
Cap rate
0.7%
Rent to Value Ratio

Active
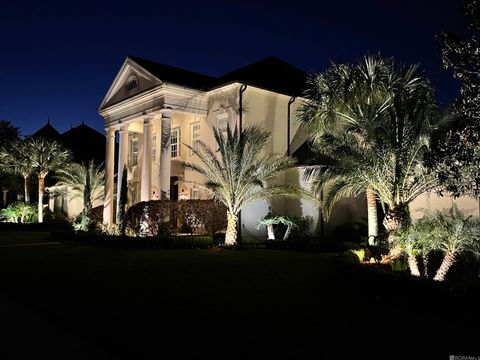
$2,250,000
3
bds
|
5
ba
|
5,017
sqft
|
built
2007
3109 E Lakeshore Dr, Baton Rouge, LA 70808
$-8,233
Cash flow
-19.1%
Cash-on-Cash Return
1.3%
Cap rate
0.2%
Rent to Value Ratio
Active
$599,000
4
bds
|
4
ba
|
2,851
sqft
|
built
2007
17515 Shady Elm Ave, Baton Rouge, LA 70816
$-660
Cash flow
-5.7%
Cash-on-Cash Return
4.4%
Cap rate
0.5%
Rent to Value Ratio

Active
$210,000
4
bds
|
2
ba
|
1,650
sqft
|
built
1968
4624 Wells St, Baton Rouge, LA 70808
$-28
Cash flow
-0.7%
Cash-on-Cash Return
5.5%
Cap rate
0.7%
Rent to Value Ratio
Active
$2,475,000
5
bds
|
6
ba
|
5,616
sqft
|
built
2007
6752 Fountain Ln, Baton Rouge, LA 70809
$-5,137
Cash flow
-10.8%
Cash-on-Cash Return
3.2%
Cap rate
0.4%
Rent to Value Ratio

Active
$385,000
4
bds
|
4
ba
|
2,529
sqft
|
built
1940
835 Maximillian St, Baton Rouge, LA 70802
$-442
Cash flow
-6.0%
Cash-on-Cash Return
4.3%
Cap rate
0.5%
Rent to Value Ratio

Active
$349,000
4
bds
|
3
ba
|
2,095
sqft
|
built
2010
15130 Hidden Villa Dr, Baton Rouge, LA 70810
$-27
Cash flow
-0.4%
Cash-on-Cash Return
5.6%
Cap rate
0.7%
Rent to Value Ratio

Active
$139,900
2
bds
|
2
ba
|
1,358
sqft
|
built
1981
1446 Sharlo Ave, Baton Rouge, LA 70820
$195
Cash flow
7.3%
Cash-on-Cash Return
7.4%
Cap rate
0.9%
Rent to Value Ratio

Active
$1,799,999
4
bds
|
4
ba
|
4,842
sqft
|
built
2018
7637 Settlers Cir, Baton Rouge, LA 70810
$-4,162
Cash flow
-12.1%
Cash-on-Cash Return
2.9%
Cap rate
0.4%
Rent to Value Ratio
Active
$225,000
3
bds
|
2
ba
|
1,773
sqft
|
built
1974
12764 Archery Dr, Baton Rouge, LA 70815
$177
Cash flow
4.1%
Cash-on-Cash Return
6.6%
Cap rate
0.8%
Rent to Value Ratio

Active
$599,000
3
bds
|
3
ba
|
2,951
sqft
|
built
2006
11011 Shoreline Dr, Baton Rouge, LA 70809
$-936
Cash flow
-8.2%
Cash-on-Cash Return
3.8%
Cap rate
0.5%
Rent to Value Ratio
Active
$159,900
1
bds
|
1
ba
|
920
sqft
|
built
1970
13848 Reed Ave, Baton Rouge, LA 70818
$140
Cash flow
4.6%
Cash-on-Cash Return
6.7%
Cap rate
0.8%
Rent to Value Ratio

Active
$285,000
4
bds
|
3
ba
|
2,499
sqft
|
built
1960
466 Landwood Dr, Baton Rouge, LA 70806
$-109
Cash flow
-2.0%
Cash-on-Cash Return
5.2%
Cap rate
0.6%
Rent to Value Ratio

Active
$934,900
4
bds
|
5
ba
|
3,418
sqft
|
built
2016
7766 Settlers Cir, Baton Rouge, LA 70810
$-296
Cash flow
-1.7%
Cash-on-Cash Return
5.3%
Cap rate
0.7%
Rent to Value Ratio
Active
$435,610
3
bds
|
3
ba
|
2,994
sqft
|
built
1978
1142 Pompey Dr, Baton Rouge, LA 70816
$-681
Cash flow
-8.2%
Cash-on-Cash Return
3.8%
Cap rate
0.5%
Rent to Value Ratio

Active
$235,000
3
bds
|
2
ba
|
2,688
sqft
|
built
1966
3290 Monterrey Dr, Baton Rouge, LA 70814
$-146
Cash flow
-3.2%
Cash-on-Cash Return
4.9%
Cap rate
0.6%
Rent to Value Ratio

Active
$177,000
3
bds
|
2
ba
|
1,725
sqft
|
built
1978
3523 Yosemite Dr, Baton Rouge, LA 70814
$266
Cash flow
7.8%
Cash-on-Cash Return
7.5%
Cap rate
0.9%
Rent to Value Ratio
Active
$410,000
3
bds
|
3
ba
|
1,767
sqft
|
built
2020
13201 Magnolia Square Dr, Baton Rouge, LA 70818
$-963
Cash flow
-12.3%
Cash-on-Cash Return
2.9%
Cap rate
0.4%
Rent to Value Ratio

Active
$299,990
3
bds
|
2
ba
|
1,801
sqft
|
built
1992
5242 River Meadow Dr, Baton Rouge, LA 70820
$88
Cash flow
1.5%
Cash-on-Cash Return
6.0%
Cap rate
0.7%
Rent to Value Ratio

Active
$535,000
4
bds
|
3
ba
|
3,210
sqft
|
built
1981
448 E Woodruff Dr, Baton Rouge, LA 70808
$-650
Cash flow
-6.3%
Cash-on-Cash Return
4.2%
Cap rate
0.5%
Rent to Value Ratio

Active
$160,000
3
bds
|
2
ba
|
1,400
sqft
|
built
1970
3644 Byron St, Baton Rouge, LA 70805
$140
Cash flow
4.6%
Cash-on-Cash Return
6.7%
Cap rate
0.8%
Rent to Value Ratio

Active
$375,000
3
bds
|
3
ba
|
2,314
sqft
|
built
1984
7850 Boone Ave, Baton Rouge, LA 70808
$-50
Cash flow
-0.7%
Cash-on-Cash Return
5.5%
Cap rate
0.7%
Rent to Value Ratio
Active
$230,000
3
bds
|
2
ba
|
1,502
sqft
|
built
1958
8261 Sholar Dr, Baton Rouge, LA 70809
$16
Cash flow
0.4%
Cash-on-Cash Return
5.8%
Cap rate
0.7%
Rent to Value Ratio

Active
$525,000
4
bds
|
3
ba
|
2,751
sqft
|
built
2013
2706 Carnoustie Dr, Zachary, LA 70791
$-683
Cash flow
-6.8%
Cash-on-Cash Return
4.1%
Cap rate
0.6%
Rent to Value Ratio

Active
$415,000
5
bds
|
3
ba
|
3,217
sqft
|
built
1993
4911 Fennwood Dr, Zachary, LA 70791
$-32
Cash flow
-0.4%
Cash-on-Cash Return
5.6%
Cap rate
0.7%
Rent to Value Ratio

Active
$299,000
3
bds
|
2
ba
|
2,083
sqft
|
built
1984
15239 White Oak Run Dr, Pride, LA 70770
$34
Cash flow
0.6%
Cash-on-Cash Return
5.8%
Cap rate
0.7%
Rent to Value Ratio

Active
$429,900
4
bds
|
3
ba
|
2,114
sqft
|
built
1950
4013 Hyacinth Ave, Baton Rouge, LA 70808
$-322
Cash flow
-3.9%
Cash-on-Cash Return
4.8%
Cap rate
0.6%
Rent to Value Ratio

Active
$75,000
3
bds
|
1
ba
|
926
sqft
|
built
1955
6824 Autumn Ave, Baton Rouge, LA 70812
$404
Cash flow
28.1%
Cash-on-Cash Return
12.1%
Cap rate
1.5%
Rent to Value Ratio
Active
$295,000
4
bds
|
3
ba
|
2,610
sqft
|
built
1993
822 Woodcliff Dr, Baton Rouge, LA 70815
$122
Cash flow
2.2%
Cash-on-Cash Return
6.2%
Cap rate
0.7%
Rent to Value Ratio

Active
$249,900
3
bds
|
2
ba
|
1,729
sqft
|
built
2014
2704 Arceneaux Ave, Zachary, LA 70791
$162
Cash flow
3.4%
Cash-on-Cash Return
6.5%
Cap rate
0.8%
Rent to Value Ratio

Active
$1,015,000
4
bds
|
4
ba
|
3,576
sqft
|
built
2018
7515 Tilton Ct, Baton Rouge, LA 70806
$-951
Cash flow
-4.9%
Cash-on-Cash Return
4.6%
Cap rate
0.6%
Rent to Value Ratio
Active
$995,000
5
bds
|
3
ba
|
4,114
sqft
|
built
1997
17230 N Lakeway Ave, Baton Rouge, LA 70810
$-2,500
Cash flow
-13.1%
Cash-on-Cash Return
2.7%
Cap rate
0.4%
Rent to Value Ratio
Active
$245,900
3
bds
|
2
ba
|
2,466
sqft
|
built
1958
11666 Parkwood Dr, Baton Rouge, LA 70815
$283
Cash flow
6.0%
Cash-on-Cash Return
7.1%
Cap rate
0.9%
Rent to Value Ratio
Active
$199,995
4
bds
|
3
ba
|
1,864
sqft
|
built
2008
1535 Stilt St, Baton Rouge, LA 70807
$296
Cash flow
7.7%
Cash-on-Cash Return
7.5%
Cap rate
0.9%
Rent to Value Ratio

Active
$89,000
2
bds
|
2
ba
|
1,135
sqft
|
built
1975
4364 Gurney St, Baton Rouge, LA 70805
$476
Cash flow
27.9%
Cash-on-Cash Return
12.1%
Cap rate
1.5%
Rent to Value Ratio