Logan, UT Investment Properties for Sale
Browse homes for sale and investment properties in Logan, UT. Refine your search by price, property type, or more.
Best cash flowing properties in Logan, UT
Active
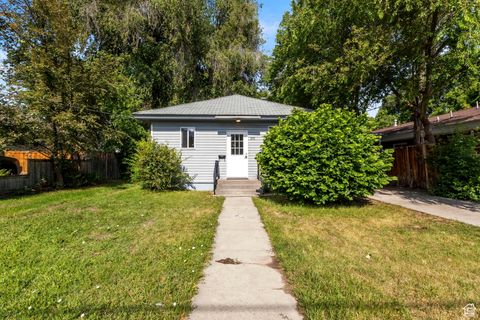
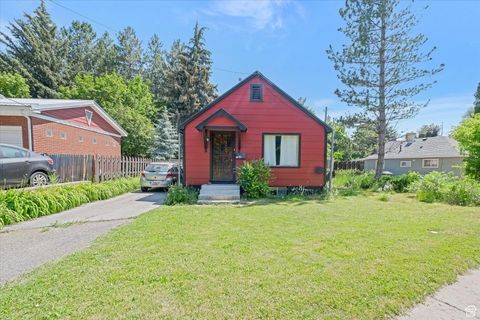
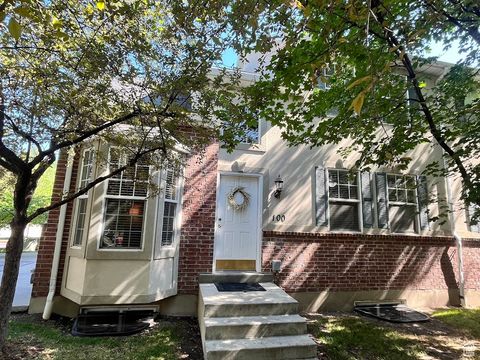
$299,000
2
bds
|
1
ba
|
986
sqft
|
built
1922
355 N 300 W, Logan, UT 84321
$-416
Cash flow
-7.3%
Cash-on-Cash Return
4.0%
Cap rate
0.5%
Rent to Value Ratio
Active
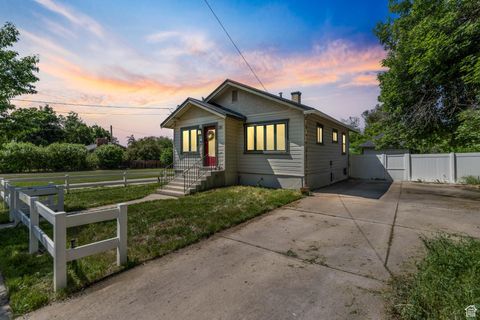
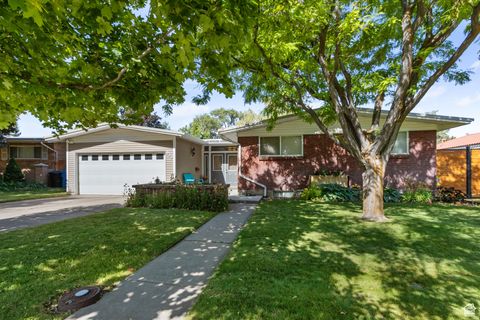
$303,000
3
bds
|
1
ba
|
951
sqft
|
built
1919
381 E 300 S, Logan, UT 84321
$-438
Cash flow
-7.5%
Cash-on-Cash Return
3.9%
Cap rate
0.5%
Rent to Value Ratio
58 out of 65 properties for sale in Logan, UT
Limited Results Shown
Create a free account, or log in to reveal all property listings and enjoy the complete experience.
Active
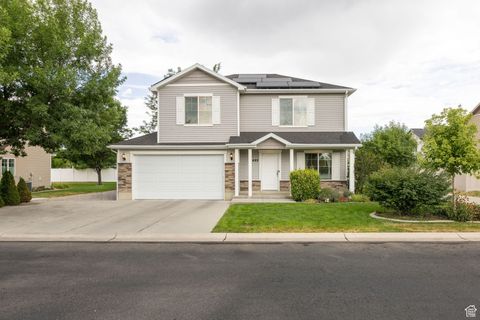
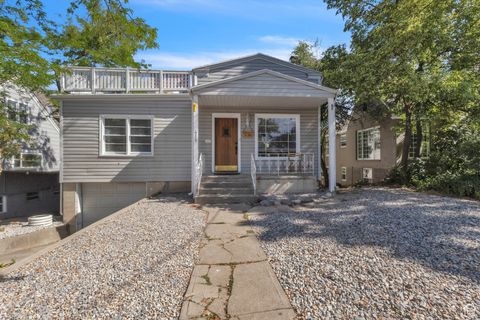
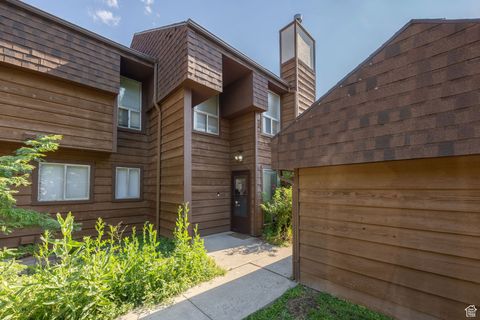
$418,000
3
bds
|
3
ba
|
1,360
sqft
|
built
2012
485 W 880 N, Logan, UT 84321
$-910
Cash flow
-11.4%
Cash-on-Cash Return
3.1%
Cap rate
0.4%
Rent to Value Ratio
Active
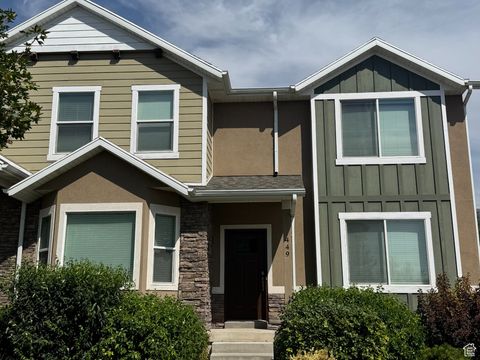
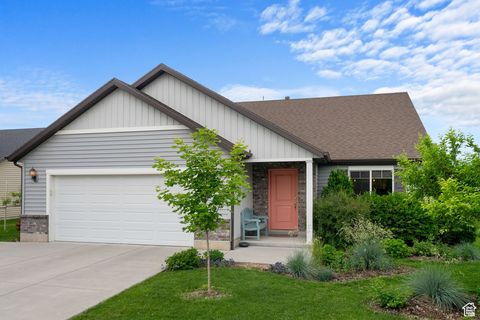
$349,900
3
bds
|
3
ba
|
1,481
sqft
|
built
2015
449 E 2170 N, Logan, UT 84341
$-804
Cash flow
-12.0%
Cash-on-Cash Return
2.9%
Cap rate
0.5%
Rent to Value Ratio
Active
$539,500
4
bds
|
3
ba
|
3,012
sqft
|
built
1981
235 E 1100 N, Logan, UT 84341
$-1,491
Cash flow
-14.4%
Cash-on-Cash Return
2.4%
Cap rate
0.3%
Rent to Value Ratio
Active
$625,000
5
bds
|
3
ba
|
3,218
sqft
|
built
1994
1575 N 1640 E, Logan, UT 84341
$-1,450
Cash flow
-12.1%
Cash-on-Cash Return
2.9%
Cap rate
0.4%
Rent to Value Ratio
Active
$525,000
3
bds
|
3
ba
|
2,730
sqft
|
built
2007
14 Shadow Mountain Dr, Logan, UT 84321
$-1,145
Cash flow
-11.4%
Cash-on-Cash Return
3.1%
Cap rate
0.5%
Rent to Value Ratio
Active
$332,900
3
bds
|
3
ba
|
1,583
sqft
|
built
2007
514 W 1490 N, Logan, UT 84341
$-603
Cash flow
-9.5%
Cash-on-Cash Return
3.5%
Cap rate
0.5%
Rent to Value Ratio
Active
$425,000
4
bds
|
1
ba
|
1,820
sqft
|
built
1915
871 N 700 E, Logan, UT 84321
$-902
Cash flow
-11.1%
Cash-on-Cash Return
3.1%
Cap rate
0.4%
Rent to Value Ratio
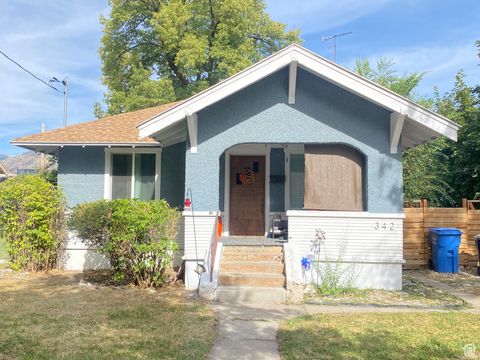
Active
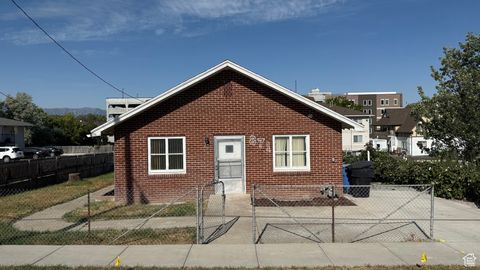
$335,000
3
bds
|
2
ba
|
1,404
sqft
|
built
1916
342 N 100 W, Logan, UT 84321
$-530
Cash flow
-8.3%
Cash-on-Cash Return
3.8%
Cap rate
0.5%
Rent to Value Ratio
Active
$349,900
4
bds
|
3
ba
|
2,019
sqft
|
built
1998
1950 S 1250 W, Logan, UT 84321
$-521
Cash flow
-7.8%
Cash-on-Cash Return
3.9%
Cap rate
0.5%
Rent to Value Ratio
Active
$397,000
2
bds
|
2
ba
|
2,312
sqft
|
built
1921
235 W 500 N, Logan, UT 84321
$-1,117
Cash flow
-14.7%
Cash-on-Cash Return
2.3%
Cap rate
0.3%
Rent to Value Ratio
Active
$309,900
1
bds
|
1
ba
|
1,240
sqft
|
built
1935
314 Canyon Rd, Logan, UT 84321
$-600
Cash flow
-10.1%
Cash-on-Cash Return
3.4%
Cap rate
0.5%
Rent to Value Ratio
Active
$599,999
6
bds
|
2
ba
|
2,400
sqft
|
built
1939
435 E 300 N, Logan, UT 84321
$-1,466
Cash flow
-12.7%
Cash-on-Cash Return
2.7%
Cap rate
0.4%
Rent to Value Ratio
Active
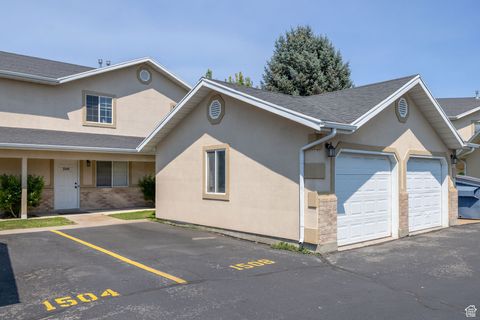
$254,900
2
bds
|
2
ba
|
1,190
sqft
|
built
1996
1506 Talon Dr, Logan, UT 84321
$-507
Cash flow
-10.4%
Cash-on-Cash Return
3.3%
Cap rate
0.5%
Rent to Value Ratio
Active
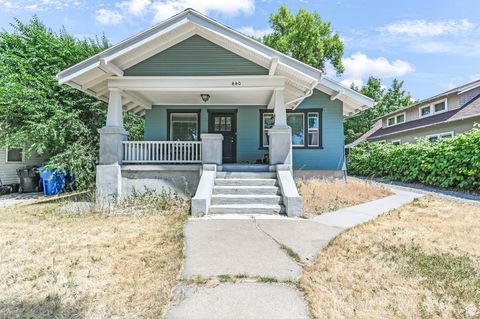
$549,000
4
bds
|
3
ba
|
1,782
sqft
|
built
1924
440 N 400 E, Logan, UT 84321
$-2,006
Cash flow
-19.1%
Cash-on-Cash Return
1.3%
Cap rate
0.2%
Rent to Value Ratio
Active
$390,500
4
bds
|
4
ba
|
2,630
sqft
|
built
2003
1030 N 130 W, Logan, UT 84341
$-781
Cash flow
-10.4%
Cash-on-Cash Return
3.3%
Cap rate
0.5%
Rent to Value Ratio
Active
$635,000
5
bds
|
3
ba
|
2,986
sqft
|
built
1961
825 N 1400 E, Logan, UT 84321
$-1,805
Cash flow
-14.8%
Cash-on-Cash Return
2.3%
Cap rate
0.3%
Rent to Value Ratio
Active
$235,000
2
bds
|
1
ba
|
904
sqft
|
built
1978
1085 N 375 W, Logan, UT 84341
$-458
Cash flow
-10.2%
Cash-on-Cash Return
3.3%
Cap rate
0.6%
Rent to Value Ratio
Active
$425,000
3
bds
|
2
ba
|
1,552
sqft
|
built
2011
873 N 480 W, Logan, UT 84321
$-672
Cash flow
-8.2%
Cash-on-Cash Return
3.8%
Cap rate
0.5%
Rent to Value Ratio
Active
$989,000
6
bds
|
7
ba
|
6,435
sqft
|
built
1993
240 N 1480 E, Logan, UT 84321
$-1,532
Cash flow
-8.1%
Cash-on-Cash Return
3.8%
Cap rate
0.5%
Rent to Value Ratio
Active
$275,000
2
bds
|
2
ba
|
1,224
sqft
|
built
2000
85 Hampton Pl, Logan, UT 84341
$-591
Cash flow
-11.2%
Cash-on-Cash Return
3.1%
Cap rate
0.5%
Rent to Value Ratio
Active
$274,000
3
bds
|
2
ba
|
1,331
sqft
|
built
1973
165 E 100 N, Logan, UT 84321
$-560
Cash flow
-10.7%
Cash-on-Cash Return
3.2%
Cap rate
0.6%
Rent to Value Ratio
Active
$800,000
4
bds
|
4
ba
|
4,047
sqft
|
built
1907
230 W Center St, Logan, UT 84321
$-2,153
Cash flow
-14.0%
Cash-on-Cash Return
2.4%
Cap rate
0.4%
Rent to Value Ratio
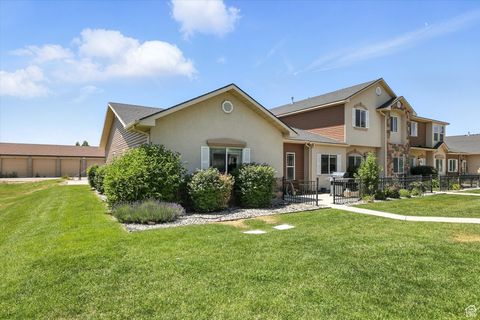
Active
$324,500
3
bds
|
3
ba
|
1,595
sqft
|
built
2007
1568 N 565 W, Logan, UT 84341
$-568
Cash flow
-9.1%
Cash-on-Cash Return
3.6%
Cap rate
0.6%
Rent to Value Ratio
Active
$935,000
6
bds
|
5
ba
|
5,272
sqft
|
built
1993
27 Canterbury Ln, Logan, UT 84321
$-1,215
Cash flow
-6.8%
Cash-on-Cash Return
4.1%
Cap rate
0.5%
Rent to Value Ratio
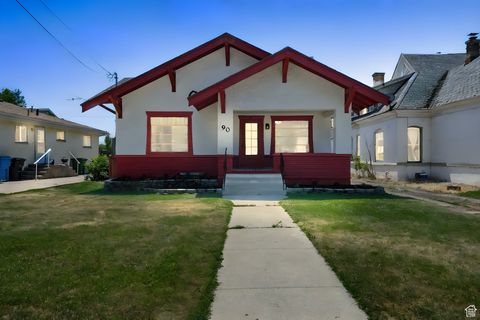
Active
$315,000
3
bds
|
1
ba
|
1,093
sqft
|
built
1912
90 W 200 S, Logan, UT 84321
$-604
Cash flow
-10.0%
Cash-on-Cash Return
3.4%
Cap rate
0.4%
Rent to Value Ratio
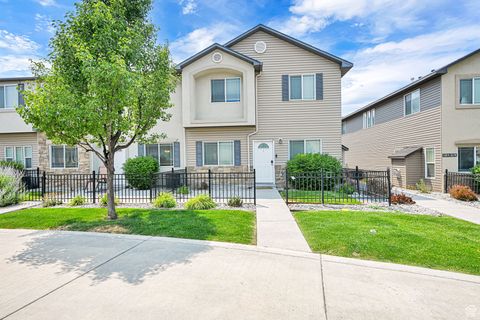
Active
$315,000
3
bds
|
2
ba
|
1,398
sqft
|
built
2008
1492 N 565 W, Logan, UT 84341
$-658
Cash flow
-10.9%
Cash-on-Cash Return
3.2%
Cap rate
0.5%
Rent to Value Ratio
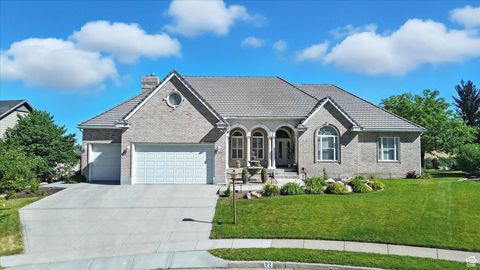
Active
$664,900
3
bds
|
2
ba
|
3,550
sqft
|
built
1996
232 Winding Way, Logan, UT 84321
$-1,683
Cash flow
-13.2%
Cash-on-Cash Return
2.6%
Cap rate
0.4%
Rent to Value Ratio
Active
$899,999
5
bds
|
5
ba
|
7,480
sqft
|
built
1988
1387 E 260 N, Logan, UT 84321
$-1,702
Cash flow
-9.9%
Cash-on-Cash Return
3.4%
Cap rate
0.5%
Rent to Value Ratio
Active
$1,350,000
6
bds
|
6
ba
|
7,771
sqft
|
built
2007
1273 Cedar Heights Dr, Logan, UT 84341
$-4,588
Cash flow
-17.7%
Cash-on-Cash Return
1.6%
Cap rate
0.2%
Rent to Value Ratio
Active
$549,900
4
bds
|
3
ba
|
1,881
sqft
|
built
2022
374 W Ropelato Dr, Logan, UT 84321
$-1,135
Cash flow
-10.8%
Cash-on-Cash Return
3.2%
Cap rate
0.5%
Rent to Value Ratio
Active
$324,900
3
bds
|
3
ba
|
1,454
sqft
|
built
2023
1221 W 1870 S, Logan, UT 84321
$-685
Cash flow
-11.0%
Cash-on-Cash Return
3.2%
Cap rate
0.5%
Rent to Value Ratio
Active
$439,000
4
bds
|
2
ba
|
1,703
sqft
|
built
2000
1099 Three Point Ave, Logan, UT 84321
$-971
Cash flow
-11.5%
Cash-on-Cash Return
3.0%
Cap rate
0.4%
Rent to Value Ratio
Active
$245,000
2
bds
|
2
ba
|
1,190
sqft
|
built
1996
1564 Talon Dr, Logan, UT 84321
$-464
Cash flow
-9.9%
Cash-on-Cash Return
3.4%
Cap rate
0.6%
Rent to Value Ratio
Active
$490,000
6
bds
|
3
ba
|
2,437
sqft
|
built
1993
783 W 430 S, Logan, UT 84321
$-1,313
Cash flow
-14.0%
Cash-on-Cash Return
2.5%
Cap rate
0.3%
Rent to Value Ratio
Active
$384,900
4
bds
|
2
ba
|
2,040
sqft
|
built
1975
570 N 400 W, Logan, UT 84321
$-587
Cash flow
-8.0%
Cash-on-Cash Return
3.8%
Cap rate
0.5%
Rent to Value Ratio
Active
$427,000
4
bds
|
2
ba
|
2,514
sqft
|
built
1961
1188 N 600 E, Logan, UT 84341
$-458
Cash flow
-5.6%
Cash-on-Cash Return
4.4%
Cap rate
0.6%
Rent to Value Ratio
Active
$453,000
4
bds
|
3
ba
|
1,950
sqft
|
built
2021
2124 S 1490 W, Logan, UT 84339
$-719
Cash flow
-8.3%
Cash-on-Cash Return
3.8%
Cap rate
0.5%
Rent to Value Ratio
Active
$464,000
5
bds
|
2
ba
|
2,306
sqft
|
built
1986
1561 N 1525 E, Logan, UT 84341
$-855
Cash flow
-9.6%
Cash-on-Cash Return
3.5%
Cap rate
0.5%
Rent to Value Ratio