Logan, UT Investment Properties for Sale
Browse homes for sale and investment properties in Logan, UT. Refine your search by price, property type, or more.
Best cash flowing properties in Logan, UT
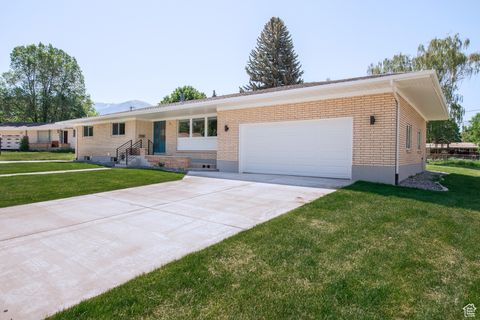
Active
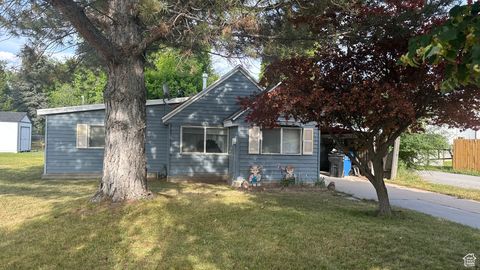
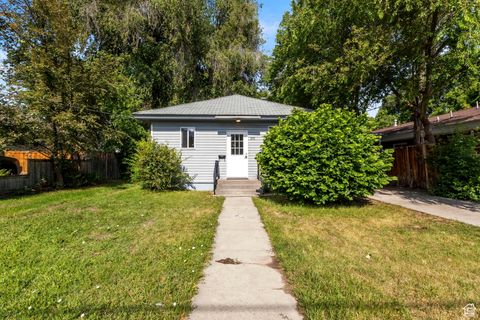
$249,800
3
bds
|
1
ba
|
1,000
sqft
|
built
1949
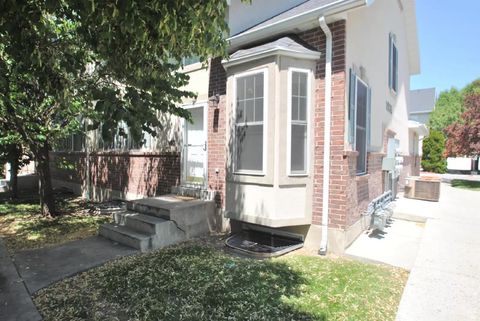
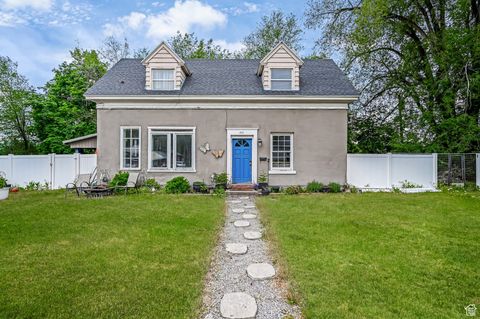
472 N 500 W, Logan, UT 84321
$-149
Cash flow
-3.1%
Cash-on-Cash Return
5.0%
Cap rate
0.6%
Rent to Value Ratio
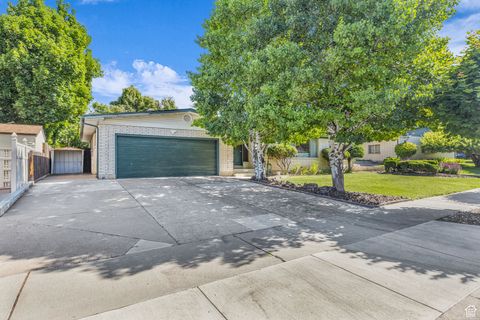
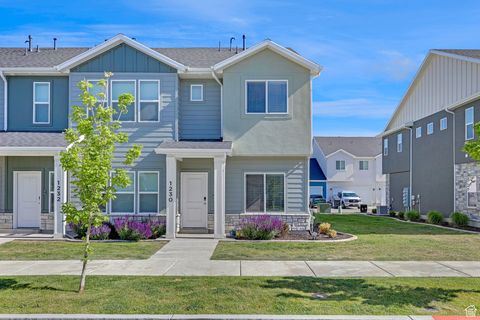
Active
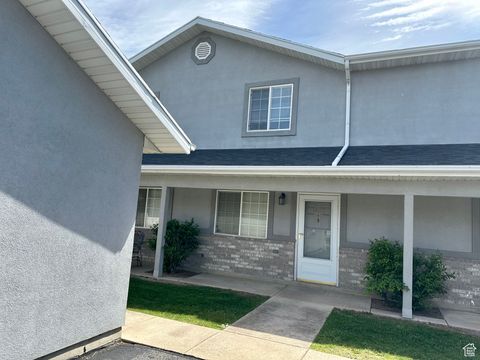
$264,000
2
bds
|
2
ba
|
1,190
sqft
|
built
1996
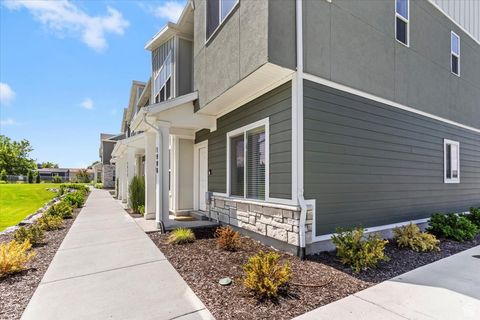
1612 Talon Dr, Logan, UT 84321
$-391
Cash flow
-7.7%
Cash-on-Cash Return
3.9%
Cap rate
0.5%
Rent to Value Ratio
88 out of 98 properties for sale in Logan, UT
Limited Results Shown
Create a free account, or log in to reveal all property listings and enjoy the complete experience.
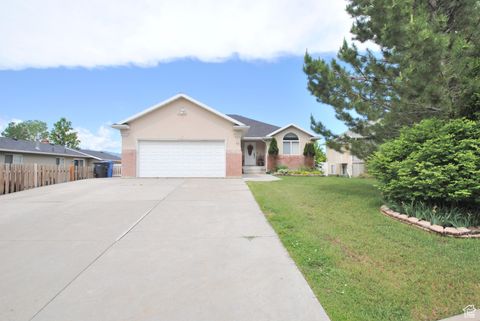
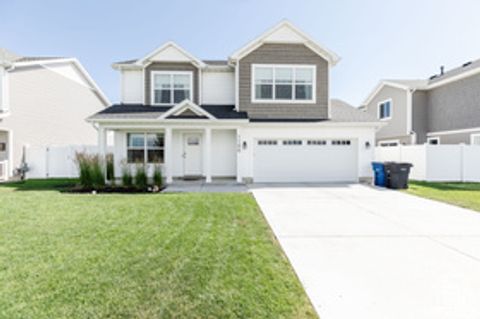
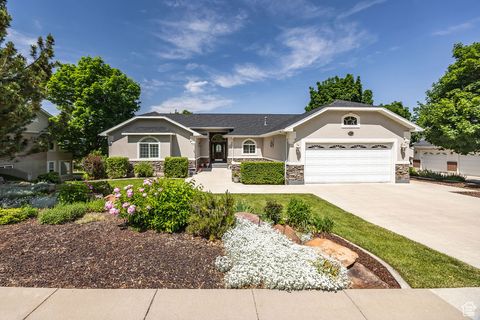
Active
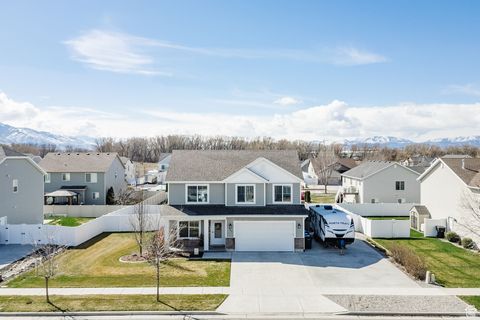
$463,000
4
bds
|
3
ba
|
1,871
sqft
|
built
2017
802 W 1060 S, Logan, UT 84321
$-969
Cash flow
-10.9%
Cash-on-Cash Return
3.2%
Cap rate
0.4%
Rent to Value Ratio
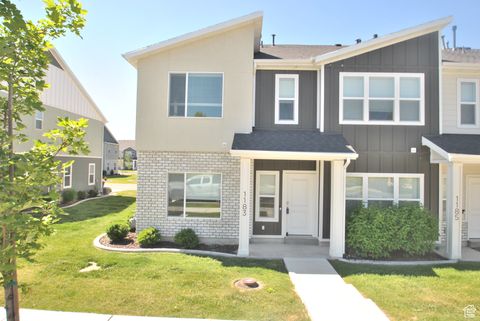
Active
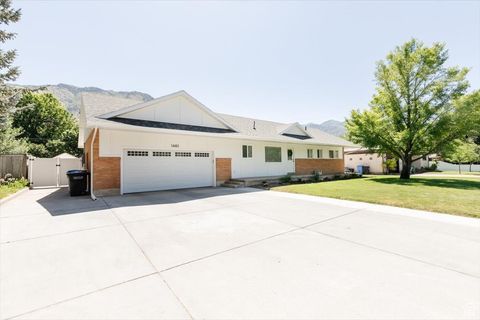
$570,000
5
bds
|
3
ba
|
2,620
sqft
|
built
1963
1440 N 1600 E, Logan, UT 84341
$-1,486
Cash flow
-13.6%
Cash-on-Cash Return
3.1%
Cap rate
0.4%
Rent to Value Ratio
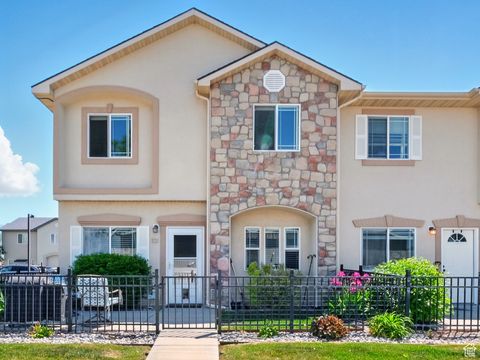
Active
$264,000
2
bds
|
2
ba
|
1,190
sqft
|
built
1996
1564 Talon Dr, Logan, UT 84321
$-678
Cash flow
-13.4%
Cash-on-Cash Return
3.2%
Cap rate
0.5%
Rent to Value Ratio
Active
$262,000
2
bds
|
2
ba
|
1,190
sqft
|
built
1995
53 W 1315 S, Logan, UT 84321
$-541
Cash flow
-10.8%
Cash-on-Cash Return
3.2%
Cap rate
0.5%
Rent to Value Ratio
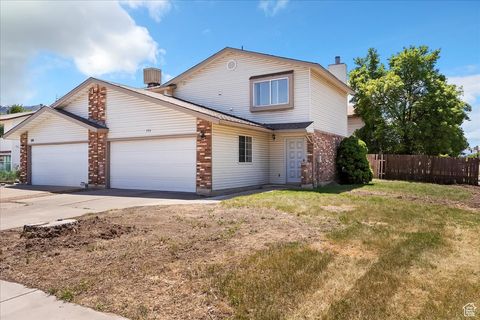
Active
$390,000
4
bds
|
2
ba
|
2,176
sqft
|
built
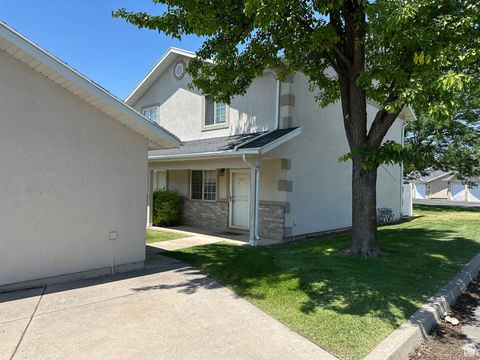
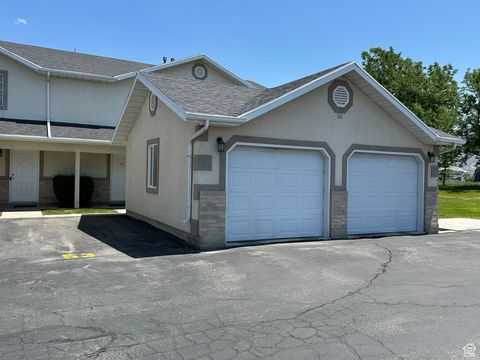
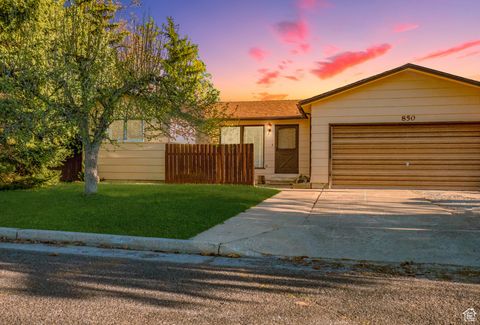
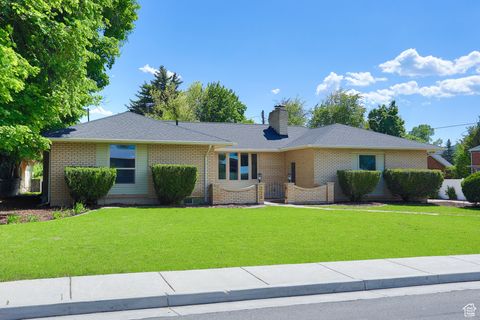
1979
850 W 370 S, Logan, UT 84321
$-476
Cash flow
-6.4%
Cash-on-Cash Return
4.2%
Cap rate
0.6%
Rent to Value Ratio
Active
$500,000
6
bds
|
3
ba
|
2,437
sqft
|
built
1993
783 W 430 S, Logan, UT 84321
$-1,604
Cash flow
-16.7%
Cash-on-Cash Return
2.4%
Cap rate
0.3%
Rent to Value Ratio
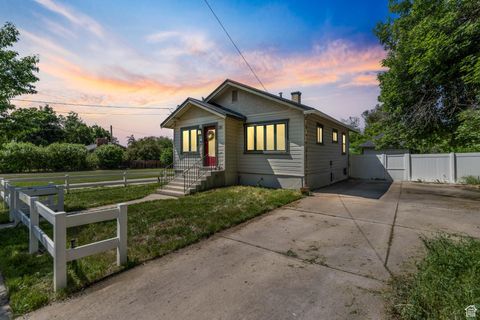
Active
$310,000
2
bds
|
1
ba
|
986
sqft
|
built
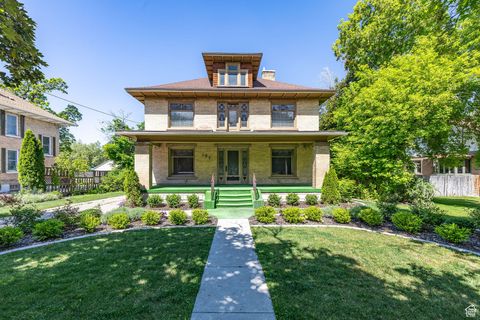
1922
355 N 300 W, Logan, UT 84321
$-468
Cash flow
-7.9%
Cash-on-Cash Return
3.9%
Cap rate
0.5%
Rent to Value Ratio
Active
$488,000
4
bds
|
3
ba
|
3,124
sqft
|
built
1968
1731 E 1460 N, Logan, UT 84341
$-919
Cash flow
-9.8%
Cash-on-Cash Return
3.4%
Cap rate
0.5%
Rent to Value Ratio
Active
$669,000
5
bds
|
3
ba
|
3,376
sqft
|
built
2000
93 S 1250 E, Logan, UT 84321
$-1,429
Cash flow
-11.1%
Cash-on-Cash Return
3.1%
Cap rate
0.4%
Rent to Value Ratio
Active
$324,900
3
bds
|
3
ba
|
1,462
sqft
|
built
2021
1183 W 1820 S, Logan, UT 84321
$-550
Cash flow
-8.8%
Cash-on-Cash Return
3.6%
Cap rate
0.6%
Rent to Value Ratio
Active
$949,000
5
bds
|
4
ba
|
3,774
sqft
|
built
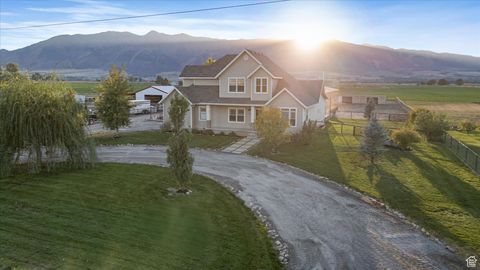
1999
1953 E Highway 101, Logan, UT 84321
$-3,603
Cash flow
-19.8%
Cash-on-Cash Return
1.7%
Cap rate
0.3%
Rent to Value Ratio
Active
$1,789,000
6
bds
|
5
ba
|
8,214
sqft
|
built
1995
1188 N 1750 E, Logan, UT 84341
$-5,823
Cash flow
-17.0%
Cash-on-Cash Return
1.8%
Cap rate
0.3%
Rent to Value Ratio
Active
$459,999
4
bds
|
2
ba
|
3,012
sqft
|
built
1976
1520 N 1600 E, Logan, UT 84341
$-432
Cash flow
-4.9%
Cash-on-Cash Return
4.6%
Cap rate
0.6%
Rent to Value Ratio
Active
$427,000
4
bds
|
2
ba
|
2,514
sqft
|
built
1961
1188 N 600 E, Logan, UT 84341
$-458
Cash flow
-5.6%
Cash-on-Cash Return
4.4%
Cap rate
0.6%
Rent to Value Ratio
Active
$459,900
4
bds
|
3
ba
|
1,950
sqft
|
built
2021
2124 S 1490 W, Logan, UT 84339
$-751
Cash flow
-8.5%
Cash-on-Cash Return
3.7%
Cap rate
0.5%
Rent to Value Ratio
Active
$470,000
5
bds
|
2
ba
|
2,306
sqft
|
built
1986
1561 N 1525 E, Logan, UT 84341
$-883
Cash flow
-9.8%
Cash-on-Cash Return
3.4%
Cap rate
0.5%
Rent to Value Ratio
Active
$659,900
5
bds
|
3
ba
|
3,228
sqft
|
built
1997
1536 Mountain Rd, Logan, UT 84321
$-1,393
Cash flow
-11.0%
Cash-on-Cash Return
3.1%
Cap rate
0.4%
Rent to Value Ratio
Active
$529,000
5
bds
|
4
ba
|
2,898
sqft
|
built
1989
1553 N 1525 E, Logan, UT 84341
$-978
Cash flow
-9.6%
Cash-on-Cash Return
3.5%
Cap rate
0.5%
Rent to Value Ratio
Active
$425,000
3
bds
|
3
ba
|
1,330
sqft
|
built
2018
1186 W 200 S, Logan, UT 84321
$-783
Cash flow
-9.6%
Cash-on-Cash Return
3.5%
Cap rate
0.5%
Rent to Value Ratio
Active
$285,000
2
bds
|
2
ba
|
1,116
sqft
|
built
1979
190 W 1100 N, Logan, UT 84341
$-697
Cash flow
-12.8%
Cash-on-Cash Return
2.7%
Cap rate
0.4%
Rent to Value Ratio
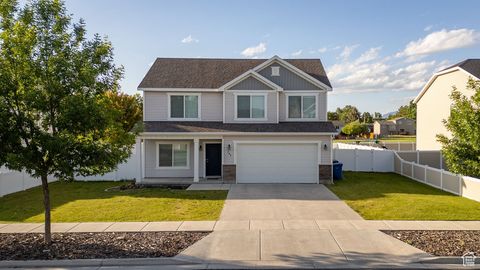
Active
$450,000
4
bds
|
3
ba
|
1,871
sqft
|
built
2017
763 W 1060 S, Logan, UT 84321
$-905
Cash flow
-10.5%
Cash-on-Cash Return
3.3%
Cap rate
0.4%
Rent to Value Ratio
Active
$310,000
3
bds
|
1
ba
|
951
sqft
|
built
1919
381 E 300 S, Logan, UT 84321
$-471
Cash flow
-7.9%
Cash-on-Cash Return
3.9%
Cap rate
0.5%
Rent to Value Ratio
Active
$695,000
5
bds
|
4
ba
|
3,884
sqft
|
built
1962
286 E 870 N, Logan, UT 84321
$-2,391
Cash flow
-17.9%
Cash-on-Cash Return
1.6%
Cap rate
0.2%
Rent to Value Ratio

Active
$474,990
3
bds
|
2
ba
|
2,402
sqft
|
built
2025
570 N 600 E, Logan, UT 84321
$-1,077
Cash flow
-11.8%
Cash-on-Cash Return
3.0%
Cap rate
0.4%
Rent to Value Ratio
Active
$305,000
2
bds
|
3
ba
|
1,148
sqft
|
built
2022
1230 W 1820 S, Logan, UT 84321
$-647
Cash flow
-11.1%
Cash-on-Cash Return
3.1%
Cap rate
0.5%
Rent to Value Ratio
Active
$1,100,000
6
bds
|
5
ba
|
5,992
sqft
|
built
2001
1507 Mount Logan Dr, Logan, UT 84321
$-2,176
Cash flow
-10.3%
Cash-on-Cash Return
3.3%
Cap rate
0.4%
Rent to Value Ratio
Active
$349,000
4
bds
|
3
ba
|
1,579
sqft
|
built
2007
1587 N 565 W, Logan, UT 84341
$-756
Cash flow
-11.3%
Cash-on-Cash Return
3.1%
Cap rate
0.5%
Rent to Value Ratio
Active
$399,900
4
bds
|
4
ba
|
2,631
sqft
|
built
2003
1035 N 130 W, Logan, UT 84341
$-828
Cash flow
-10.8%
Cash-on-Cash Return
3.2%
Cap rate
0.5%
Rent to Value Ratio
Active
$550,000
7
bds
|
3
ba
|
3,876
sqft
|
built
1911
157 N 500 W, Logan, UT 84321
$-1,415
Cash flow
-13.4%
Cash-on-Cash Return
2.6%
Cap rate
0.4%
Rent to Value Ratio
Active
$589,900
5
bds
|
4
ba
|
3,946
sqft
|
built
1973
220 E 870 N, Logan, UT 84321
$-1,260
Cash flow
-11.1%
Cash-on-Cash Return
3.1%
Cap rate
0.4%
Rent to Value Ratio
Active
$1,075,000
4
bds
|
3
ba
|
3,309
sqft
|
built
2005
1697 S 3200 W, Logan, UT 84321
$-2,552
Cash flow
-12.4%
Cash-on-Cash Return
2.8%
Cap rate
0.4%
Rent to Value Ratio
Active
$529,900
4
bds
|
2
ba
|
2,150
sqft
|
built
1958
1393 Davis Ave, Logan, UT 84321
$-1,133
Cash flow
-11.2%
Cash-on-Cash Return
3.1%
Cap rate
0.4%
Rent to Value Ratio
Active
$539,990
5
bds
|
4
ba
|
3,974
sqft
|
built
1977
267 E 1100 N, Logan, UT 84341
$-1,626
Cash flow
-15.7%
Cash-on-Cash Return
2.6%
Cap rate
0.4%
Rent to Value Ratio
Active
$389,900
4
bds
|
2
ba
|
2,015
sqft
|
built
1924
73 E 400 S, Logan, UT 84321
$-1,945
Cash flow
-26.0%
Cash-on-Cash Return
-0.3%
Cap rate
0.4%
Rent to Value Ratio
Active
$462,000
4
bds
|
3
ba
|
2,187
sqft
|
built
2006
679 Trail Cir, Logan, UT 84321
$-852
Cash flow
-9.6%
Cash-on-Cash Return
3.5%
Cap rate
0.5%
Rent to Value Ratio
Active
$465,000
4
bds
|
2
ba
|
2,050
sqft
|
built
1974
430 W 550 N, Logan, UT 84321
$-977
Cash flow
-11.0%
Cash-on-Cash Return
3.2%
Cap rate
0.4%
Rent to Value Ratio
Active
$340,000
3
bds
|
2
ba
|
1,693
sqft
|
built
1897
201 S 400 W, Logan, UT 84321
$-480
Cash flow
-7.4%
Cash-on-Cash Return
4.0%
Cap rate
0.5%
Rent to Value Ratio
Active
$309,900
2
bds
|
3
ba
|
1,200
sqft
|
built
2022
1908 S 1280 W, Logan, UT 84321
$-672
Cash flow
-11.3%
Cash-on-Cash Return
3.1%
Cap rate
0.5%
Rent to Value Ratio