Hampden County Investment Properties for Sale
Browse homes for sale and investment properties in Hampden County. Refine your search by price, property type, or more.
Best cash flowing properties in Hampden County
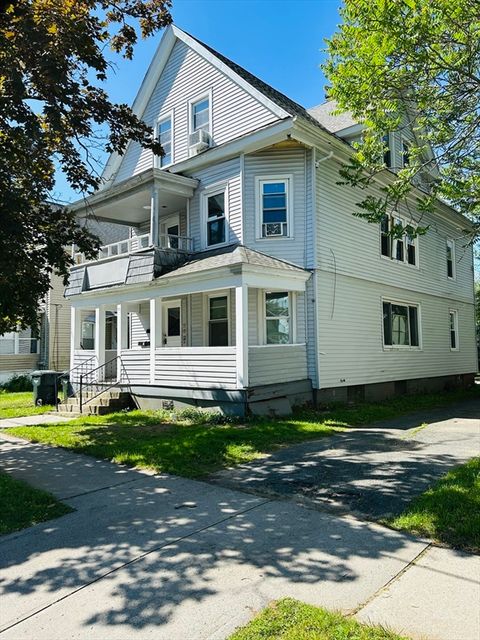
Active
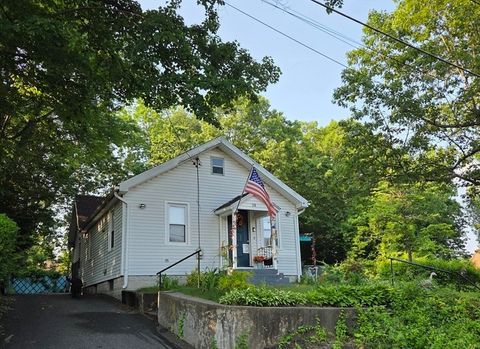
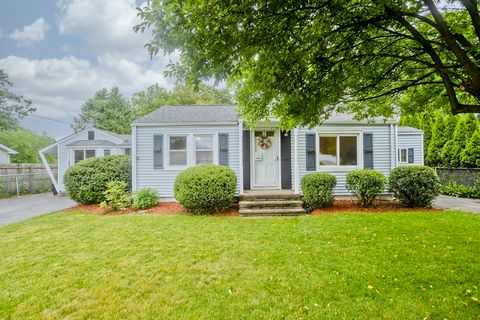
$100,000
2
bds
|
2
ba
|
1,180
sqft
|
built
1955
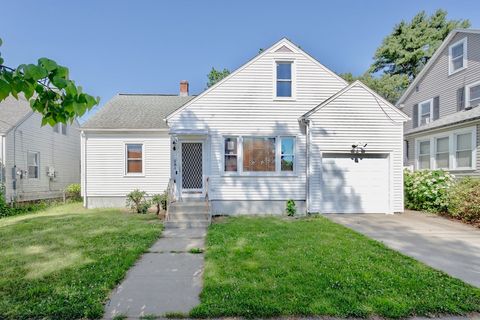
101 Mulberry St, Springfield, MA 01105
$200
Cash flow
10.4%
Cash-on-Cash Return
8.1%
Cap rate
2.0%
Rent to Value Ratio
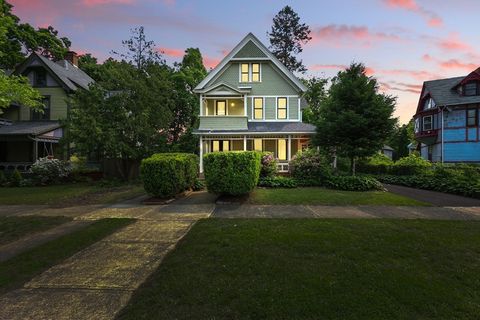
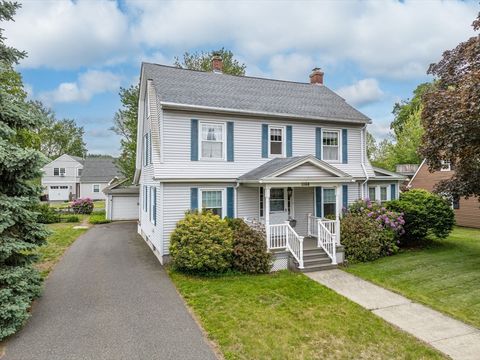
Active
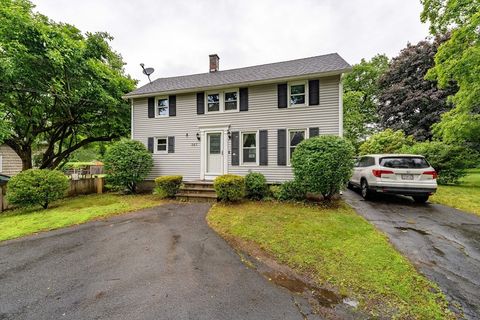
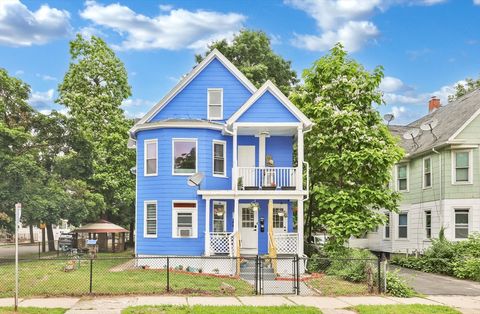
$299,900
4
bds
|
2
ba
|
2,014
sqft
|
built
1975
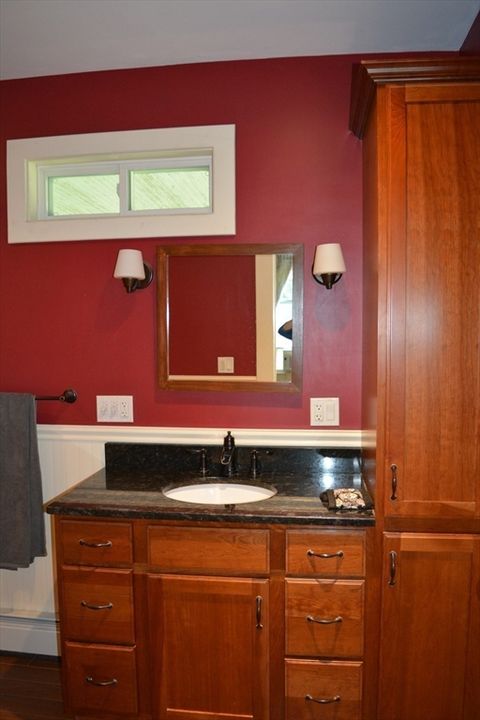
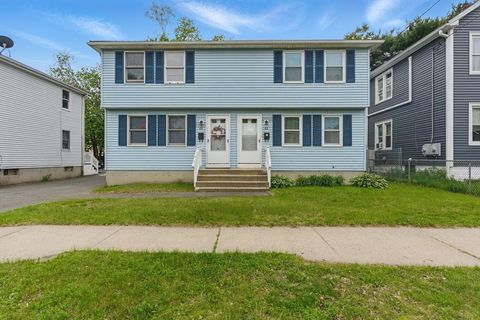
30 Kathy Ter, Feeding Hills, MA 01030
$138
Cash flow
2.4%
Cash-on-Cash Return
6.2%
Cap rate
0.9%
Rent to Value Ratio
289 out of 368 properties for sale in Hampden County
Limited Results Shown
Create a free account, or log in to reveal all property listings and enjoy the complete experience.
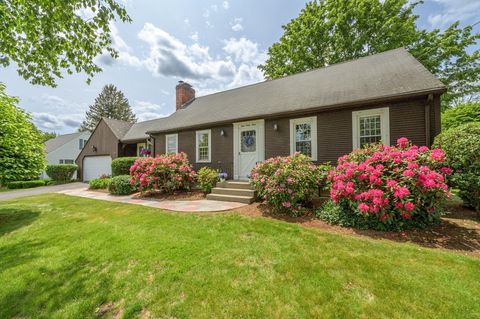
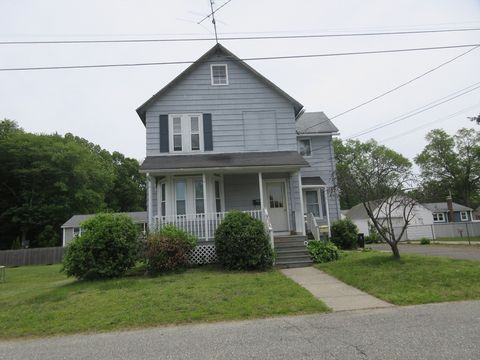
Active
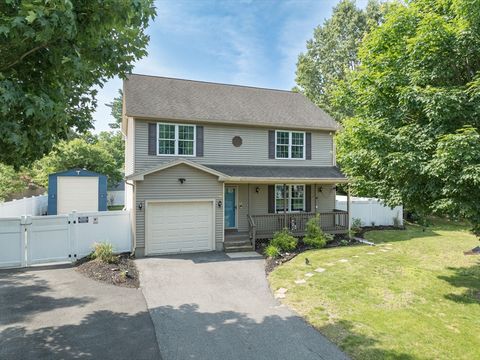
$299,900
4
bds
|
2
ba
|
1,642
sqft
|
built
1930
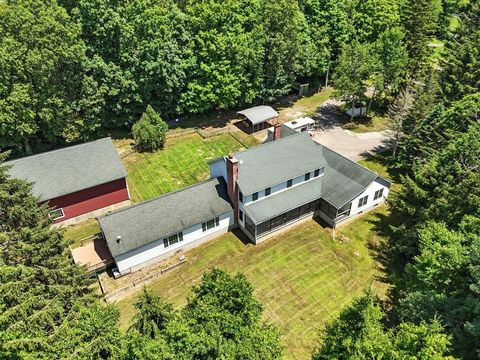
75 Reservation Rd, Holyoke, MA 01040
$-75
Cash flow
-1.3%
Cash-on-Cash Return
5.4%
Cap rate
0.8%
Rent to Value Ratio
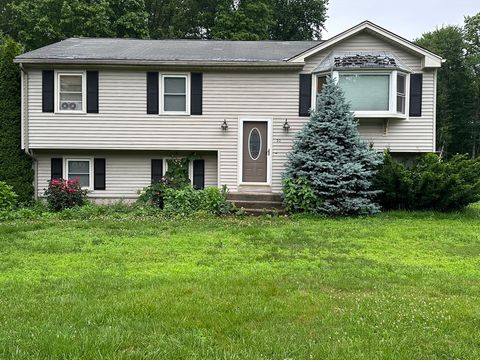
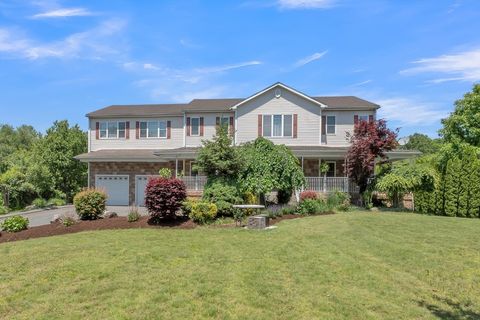
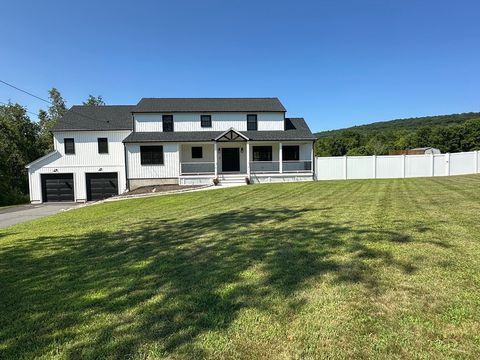
Active
$399,000
3
bds
|
1
ba
|
1,308
sqft
|
built
1969
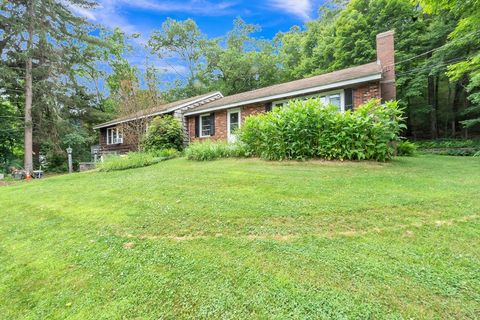
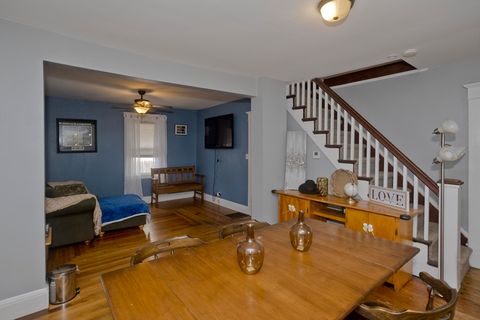
41 Roy St, Ludlow, MA 01056
$-653
Cash flow
-8.5%
Cash-on-Cash Return
3.7%
Cap rate
0.6%
Rent to Value Ratio
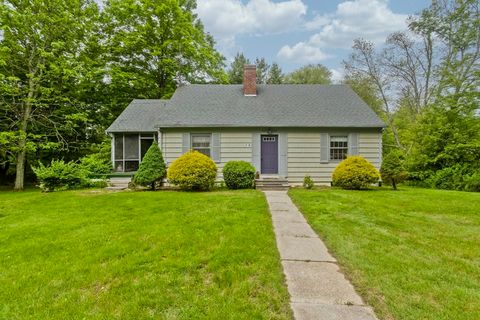
Active
$410,000
4
bds
|
2
ba
|
1,876
sqft
|
built
1958
10 Hillside Dr, Brimfield, MA 01010
$-376
Cash flow
-4.8%
Cash-on-Cash Return
4.6%
Cap rate
0.7%
Rent to Value Ratio
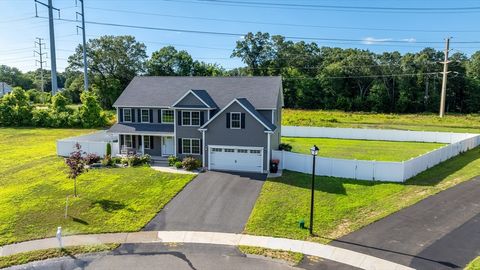
Active
$775,000
4
bds
|
3
ba
|
3,096
sqft
|
built
2022
25 Damato Way, Agawam, MA 01001
$-2,020
Cash flow
-13.6%
Cash-on-Cash Return
2.6%
Cap rate
0.5%
Rent to Value Ratio

Active
$330,000
3
bds
|
1
ba
|
1,024
sqft
|
built
1955
33 S Longyard Rd, Southwick, MA 01077
$-151
Cash flow
-2.4%
Cash-on-Cash Return
5.1%
Cap rate
0.8%
Rent to Value Ratio

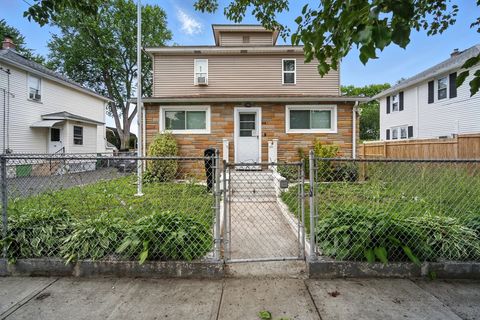
Active
$434,900
10
bds
|
4
ba
|
3,150
sqft
|
built
1904
21 Mountainview St, Springfield, MA 01108
$-674
Cash flow
-8.1%
Cash-on-Cash Return
3.8%
Cap rate
0.5%
Rent to Value Ratio
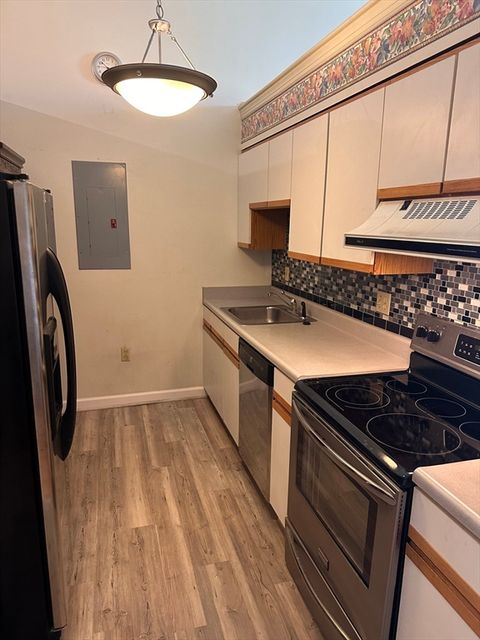
Active
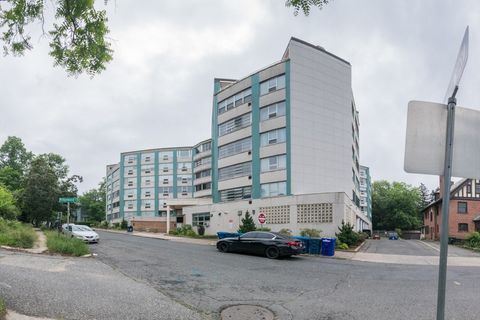
$249,900
1
bds
|
2
ba
|
1,054
sqft
|
built
1899
235 State St, Springfield, MA 01103
$-662
Cash flow
-13.8%
Cash-on-Cash Return
2.5%
Cap rate
0.7%
Rent to Value Ratio
Active
$330,000
3
bds
|
2
ba
|
1,526
sqft
|
built
1929
44 Charpentier Blvd, Chicopee, MA 01013
$-210
Cash flow
-3.3%
Cash-on-Cash Return
4.9%
Cap rate
0.7%
Rent to Value Ratio
Active
$375,000
3
bds
|
3
ba
|
1,418
sqft
|
built
1953
254 Redlands St, Springfield, MA 01104
$-350
Cash flow
-4.9%
Cash-on-Cash Return
4.6%
Cap rate
0.7%
Rent to Value Ratio
Active
$319,900
4
bds
|
2
ba
|
2,256
sqft
|
built
1870
19 Noble Ave, Westfield, MA 01085
$92
Cash flow
1.5%
Cash-on-Cash Return
6.0%
Cap rate
0.9%
Rent to Value Ratio
Active
$895,000
5
bds
|
4
ba
|
3,936
sqft
|
built
2000
285 Lower Hampden Rd, Monson, MA 01057
$-2,624
Cash flow
-15.3%
Cash-on-Cash Return
2.2%
Cap rate
0.4%
Rent to Value Ratio
Active
$289,900
3
bds
|
1
ba
|
1,095
sqft
|
built
1930
13 Granger St, Springfield, MA 01119
$34
Cash flow
0.6%
Cash-on-Cash Return
5.8%
Cap rate
0.9%
Rent to Value Ratio

Active
$308,900
3
bds
|
2
ba
|
1,470
sqft
|
built
1965
161 Columba St, Chicopee, MA 01020
$-97
Cash flow
-1.6%
Cash-on-Cash Return
5.3%
Cap rate
0.8%
Rent to Value Ratio
Active
$319,000
4
bds
|
2
ba
|
1,951
sqft
|
built
1927
88 Biltmore St, Springfield, MA 01108
$-279
Cash flow
-4.6%
Cash-on-Cash Return
4.6%
Cap rate
0.7%
Rent to Value Ratio
Active
$569,999
3
bds
|
3
ba
|
2,840
sqft
|
built
1963
128 Skyline Dr, Westfield, MA 01085
$-1,345
Cash flow
-12.3%
Cash-on-Cash Return
2.8%
Cap rate
0.5%
Rent to Value Ratio
Active
$414,500
2
bds
|
2
ba
|
1,350
sqft
|
built
1982
265 Fox Den Rd, Tolland, MA 01034
$-374
Cash flow
-4.7%
Cash-on-Cash Return
4.6%
Cap rate
0.7%
Rent to Value Ratio
Active
$315,000
3
bds
|
2
ba
|
1,372
sqft
|
built
1919
212 Marsden St, Springfield, MA 01109
$-383
Cash flow
-6.3%
Cash-on-Cash Return
4.2%
Cap rate
0.6%
Rent to Value Ratio
Active
$2,300,000
3
bds
|
4
ba
|
1,456
sqft
|
built
1964
336 Russellville Rd, Westfield, MA 01085
$-8,952
Cash flow
-20.3%
Cash-on-Cash Return
1.0%
Cap rate
0.1%
Rent to Value Ratio
Active
$325,000
3
bds
|
2
ba
|
1,564
sqft
|
built
1910
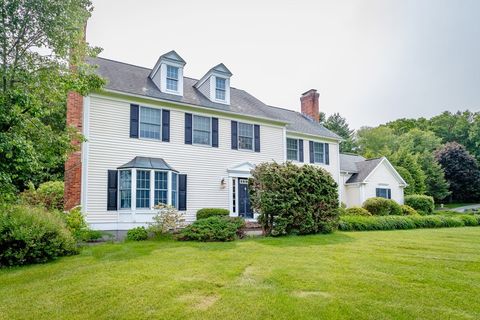
267 Maple St, East Longmeadow, MA 01028
$-14
Cash flow
-0.2%
Cash-on-Cash Return
5.6%
Cap rate
0.9%
Rent to Value Ratio
Active
$499,943
4
bds
|
3
ba
|
1,712
sqft
|
built
2010
31 Acrebrook Rd, Springfield, MA 01129
$-1,086
Cash flow
-11.3%
Cash-on-Cash Return
3.1%
Cap rate
0.5%
Rent to Value Ratio
Active
$249,000
2
bds
|
1
ba
|
938
sqft
|
built
1926
28 Hartley St, Springfield, MA 01104
$1
Cash flow
0.0%
Cash-on-Cash Return
5.7%
Cap rate
0.8%
Rent to Value Ratio
Active
$269,900
3
bds
|
1
ba
|
990
sqft
|
built
1942
270 Cambria St, Springfield, MA 01118
$-31
Cash flow
-0.6%
Cash-on-Cash Return
5.5%
Cap rate
0.9%
Rent to Value Ratio
Active
$799,900
3
bds
|
3
ba
|
2,500
sqft
|
built
2004
1172 East St, Ludlow, MA 01056
$-2,340
Cash flow
-15.3%
Cash-on-Cash Return
2.2%
Cap rate
0.4%
Rent to Value Ratio
Active
$329,950
3
bds
|
2
ba
|
1,865
sqft
|
built
1950
12 Allen St, Chicopee, MA 01020
$-150
Cash flow
-2.4%
Cash-on-Cash Return
5.1%
Cap rate
0.8%
Rent to Value Ratio

Active
$325,000
2
bds
|
1
ba
|
1,008
sqft
|
built
1950
132 Nelson St, West Springfield, MA 01089
$-311
Cash flow
-5.0%
Cash-on-Cash Return
4.5%
Cap rate
0.7%
Rent to Value Ratio
Active
$459,900
8
bds
|
4
ba
|
2,471
sqft
|
built
1906
292-294 Orange St, Springfield, MA 01108
$-797
Cash flow
-9.0%
Cash-on-Cash Return
3.6%
Cap rate
0.5%
Rent to Value Ratio
Active
$375,000
4
bds
|
4
ba
|
1,800
sqft
|
built
1985
82-84 Cherrelyn St, Springfield, MA 01104
$-551
Cash flow
-7.7%
Cash-on-Cash Return
3.9%
Cap rate
0.6%
Rent to Value Ratio
Active
$680,000
4
bds
|
4
ba
|
2,949
sqft
|
built
1993
2 Stirrup Ln, Wilbraham, MA 01095
$-1,783
Cash flow
-13.7%
Cash-on-Cash Return
2.5%
Cap rate
0.5%
Rent to Value Ratio
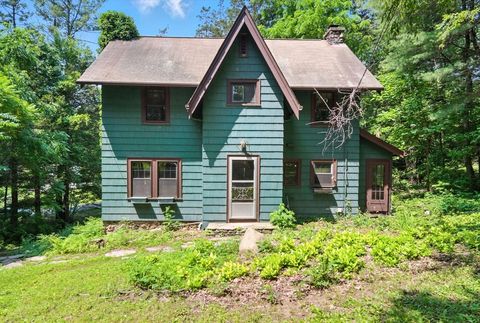
Active
$345,000
3
bds
|
2
ba
|
2,083
sqft
|
built
1849
4063 Main St, Palmer, MA 01069
$-241
Cash flow
-3.6%
Cash-on-Cash Return
4.8%
Cap rate
0.8%
Rent to Value Ratio
Active
$489,900
3
bds
|
3
ba
|
2,918
sqft
|
built
1973
360 Falley Dr, Westfield, MA 01085
$-837
Cash flow
-8.9%
Cash-on-Cash Return
3.6%
Cap rate
0.6%
Rent to Value Ratio
Active
$359,900
5
bds
|
2
ba
|
1,970
sqft
|
built
1903
163 Thompson St, Springfield, MA 01109
$-11
Cash flow
-0.2%
Cash-on-Cash Return
5.6%
Cap rate
0.8%
Rent to Value Ratio
Active
$479,000
4
bds
|
2
ba
|
1,966
sqft
|
built
1962
169 Mountainview Rd, East Longmeadow, MA 01028
$-836
Cash flow
-9.1%
Cash-on-Cash Return
3.6%
Cap rate
0.6%
Rent to Value Ratio
Active
$839,000
6
bds
|
6
ba
|
5,552
sqft
|
built
2000
3128 Boston Rd, Wilbraham, MA 01095
$-2,832
Cash flow
-17.6%
Cash-on-Cash Return
1.6%
Cap rate
0.4%
Rent to Value Ratio
Active
$350,000
4
bds
|
2
ba
|
1,635
sqft
|
built
1950
75 North Rd, Hampden, MA 01036
$-12
Cash flow
-0.2%
Cash-on-Cash Return
5.6%
Cap rate
0.9%
Rent to Value Ratio
Active
$399,900
5
bds
|
3
ba
|
2,523
sqft
|
built
1913
31 Denton Cir, Springfield, MA 01104
$-638
Cash flow
-8.3%
Cash-on-Cash Return
3.8%
Cap rate
0.6%
Rent to Value Ratio
Active
$355,000
4
bds
|
2
ba
|
1,810
sqft
|
built
1930
1168 River Rd, Agawam, MA 01001
$-185
Cash flow
-2.7%
Cash-on-Cash Return
5.1%
Cap rate
0.8%
Rent to Value Ratio
Active
$299,900
4
bds
|
2
ba
|
1,748
sqft
|
built
1900
97 Lombard St, Chicopee, MA 01020
$-292
Cash flow
-5.1%
Cash-on-Cash Return
4.5%
Cap rate
0.7%
Rent to Value Ratio
Active
$699,999
4
bds
|
4
ba
|
3,292
sqft
|
built
2002
56 Margaret St, Monson, MA 01057
$-1,879
Cash flow
-14.0%
Cash-on-Cash Return
2.5%
Cap rate
0.4%
Rent to Value Ratio