Plymouth County Investment Properties for Sale
Browse homes for sale and investment properties in Plymouth County. Refine your search by price, property type, or more.
Best cash flowing properties in Plymouth County
Active
$294,500
3
bds
|
1
ba
|
905
sqft
|
built
1906
67 Sycamore Ave, Brockton, MA 02301
$122
Cash flow
2.2%
Cash-on-Cash Return
6.2%
Cap rate
0.8%
Rent to Value Ratio
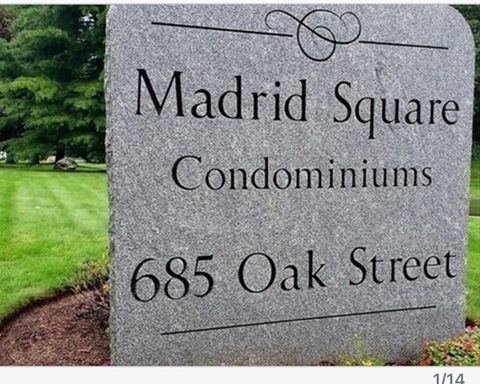
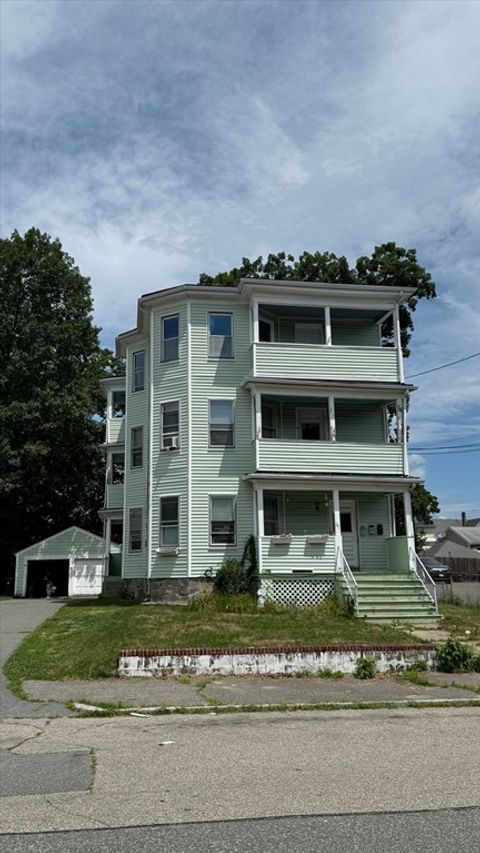
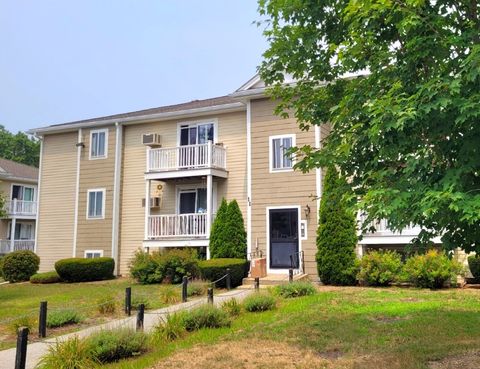
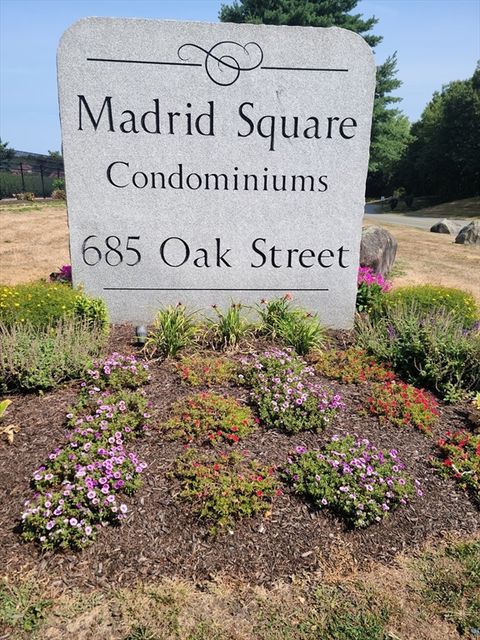
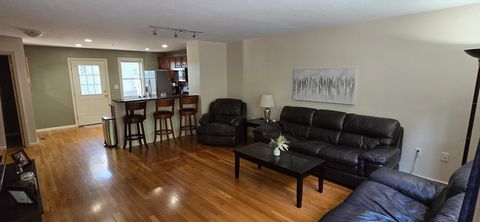
Active
$289,900
2
bds
|
2
ba
|
1,108
sqft
|
built
1985
685 Oak St, Brockton, MA 02301
$94
Cash flow
1.7%
Cash-on-Cash Return
6.1%
Cap rate
0.9%
Rent to Value Ratio
33 out of 107 properties for sale in Plymouth County
Limited Results Shown
Create a free account, or log in to reveal all property listings and enjoy the complete experience.
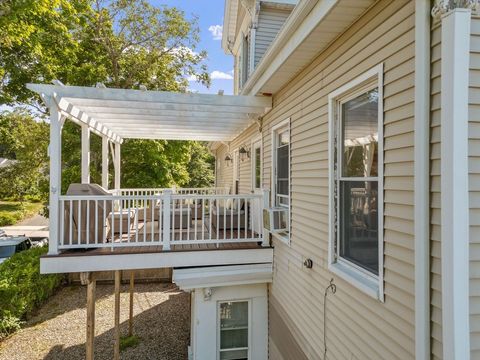
Active
$365,000
2
bds
|
2
ba
|
1,206
sqft
|
built
1986
161 Winter St, Hanson, MA 02341
$-978
Cash flow
-14.0%
Cash-on-Cash Return
2.5%
Cap rate
0.6%
Rent to Value Ratio
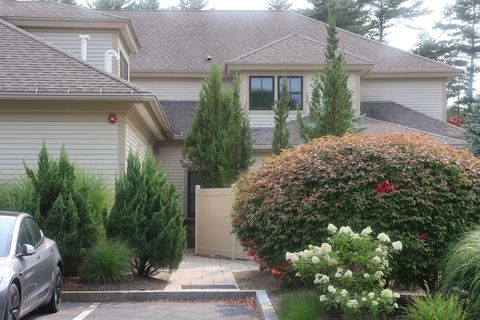
Active
$220,000
1
bds
|
1
ba
|
785
sqft
|
built
1970
17 Chapel Hill Dr, Plymouth, MA 02360
$-379
Cash flow
-9.0%
Cash-on-Cash Return
3.6%
Cap rate
0.9%
Rent to Value Ratio
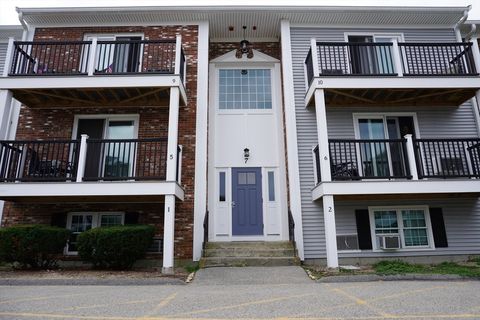
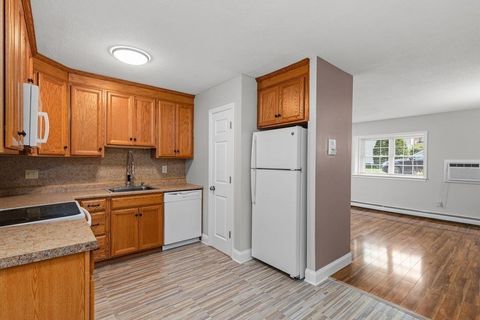
Active
$298,000
2
bds
|
1
ba
|
895
sqft
|
built
1970
7 Chapel Hill Dr, Plymouth, MA 02360
$-690
Cash flow
-12.1%
Cash-on-Cash Return
2.9%
Cap rate
0.8%
Rent to Value Ratio
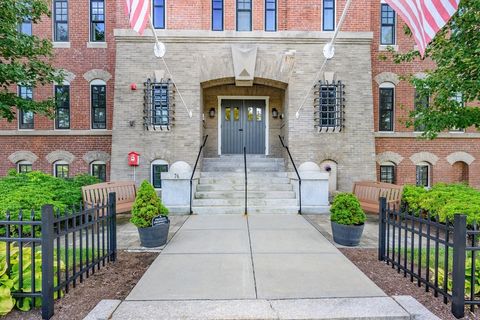
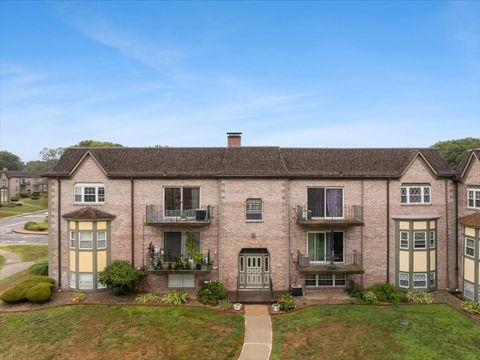
Active
$694,900
2
bds
|
2
ba
|
1,255
sqft
|
built
1906
76 Court St, Plymouth, MA 02360
$-2,233
Cash flow
-16.8%
Cash-on-Cash Return
1.8%
Cap rate
0.5%
Rent to Value Ratio
Active
$995,000
2
bds
|
2
ba
|
1,855
sqft
|
built
1988
15 Caswell Ln, Plymouth, MA 02360
$-3,787
Cash flow
-19.9%
Cash-on-Cash Return
1.1%
Cap rate
0.4%
Rent to Value Ratio
Active
$825,000
3
bds
|
2
ba
|
2,632
sqft
|
built
2003
15 Park Ave, Hull, MA 02045
$-2,771
Cash flow
-17.5%
Cash-on-Cash Return
1.6%
Cap rate
0.5%
Rent to Value Ratio
Active
$309,900
2
bds
|
2
ba
|
858
sqft
|
built
1900
147 Centre St, Brockton, MA 02302
$-523
Cash flow
-8.8%
Cash-on-Cash Return
3.7%
Cap rate
0.8%
Rent to Value Ratio
Active
$289,000
2
bds
|
1
ba
|
923
sqft
|
built
1973
451 School St, Marshfield, MA 02050
$-173
Cash flow
-3.1%
Cash-on-Cash Return
5.0%
Cap rate
0.9%
Rent to Value Ratio
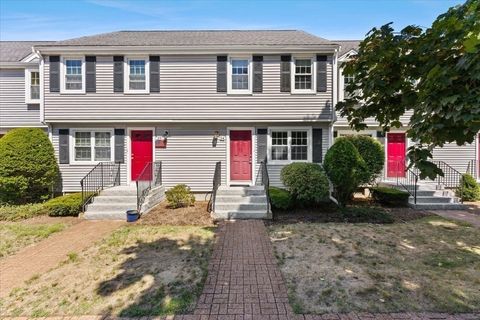
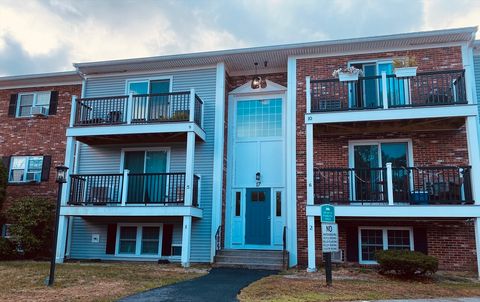
Active
$298,000
2
bds
|
2
ba
|
1,156
sqft
|
built
1985
685 Oak St, Brockton, MA 02301
$-470
Cash flow
-8.2%
Cash-on-Cash Return
3.8%
Cap rate
0.9%
Rent to Value Ratio
Active
$429,000
2
bds
|
2
ba
|
1,116
sqft
|
built
2004
604 Bedford St, Whitman, MA 02382
$-781
Cash flow
-9.5%
Cash-on-Cash Return
3.5%
Cap rate
0.7%
Rent to Value Ratio
Active
$389,900
1
bds
|
1
ba
|
451
sqft
|
built
1900
13 Whiting St, Plymouth, MA 02360
$-1,301
Cash flow
-17.4%
Cash-on-Cash Return
1.7%
Cap rate
0.5%
Rent to Value Ratio
Active
$389,000
1
bds
|
1
ba
|
988
sqft
|
built
2016
599 Washington St, Pembroke, MA 02359
$-828
Cash flow
-11.1%
Cash-on-Cash Return
3.1%
Cap rate
0.6%
Rent to Value Ratio
Active
$294,900
2
bds
|
1
ba
|
895
sqft
|
built
1970
9 Chapel Hill Dr, Plymouth, MA 02360
$-611
Cash flow
-10.8%
Cash-on-Cash Return
3.2%
Cap rate
0.8%
Rent to Value Ratio
Active
$285,000
2
bds
|
1
ba
|
890
sqft
|
built
1981
104 Oak Ln, Brockton, MA 02301
$-632
Cash flow
-11.6%
Cash-on-Cash Return
3.0%
Cap rate
0.8%
Rent to Value Ratio
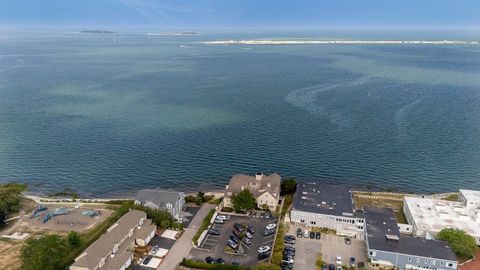
Active
$550,000
1
bds
|
2
ba
|
884
sqft
|
built
2016
7 Sever St, Plymouth, MA 02360
$-1,452
Cash flow
-13.8%
Cash-on-Cash Return
2.5%
Cap rate
0.5%
Rent to Value Ratio
Active
$279,900
2
bds
|
1
ba
|
890
sqft
|
built
1981
116 Oak Ln, Brockton, MA 02301
$-599
Cash flow
-11.2%
Cash-on-Cash Return
3.1%
Cap rate
0.8%
Rent to Value Ratio
Active
$259,900
2
bds
|
1
ba
|
890
sqft
|
built
1981
114 Oak Ln, Brockton, MA 02301
$-435
Cash flow
-8.7%
Cash-on-Cash Return
3.7%
Cap rate
0.9%
Rent to Value Ratio
Active
$315,000
1
bds
|
1
ba
|
787
sqft
|
built
1984
842 Nantasket Ave, Hull, MA 02045
$-34
Cash flow
-0.6%
Cash-on-Cash Return
5.6%
Cap rate
0.8%
Rent to Value Ratio
Active
$669,000
2
bds
|
2
ba
|
1,521
sqft
|
built
1906
76 Court St, Plymouth, MA 02360
$-2,052
Cash flow
-16.0%
Cash-on-Cash Return
2.0%
Cap rate
0.5%
Rent to Value Ratio
Active
$249,900
2
bds
|
1
ba
|
969
sqft
|
built
1970
180 Main St, Bridgewater, MA 02324
$-394
Cash flow
-8.2%
Cash-on-Cash Return
3.8%
Cap rate
0.9%
Rent to Value Ratio
Active
$459,900
2
bds
|
1
ba
|
1,042
sqft
|
built
1900
45 Main St, Wareham, MA 02571
$-1,573
Cash flow
-17.8%
Cash-on-Cash Return
1.6%
Cap rate
0.5%
Rent to Value Ratio
Active
$399,900
2
bds
|
2
ba
|
1,125
sqft
|
built
1985
1181 Nantasket Ave, Hull, MA 02045
$-922
Cash flow
-12.0%
Cash-on-Cash Return
2.9%
Cap rate
0.7%
Rent to Value Ratio

Active
$1,175,000
2
bds
|
3
ba
|
1,606
sqft
|
built
2018
10 Shipyard Dr, Hingham, MA 02043
$-3,196
Cash flow
-14.2%
Cash-on-Cash Return
2.4%
Cap rate
0.5%
Rent to Value Ratio
Active
$429,000
3
bds
|
2
ba
|
988
sqft
|
built
1966
24 Summer St, Kingston, MA 02364
$-484
Cash flow
-5.9%
Cash-on-Cash Return
4.3%
Cap rate
0.7%
Rent to Value Ratio
Active
$245,000
2
bds
|
1
ba
|
848
sqft
|
built
1972
135 Grove St, Rockland, MA 02370
$-607
Cash flow
-12.9%
Cash-on-Cash Return
2.7%
Cap rate
0.9%
Rent to Value Ratio
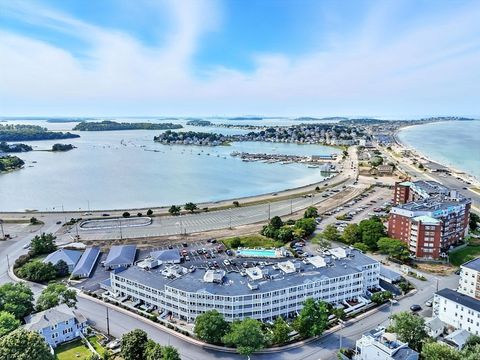
Active
$799,000
2
bds
|
3
ba
|
1,906
sqft
|
built
2002
6 State Park Rd, Hull, MA 02045
$-2,539
Cash flow
-16.6%
Cash-on-Cash Return
1.9%
Cap rate
0.5%
Rent to Value Ratio

Active
$329,900
2
bds
|
2
ba
|
1,093
sqft
|
built
2004
147 Centre St, Brockton, MA 02302
$-659
Cash flow
-10.4%
Cash-on-Cash Return
3.3%
Cap rate
0.8%
Rent to Value Ratio

Active
$469,900
2
bds
|
2
ba
|
1,326
sqft
|
built
1994
42 Trout Farm Ln, Duxbury, MA 02332
$-815
Cash flow
-9.0%
Cash-on-Cash Return
3.6%
Cap rate
0.7%
Rent to Value Ratio

Active
$315,000
2
bds
|
2
ba
|
898
sqft
|
built
1986
2 Marc Dr, Plymouth, MA 02360
$-686
Cash flow
-11.4%
Cash-on-Cash Return
3.1%
Cap rate
0.7%
Rent to Value Ratio
Active
$850,000
3
bds
|
3
ba
|
1,925
sqft
|
built
2019
7 Bay St, Hull, MA 02045
$-2,674
Cash flow
-16.4%
Cash-on-Cash Return
1.9%
Cap rate
0.5%
Rent to Value Ratio

Active
$595,000
2
bds
|
2
ba
|
1,643
sqft
|
built
2000
4 Highland Ter, Plymouth, MA 02360
$-1,813
Cash flow
-15.9%
Cash-on-Cash Return
2.0%
Cap rate
0.6%
Rent to Value Ratio