Miami Beach, FL Investment Properties for Sale
Browse homes for sale and investment properties in Miami Beach, FL. Refine your search by price, property type, or more.
Best cash flowing properties in Miami Beach, FL
Active
$350,000
2
bds
|
2
ba
|
1,011
sqft
|
built
1986
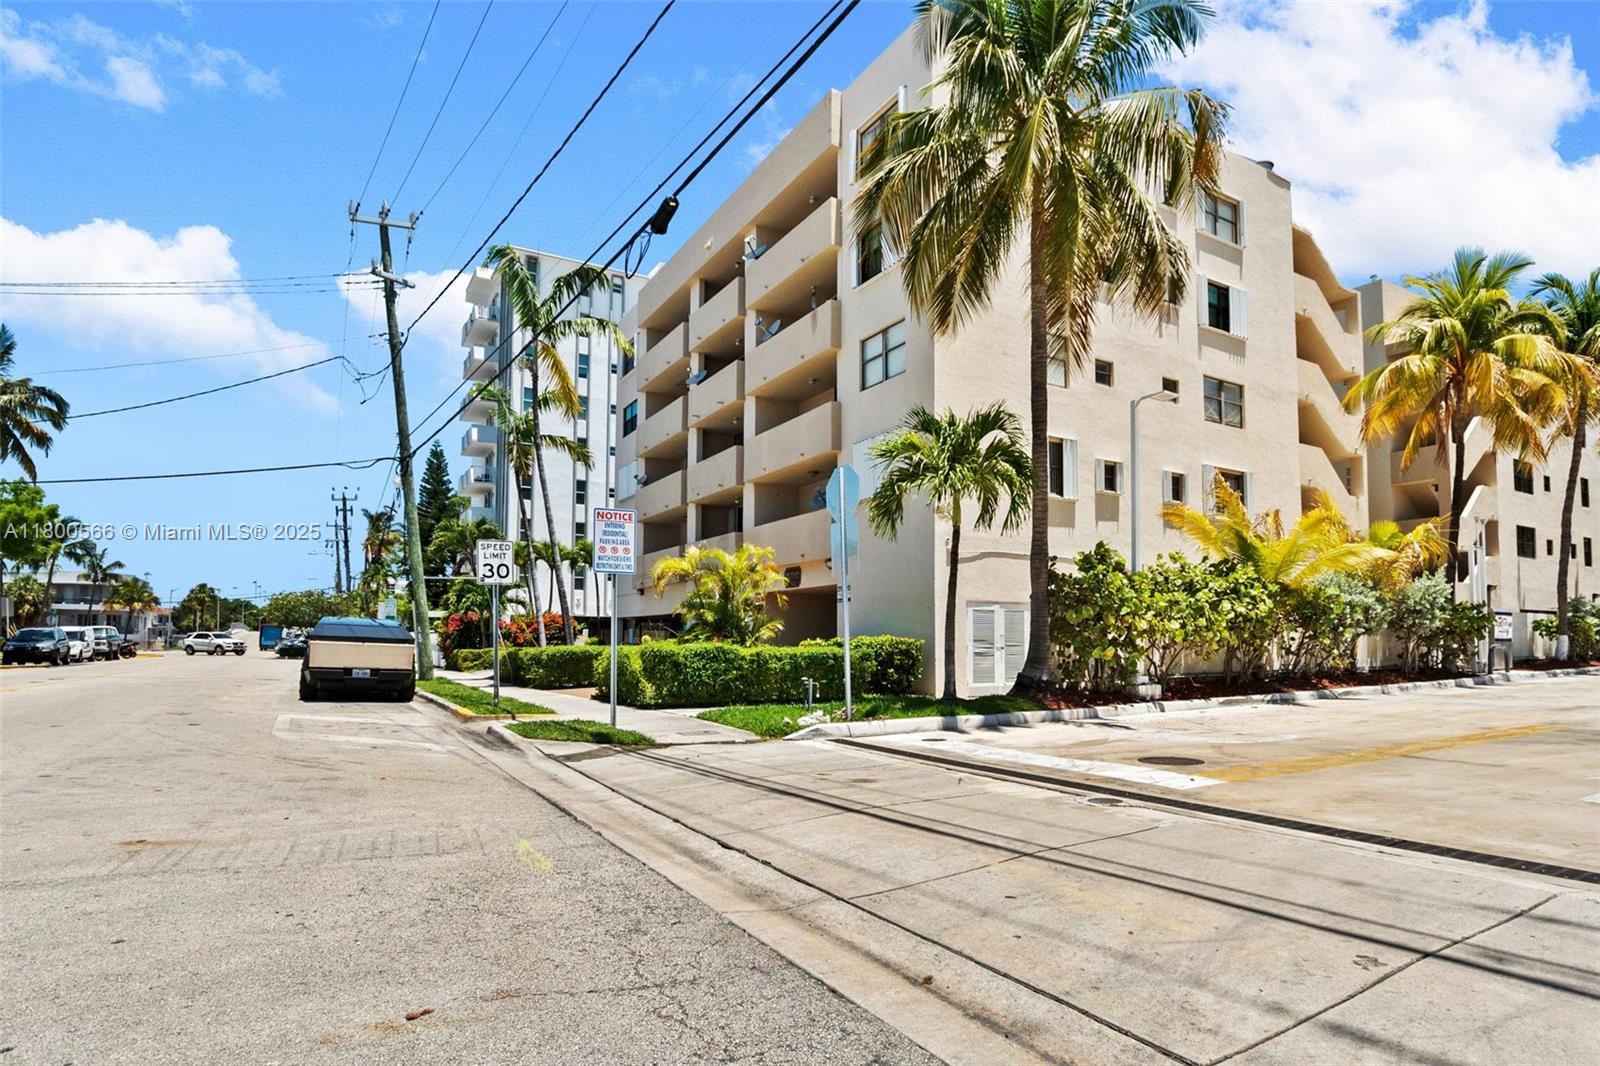
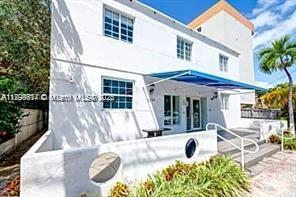
7125 Bay Dr, Miami Beach, FL 33141
$-134
Cash flow
-2.0%
Cash-on-Cash Return
5.7%
Cap rate
0.9%
Rent to Value Ratio
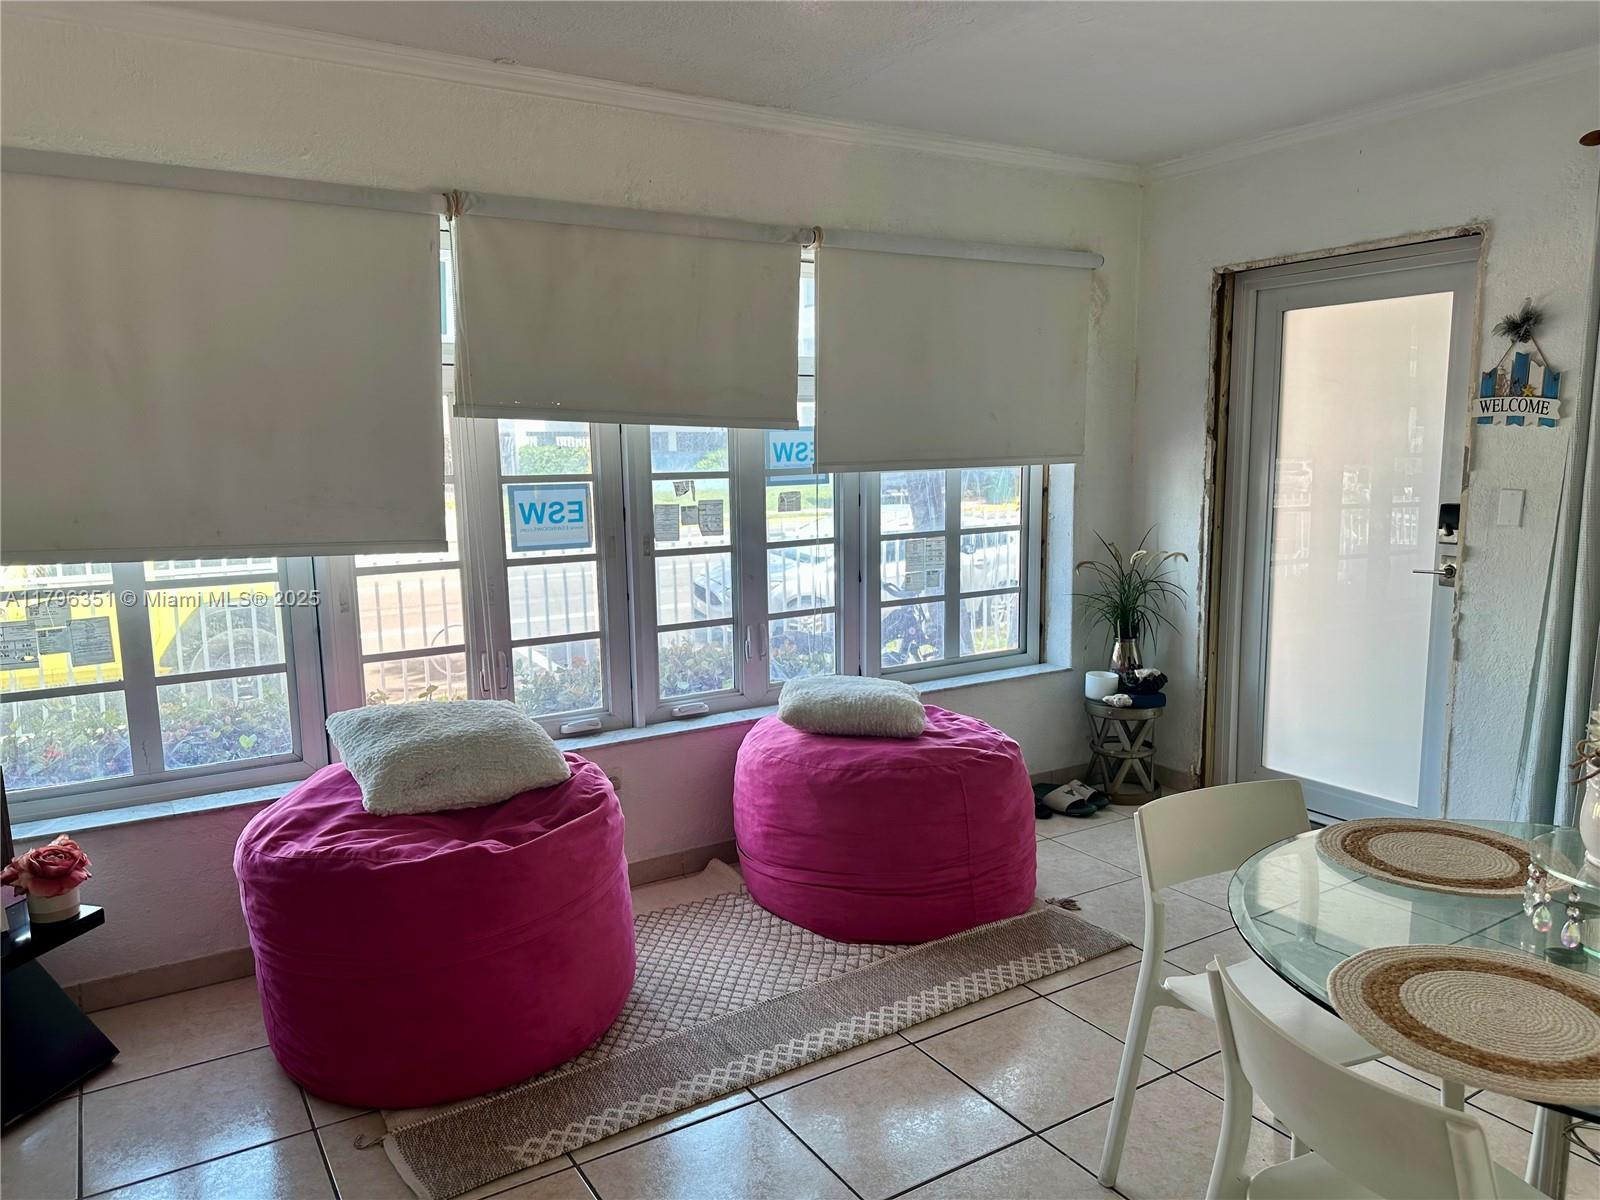
Active
$185,000
bds
|
1
ba
|
400
sqft
|
built
1957
635 8th St, Miami Beach, FL 33139
$-435
Cash flow
-12.3%
Cash-on-Cash Return
3.3%
Cap rate
1.0%
Rent to Value Ratio
1,950 out of 2,150 properties for sale in Miami Beach, FL
Limited Results Shown
Create a free account, or log in to reveal all property listings and enjoy the complete experience.
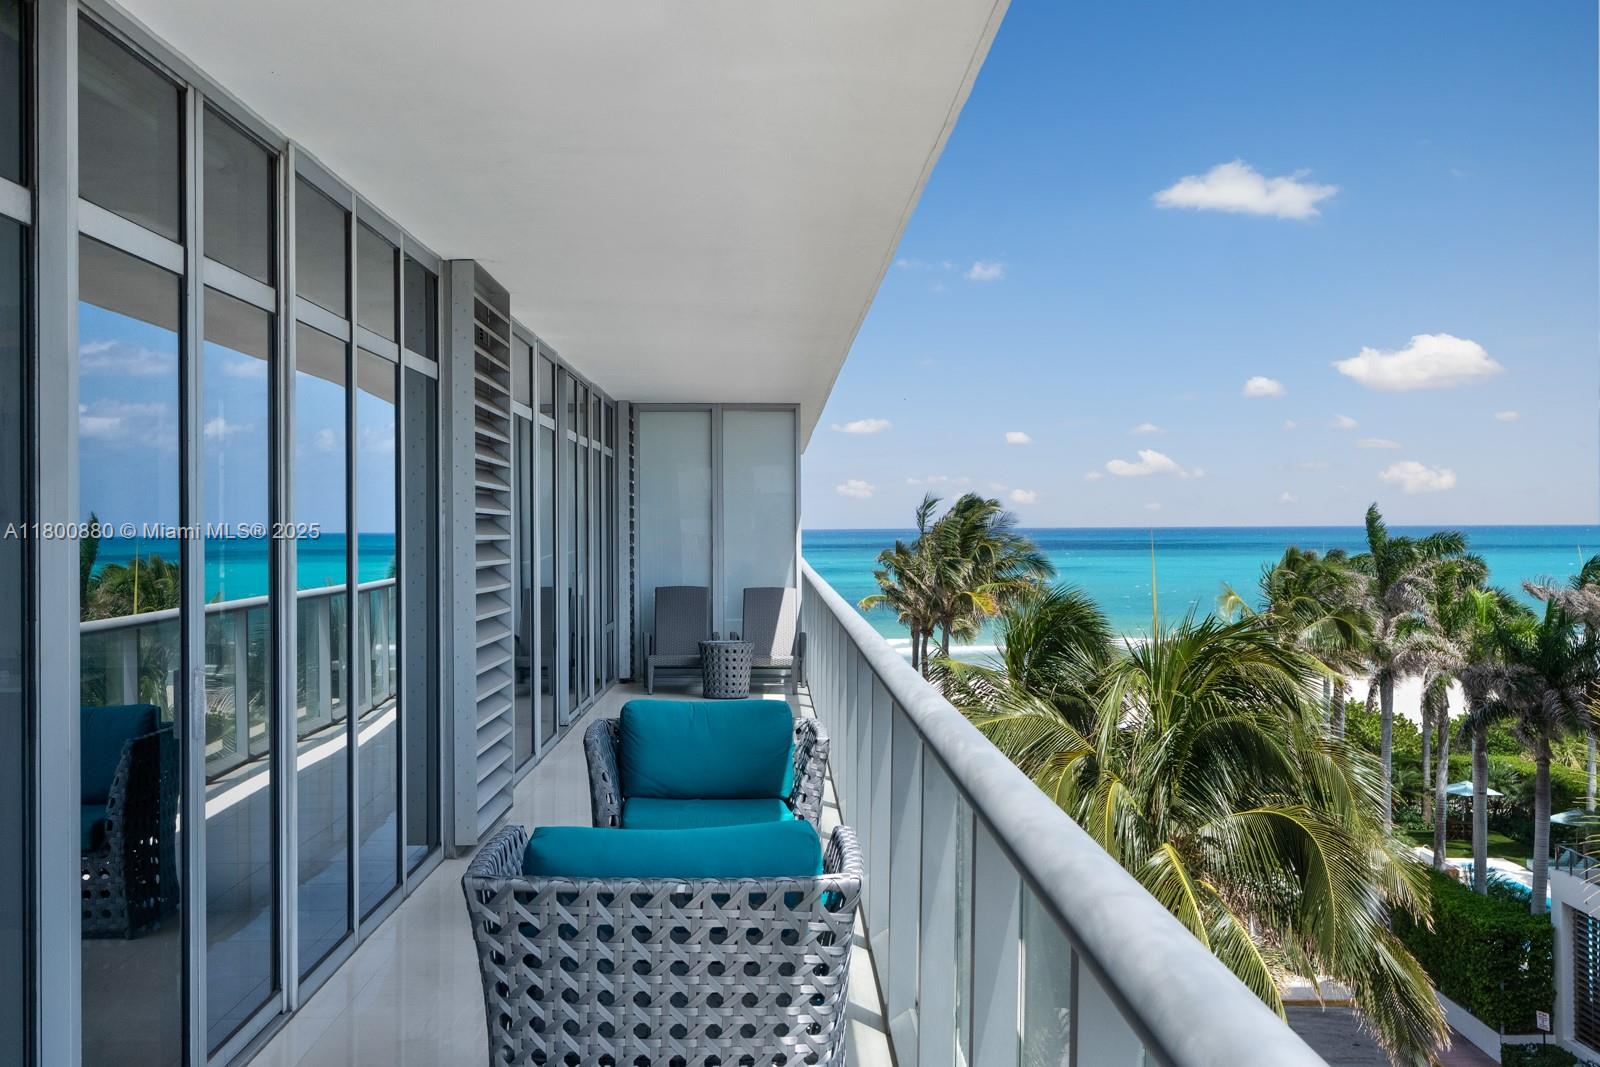
Active
$499,000
2
bds
|
2
ba
|
980
sqft
|
built
1967
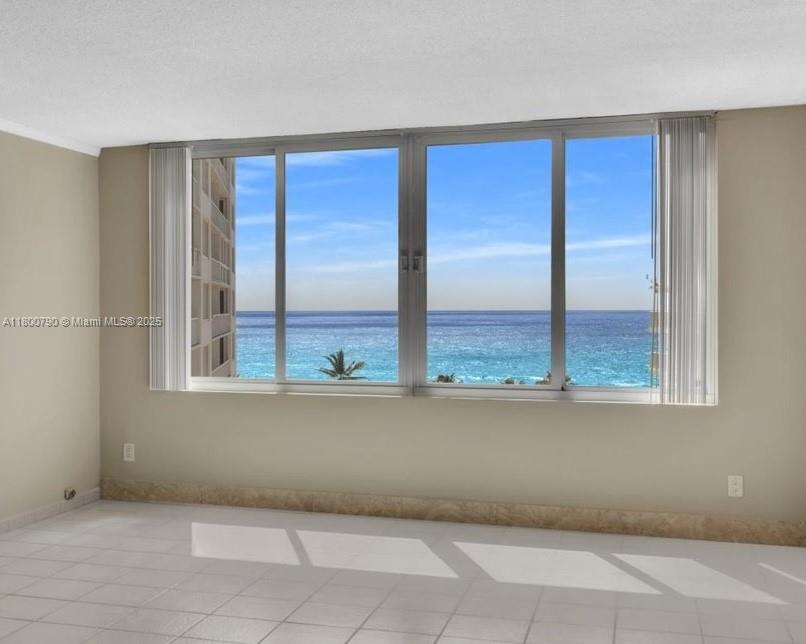
5401 Collins Ave, Miami Beach, FL 33140
$-2,093
Cash flow
-21.9%
Cash-on-Cash Return
1.1%
Cap rate
0.7%
Rent to Value Ratio

Active
$369,900
1
bds
|
1
ba
|
744
sqft
|
built
1940
1605 Lenox Ave, Miami Beach, FL 33139
$-1,052
Cash flow
-14.8%
Cash-on-Cash Return
2.7%
Cap rate
0.6%
Rent to Value Ratio
Active
$720,000
2
bds
|
2
ba
|
1,061
sqft
|
built
1960
1500 Bay Rd, Miami Beach, FL 33139
$-3,590
Cash flow
-26.0%
Cash-on-Cash Return
0.2%
Cap rate
0.5%
Rent to Value Ratio
Active
$30,900,000
6
bds
|
9
ba
|
0
sqft
|
built
2016
440 S Hibiscus Dr, Miami Beach, FL 33139
$-172,019
Cash flow
-29.0%
Cash-on-Cash Return
-0.5%
Cap rate
0.0%
Rent to Value Ratio

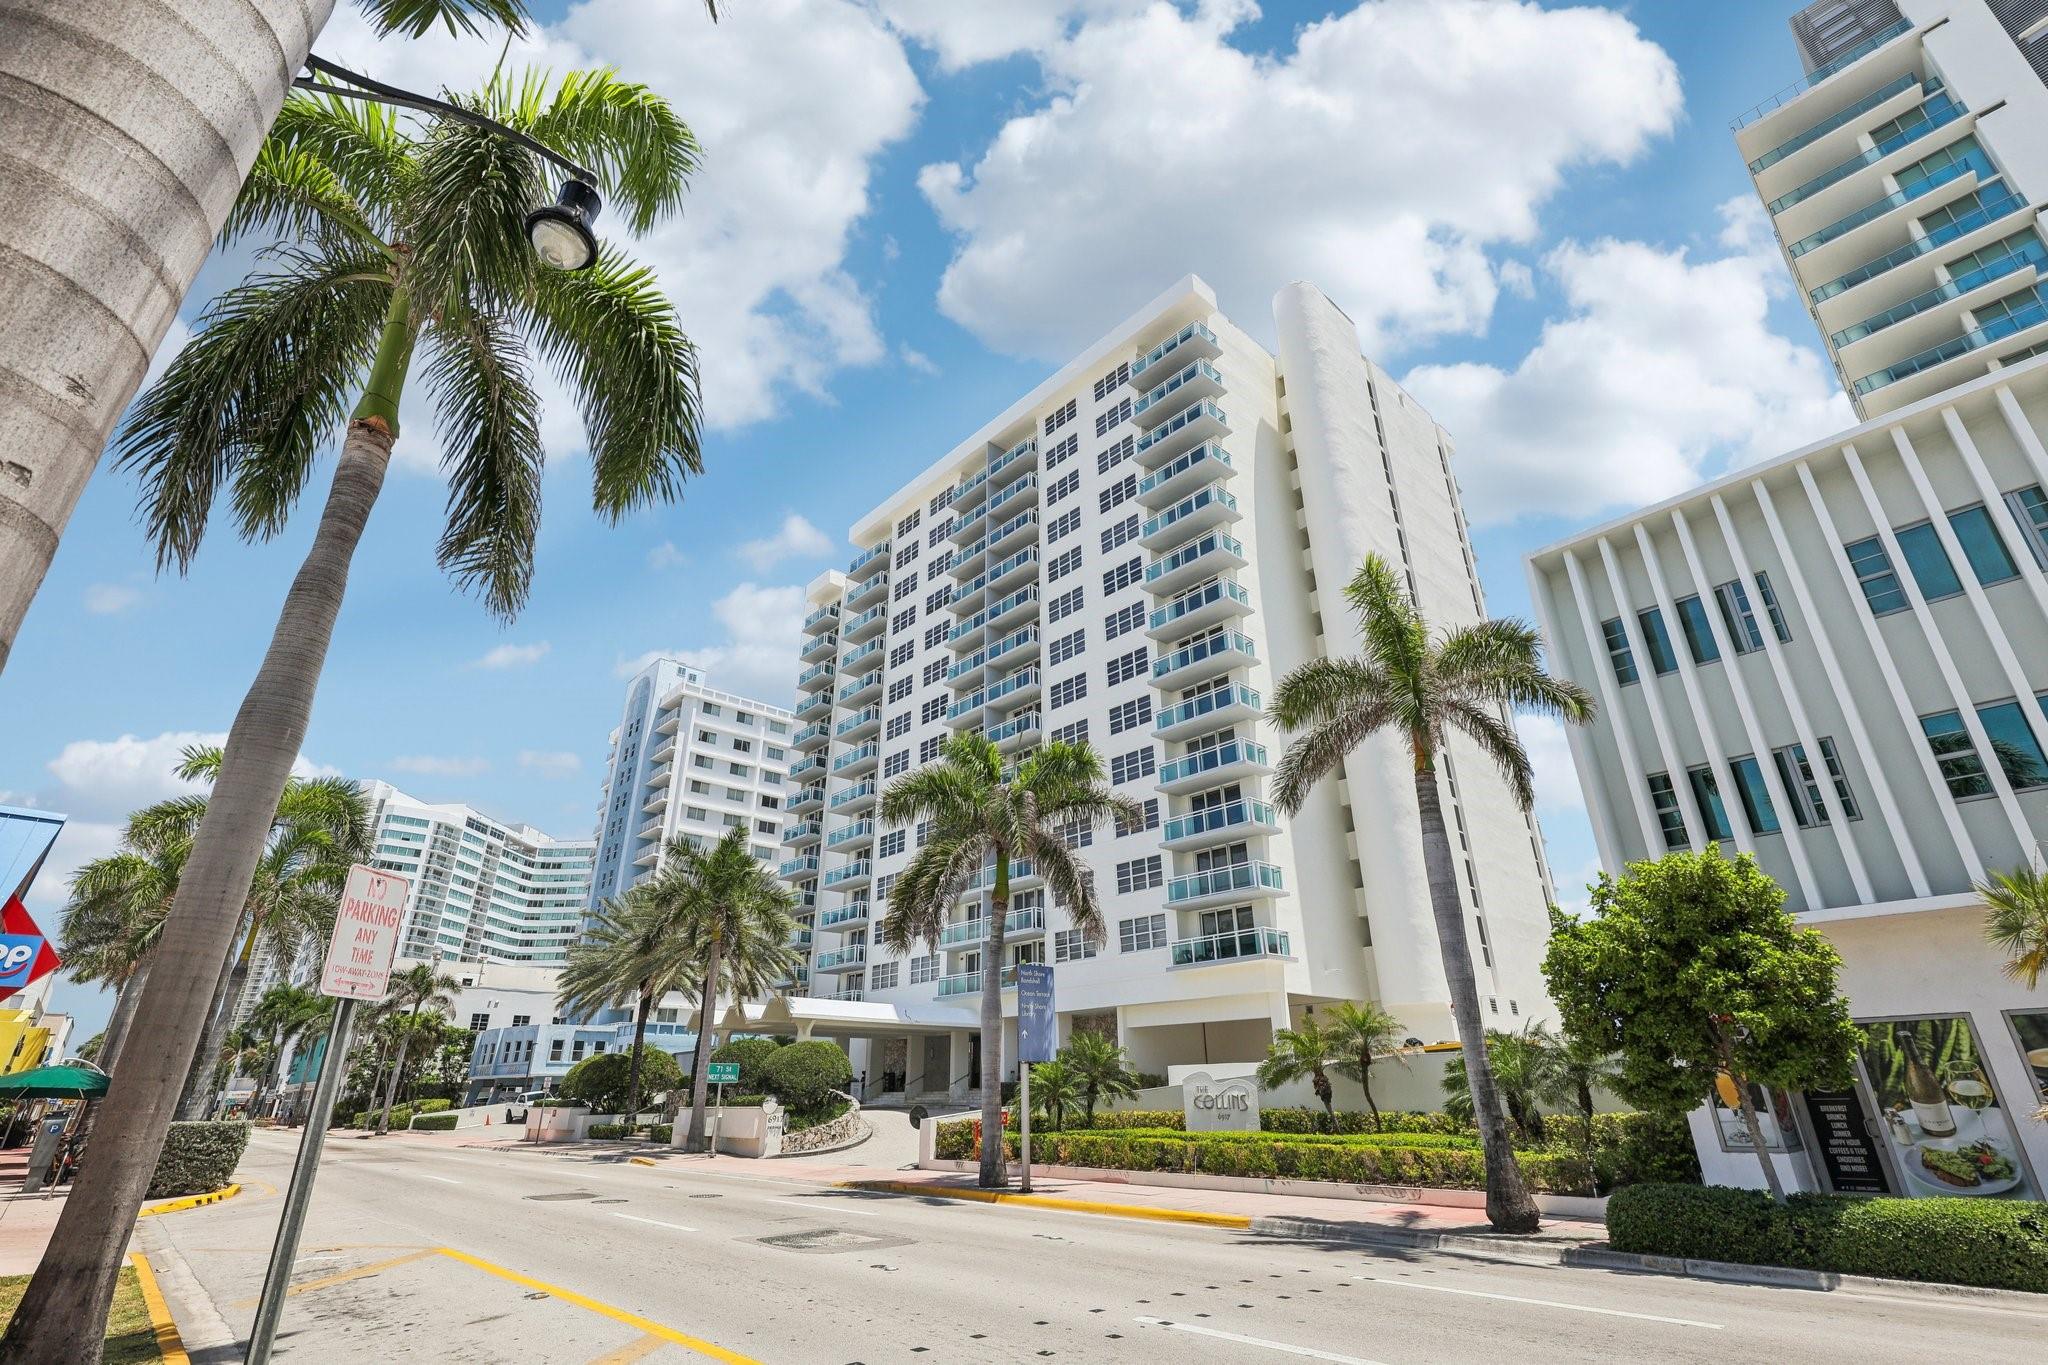
Active
$515,000
2
bds
|
2
ba
|
1,030
sqft
|
built
1968
5700 Collins Ave, Miami Beach, FL 33140
$-2,065
Cash flow
-20.9%
Cash-on-Cash Return
1.3%
Cap rate
0.7%
Rent to Value Ratio
Active
$12,200,000
5
bds
|
6
ba
|
3,981
sqft
|
built
1938
1001 N Venetian Dr, Miami Beach, FL 33139
$-67,647
Cash flow
-28.9%
Cash-on-Cash Return
-0.5%
Cap rate
0.1%
Rent to Value Ratio
Active
$350,000
2
bds
|
2
ba
|
1,011
sqft
|
built
1986
7125 Bay Dr, Miami Beach, FL 33141
$-134
Cash flow
-2.0%
Cash-on-Cash Return
5.7%
Cap rate
0.9%
Rent to Value Ratio
Active
$799,000
1
bds
|
2
ba
|
819
sqft
|
built
2004
6515 Collins Ave, Miami Beach, FL 33141
$-3,319
Cash flow
-21.7%
Cash-on-Cash Return
1.2%
Cap rate
0.6%
Rent to Value Ratio
Active
$950,000
2
bds
|
2
ba
|
1,190
sqft
|
built
1965
100 Lincoln Rd, Miami Beach, FL 33139
$-3,772
Cash flow
-20.7%
Cash-on-Cash Return
1.4%
Cap rate
0.5%
Rent to Value Ratio

Active
$365,000
1
bds
|
1
ba
|
630
sqft
|
built
1970
301 Jefferson Ave, Miami Beach, FL 33139
$-1,326
Cash flow
-19.0%
Cash-on-Cash Return
1.8%
Cap rate
0.6%
Rent to Value Ratio
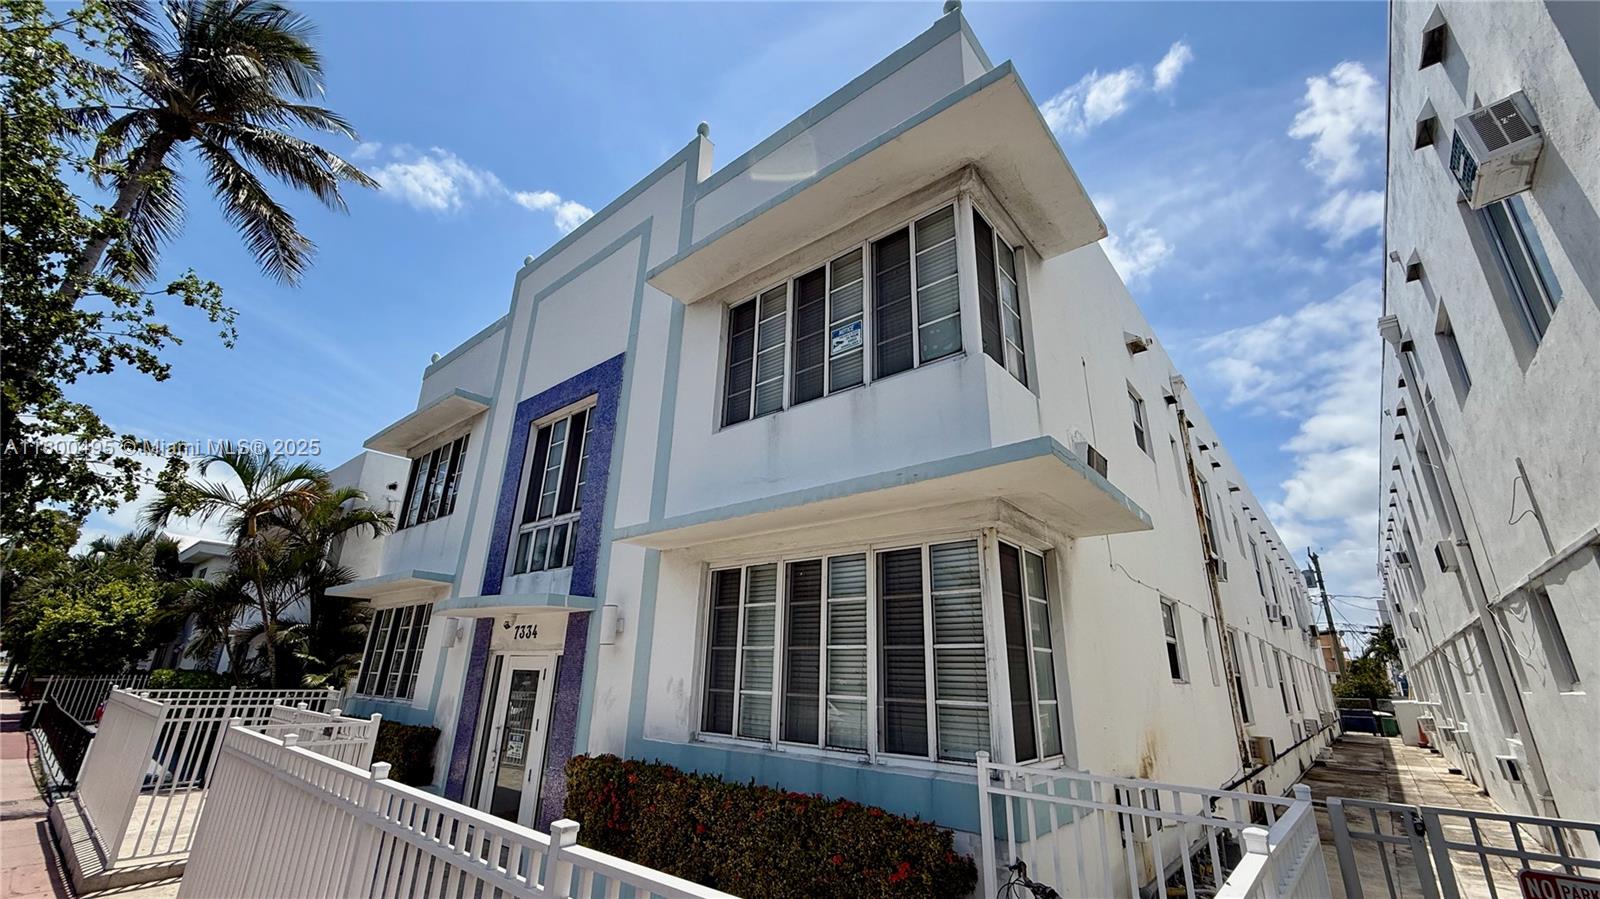
Active
$349,000
1
bds
|
1
ba
|
592
sqft
|
built
1947
7334 Harding Ave, Miami Beach, FL 33141
$-1,353
Cash flow
-20.2%
Cash-on-Cash Return
1.5%
Cap rate
0.5%
Rent to Value Ratio
Active
$2,895,000
2
bds
|
3
ba
|
1,621
sqft
|
built
2008
3737 Collins Ave, Miami Beach, FL 33140
$-16,320
Cash flow
-29.4%
Cash-on-Cash Return
-0.6%
Cap rate
0.3%
Rent to Value Ratio
Active
$498,000
1
bds
|
2
ba
|
817
sqft
|
built
1969
6917 Collins Ave, Miami Beach, FL 33141
$-1,798
Cash flow
-18.8%
Cash-on-Cash Return
1.8%
Cap rate
0.6%
Rent to Value Ratio

Active
$485,000
2
bds
|
2
ba
|
880
sqft
|
built
1925
1614 Pennsylvania Ave, Miami Beach, FL 33139
$-1,830
Cash flow
-19.7%
Cash-on-Cash Return
1.6%
Cap rate
0.6%
Rent to Value Ratio

Active
$365,000
1
bds
|
2
ba
|
734
sqft
|
built
1936
435 21st St, Miami Beach, FL 33139
$-1,607
Cash flow
-23.0%
Cash-on-Cash Return
0.9%
Cap rate
0.8%
Rent to Value Ratio

Active
$625,000
2
bds
|
2
ba
|
1,326
sqft
|
built
1968
6770 Indian Creek Dr, Miami Beach, FL 33141
$-2,474
Cash flow
-20.7%
Cash-on-Cash Return
1.4%
Cap rate
0.6%
Rent to Value Ratio

Active
$400,000
1
bds
|
1
ba
|
585
sqft
|
built
1969
363 Washington Ave, Miami Beach, FL 33139
$-1,207
Cash flow
-15.7%
Cash-on-Cash Return
2.5%
Cap rate
0.6%
Rent to Value Ratio
Active
$220,000
1
bds
|
1
ba
|
563
sqft
|
built
1949
7435 Harding Ave, Miami Beach, FL 33141
$-696
Cash flow
-16.5%
Cash-on-Cash Return
2.4%
Cap rate
0.8%
Rent to Value Ratio

Active
$370,000
1
bds
|
1
ba
|
428
sqft
|
built
2019
6080 Collins Ave, Miami Beach, FL 33140
$-1,192
Cash flow
-16.8%
Cash-on-Cash Return
2.3%
Cap rate
0.9%
Rent to Value Ratio

Active
$350,000
0
bds
|
1
ba
|
350
sqft
|
built
1937
530 Ocean Dr, Miami Beach, FL 33139
$-1,056
Cash flow
-15.7%
Cash-on-Cash Return
2.5%
Cap rate
0.6%
Rent to Value Ratio
Active
$2,995,000
4
bds
|
3
ba
|
2,404
sqft
|
built
1955
4275 Prairie Ave, Miami Beach, FL 33140
$-9,752
Cash flow
-17.0%
Cash-on-Cash Return
2.2%
Cap rate
0.3%
Rent to Value Ratio

Active
$1,775,000
2
bds
|
2
ba
|
1,387
sqft
|
built
2008
6799 Collins Ave, Miami Beach, FL 33141
$-9,576
Cash flow
-28.1%
Cash-on-Cash Return
-0.3%
Cap rate
0.5%
Rent to Value Ratio
Active
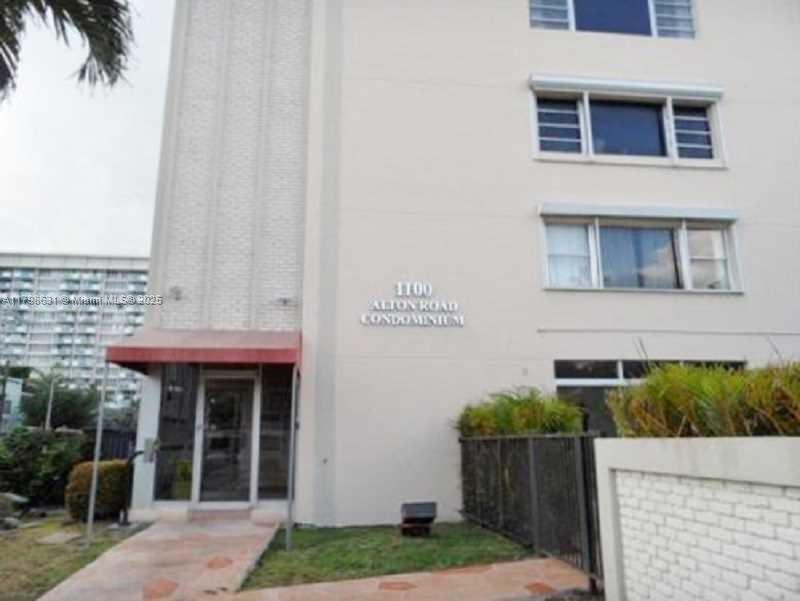
$270,000
1
bds
|
1
ba
|
680
sqft
|
built
1965
1100 Alton Rd, Miami Beach, FL 33139
$-895
Cash flow
-17.3%
Cash-on-Cash Return
2.2%
Cap rate
0.7%
Rent to Value Ratio

Active
$518,000
2
bds
|
2
ba
|
995
sqft
|
built
1979
1840 Jefferson Ave, Miami Beach, FL 33139
$-1,434
Cash flow
-14.4%
Cash-on-Cash Return
2.8%
Cap rate
0.7%
Rent to Value Ratio
Active
$365,000
1
bds
|
1
ba
|
852
sqft
|
built
1968
1000 West Ave, Miami Beach, FL 33139
$-1,146
Cash flow
-16.4%
Cash-on-Cash Return
2.4%
Cap rate
0.8%
Rent to Value Ratio
Active
$1,750,000
2
bds
|
3
ba
|
1,733
sqft
|
built
1972
11 Island Ave, Miami Beach, FL 33139
$-7,092
Cash flow
-21.1%
Cash-on-Cash Return
1.3%
Cap rate
0.4%
Rent to Value Ratio
Active
$230,000
bds
|
1
ba
|
432
sqft
|
built
1940
7734 Abbott Ave, Miami Beach, FL 33141
$-749
Cash flow
-17.0%
Cash-on-Cash Return
2.2%
Cap rate
0.7%
Rent to Value Ratio
Active
$1,950,000
2
bds
|
2
ba
|
1,392
sqft
|
built
2004
6365 Collins Ave, Miami Beach, FL 33141
$-8,773
Cash flow
-23.5%
Cash-on-Cash Return
0.7%
Cap rate
0.4%
Rent to Value Ratio
Active
$699,000
1
bds
|
1
ba
|
952
sqft
|
built
1969
6917 Collins Ave, Miami Beach, FL 33141
$-2,480
Cash flow
-18.5%
Cash-on-Cash Return
1.9%
Cap rate
0.6%
Rent to Value Ratio
Active
$185,000
bds
|
1
ba
|
400
sqft
|
built
1957
635 8th St, Miami Beach, FL 33139
$-435
Cash flow
-12.3%
Cash-on-Cash Return
3.3%
Cap rate
1.0%
Rent to Value Ratio
Active
$435,000
0
bds
|
1
ba
|
493
sqft
|
built
2008
1100 West Ave, Miami Beach, FL 33139
$-1,550
Cash flow
-18.6%
Cash-on-Cash Return
1.9%
Cap rate
0.9%
Rent to Value Ratio

Active
$1,790,000
3
bds
|
3
ba
|
2,388
sqft
|
built
1981
9 Island Ave, Miami Beach, FL 33139
$-7,351
Cash flow
-21.4%
Cash-on-Cash Return
1.2%
Cap rate
0.6%
Rent to Value Ratio
Active
$345,000
0
bds
|
1
ba
|
530
sqft
|
built
2008
1100 West Ave, Miami Beach, FL 33139
$-1,474
Cash flow
-22.3%
Cash-on-Cash Return
1.0%
Cap rate
1.0%
Rent to Value Ratio
Active
$2,300,000
3
bds
|
3
ba
|
2,640
sqft
|
built
1997
1415 20th St, Miami Beach, FL 33139
$-8,097
Cash flow
-18.4%
Cash-on-Cash Return
1.9%
Cap rate
0.4%
Rent to Value Ratio
Active
$3,900,000
1
bds
|
2
ba
|
1,365
sqft
|
built
2002
100 S Pointe Dr, Miami Beach, FL 33139
$-19,131
Cash flow
-25.6%
Cash-on-Cash Return
0.3%
Cap rate
0.3%
Rent to Value Ratio
Active
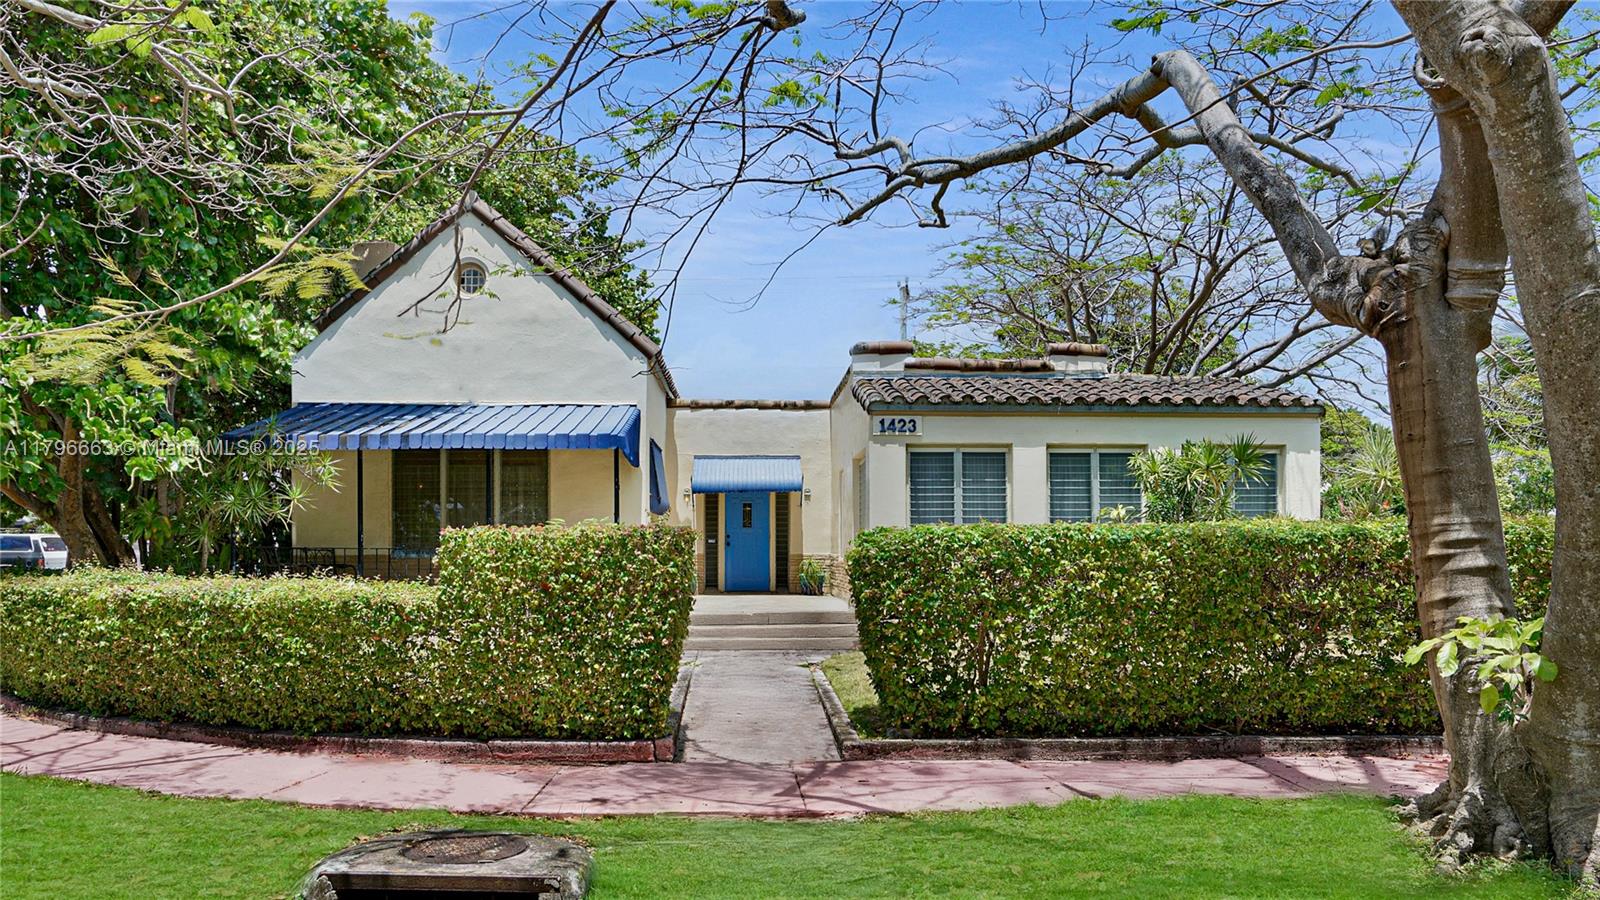
$2,450,000
5
bds
|
4
ba
|
3,452
sqft
|
built
1926
1423 Biarritz Dr, Miami Beach, FL 33141
$-10,478
Cash flow
-22.3%
Cash-on-Cash Return
1.0%
Cap rate
0.2%
Rent to Value Ratio
Active
$299,950
1
bds
|
1
ba
|
837
sqft
|
built
1965
1200 West Ave, Miami Beach, FL 33139
$-1,105
Cash flow
-19.2%
Cash-on-Cash Return
1.7%
Cap rate
0.9%
Rent to Value Ratio
Active
$299,000
1
bds
|
2
ba
|
867
sqft
|
built
1980
7801 Abbott Ave, Miami Beach, FL 33141
$-615
Cash flow
-10.7%
Cash-on-Cash Return
3.7%
Cap rate
0.8%
Rent to Value Ratio
Active
$375,000
1
bds
|
2
ba
|
867
sqft
|
built
1970
5838 Collins Ave, Miami Beach, FL 33140
$-1,640
Cash flow
-22.8%
Cash-on-Cash Return
0.9%
Cap rate
0.6%
Rent to Value Ratio
Active
$900,000
bds
|
1
ba
|
760
sqft
|
built
1926
2301 Collins Ave, Miami Beach, FL 33139
$-2,734
Cash flow
-15.8%
Cash-on-Cash Return
2.5%
Cap rate
0.7%
Rent to Value Ratio