Miami Beach, FL Investment Properties for Sale
Browse homes for sale and investment properties in Miami Beach, FL. Refine your search by price, property type, or more.
Best cash flowing properties in Miami Beach, FL
Active
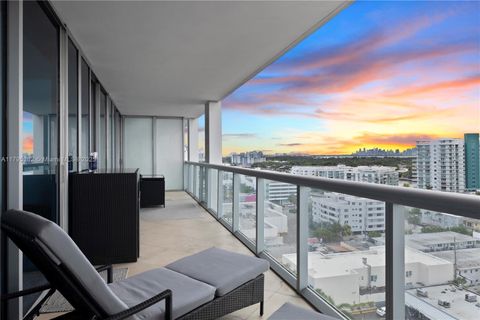
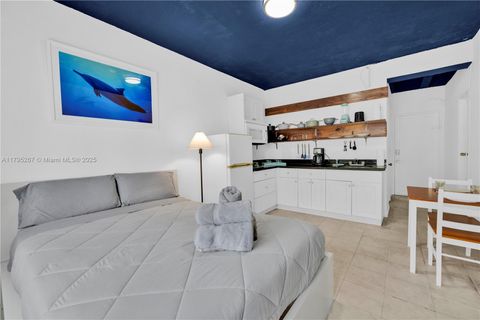
$850,000
2
bds
|
2
ba
|
1,035
sqft
|
built
2008
6799 Collins Ave, Miami Beach, FL 33141
$-48
Cash flow
-0.3%
Cash-on-Cash Return
6.2%
Cap rate
0.9%
Rent to Value Ratio

Active
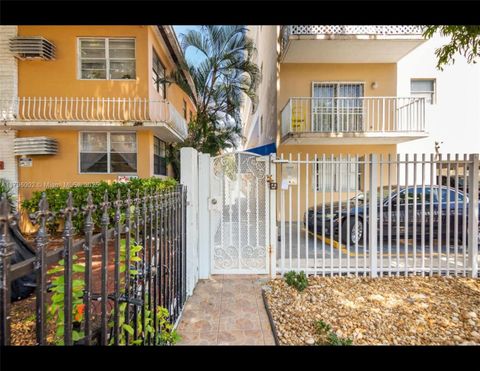
$330,000
1
bds
|
1
ba
|
570
sqft
|
built
1967
5401 Collins Ave, Miami Beach, FL 33140
$-87
Cash flow
-1.4%
Cash-on-Cash Return
5.9%
Cap rate
0.9%
Rent to Value Ratio
1,939 out of 2,137 properties for sale in Miami Beach, FL
Limited Results Shown
Create a free account, or log in to reveal all property listings and enjoy the complete experience.

Active
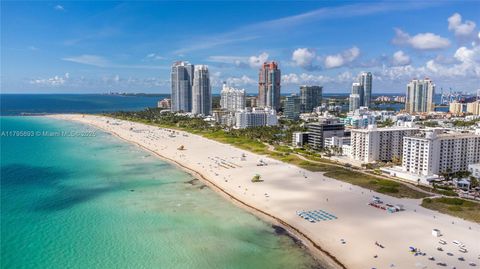
$850,000
bds
|
1
ba
|
760
sqft
|
built
1926
2301 Collins Ave, Miami Beach, FL 33139
$-4,348
Cash flow
-26.7%
Cash-on-Cash Return
0.1%
Cap rate
0.4%
Rent to Value Ratio
Active
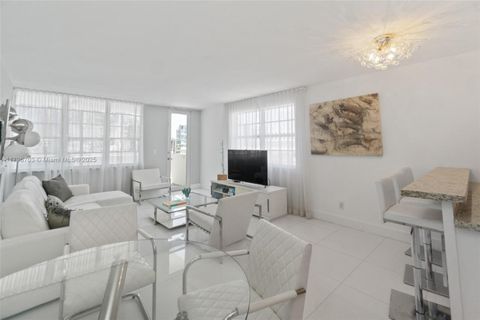
$330,000
1
bds
|
1
ba
|
570
sqft
|
built
1967
5401 Collins Ave, Miami Beach, FL 33140
$-87
Cash flow
-1.4%
Cash-on-Cash Return
5.9%
Cap rate
0.9%
Rent to Value Ratio

Active
$4,550,000
3
bds
|
4
ba
|
2,133
sqft
|
built
2019
6901 Collins Ave, Miami Beach, FL 33141
$-30,418
Cash flow
-34.9%
Cash-on-Cash Return
-1.8%
Cap rate
0.2%
Rent to Value Ratio

Active
$835,000
1
bds
|
2
ba
|
805
sqft
|
built
2004
6515 Collins Ave, Miami Beach, FL 33141
$-2,152
Cash flow
-13.4%
Cash-on-Cash Return
3.2%
Cap rate
0.8%
Rent to Value Ratio

Active
$285,000
1
bds
|
1
ba
|
750
sqft
|
built
1970
716 Michigan Ave, Miami Beach, FL 33139
$-832
Cash flow
-15.2%
Cash-on-Cash Return
2.8%
Cap rate
0.9%
Rent to Value Ratio

Active
$4,399,900
4
bds
|
3
ba
|
2,618
sqft
|
built
1954
6100 Lagorce Dr, Miami Beach, FL 33140
$-20,747
Cash flow
-24.6%
Cash-on-Cash Return
0.6%
Cap rate
0.2%
Rent to Value Ratio

Active
$25,000,000
3
bds
|
3
ba
|
4,434
sqft
|
built
1952
250 W San Marino Dr, Miami Beach, FL 33139
$-155,609
Cash flow
-32.5%
Cash-on-Cash Return
-1.2%
Cap rate
0.0%
Rent to Value Ratio

Active
$380,000
1
bds
|
1
ba
|
515
sqft
|
built
1965
100 Lincoln Rd, Miami Beach, FL 33139
$-1,419
Cash flow
-19.5%
Cash-on-Cash Return
1.8%
Cap rate
0.7%
Rent to Value Ratio

Active
$4,995,000
7
bds
|
6
ba
|
4,821
sqft
|
built
1924
5812 Alton Rd, Miami Beach, FL 33140
$-23,764
Cash flow
-24.8%
Cash-on-Cash Return
0.6%
Cap rate
0.2%
Rent to Value Ratio

Active
$699,000
2
bds
|
2
ba
|
1,324
sqft
|
built
1972
11 Island Ave, Miami Beach, FL 33139
$-2,106
Cash flow
-15.7%
Cash-on-Cash Return
2.6%
Cap rate
0.9%
Rent to Value Ratio

Active
$1,875,000
3
bds
|
2
ba
|
1,886
sqft
|
built
1968
920 W 47th St, Miami Beach, FL 33140
$-7,221
Cash flow
-20.1%
Cash-on-Cash Return
1.6%
Cap rate
0.3%
Rent to Value Ratio

Active
$1,795,000
2
bds
|
2
ba
|
1,290
sqft
|
built
2008
6899 Collins Ave, Miami Beach, FL 33141
$-3,261
Cash flow
-9.5%
Cash-on-Cash Return
4.1%
Cap rate
0.6%
Rent to Value Ratio

Active
$389,000
1
bds
|
1
ba
|
410
sqft
|
built
1939
335 Ocean Dr, Miami Beach, FL 33139
$-1,503
Cash flow
-20.2%
Cash-on-Cash Return
1.6%
Cap rate
0.6%
Rent to Value Ratio

Pending
$1,999,000
4
bds
|
4
ba
|
2,162
sqft
|
built
1974
4101 Pine Tree Dr, Miami Beach, FL 33140
$-7,282
Cash flow
-19.0%
Cash-on-Cash Return
1.9%
Cap rate
0.3%
Rent to Value Ratio

Active
$925,000
2
bds
|
2
ba
|
1,700
sqft
|
built
2010
6000 Collins Ave, Miami Beach, FL 33140
$-2,618
Cash flow
-14.8%
Cash-on-Cash Return
2.9%
Cap rate
0.8%
Rent to Value Ratio

Active
$718,000
2
bds
|
2
ba
|
1,070
sqft
|
built
1995
1688 West Ave, Miami Beach, FL 33139
$-2,557
Cash flow
-18.6%
Cash-on-Cash Return
2.0%
Cap rate
0.6%
Rent to Value Ratio

Active under contract
$245,000
1
bds
|
1
ba
|
678
sqft
|
built
1963
900 Bay Dr, Miami Beach, FL 33141
$-823
Cash flow
-17.5%
Cash-on-Cash Return
2.2%
Cap rate
0.9%
Rent to Value Ratio

Active
$430,000
1
bds
|
1
ba
|
655
sqft
|
built
1970
401 Ocean Dr, Miami Beach, FL 33139
$-1,612
Cash flow
-19.6%
Cash-on-Cash Return
1.8%
Cap rate
0.7%
Rent to Value Ratio

Active
$539,000
1
bds
|
2
ba
|
797
sqft
|
built
1966
2899 Collins Ave, Miami Beach, FL 33140
$-1,935
Cash flow
-18.7%
Cash-on-Cash Return
2.0%
Cap rate
0.5%
Rent to Value Ratio

Active
$870,000
2
bds
|
2
ba
|
1,088
sqft
|
built
2008
1100 West Ave, Miami Beach, FL 33139
$-1,044
Cash flow
-6.3%
Cash-on-Cash Return
4.8%
Cap rate
1.0%
Rent to Value Ratio
Active
$477,000
2
bds
|
2
ba
|
832
sqft
|
built
1981
1605 Pennsylvania Ave, Miami Beach, FL 33139
$-25,490
Cash flow
-278.8%
Cash-on-Cash Return
-57.9%
Cap rate
0.7%
Rent to Value Ratio
Active
$399,000
1
bds
|
1
ba
|
662
sqft
|
built
1970
345 Ocean Dr, Miami Beach, FL 33139
$-1,338
Cash flow
-17.5%
Cash-on-Cash Return
2.2%
Cap rate
0.8%
Rent to Value Ratio

Active
$615,000
1
bds
|
1
ba
|
717
sqft
|
built
2008
6801 Collins Ave, Miami Beach, FL 33141
$-2,253
Cash flow
-19.1%
Cash-on-Cash Return
1.9%
Cap rate
0.6%
Rent to Value Ratio
Active
$849,000
2
bds
|
2
ba
|
1,190
sqft
|
built
1965
100 Lincoln Rd, Miami Beach, FL 33139
$-1,934
Cash flow
-11.9%
Cash-on-Cash Return
3.5%
Cap rate
0.5%
Rent to Value Ratio
Active
$1,190,000
3
bds
|
4
ba
|
2,950
sqft
|
built
1970
5660 Collins Ave, Miami Beach, FL 33140
$-5,112
Cash flow
-22.4%
Cash-on-Cash Return
1.1%
Cap rate
0.7%
Rent to Value Ratio
Active
$1,349,000
3
bds
|
2
ba
|
1,477
sqft
|
built
1981
9 Island Ave, Miami Beach, FL 33139
$-5,429
Cash flow
-21.0%
Cash-on-Cash Return
1.4%
Cap rate
0.5%
Rent to Value Ratio
Active
$475,000
1
bds
|
1
ba
|
662
sqft
|
built
2008
6801 Collins Ave, Miami Beach, FL 33141
$-2,549
Cash flow
-28.0%
Cash-on-Cash Return
-0.2%
Cap rate
0.8%
Rent to Value Ratio
Active
$1,349,000
1
bds
|
1
ba
|
1,066
sqft
|
built
2005
4401 Collins Ave, Miami Beach, FL 33140
$-5,763
Cash flow
-22.3%
Cash-on-Cash Return
1.1%
Cap rate
0.5%
Rent to Value Ratio

Active
$3,750,000
1
bds
|
2
ba
|
1,365
sqft
|
built
2002
100 S Pointe Dr, Miami Beach, FL 33139
$-19,298
Cash flow
-26.8%
Cash-on-Cash Return
0.1%
Cap rate
0.3%
Rent to Value Ratio
Active
$200,000
bds
|
1
ba
|
260
sqft
|
built
1941
255 W 24th St, Miami Beach, FL 33140
$-737
Cash flow
-19.2%
Cash-on-Cash Return
1.8%
Cap rate
1.0%
Rent to Value Ratio

Active
$992,000
3
bds
|
3
ba
|
1,440
sqft
|
built
2004
5970 Indian Creek Dr, Miami Beach, FL 33140
$-4,285
Cash flow
-22.5%
Cash-on-Cash Return
1.1%
Cap rate
0.5%
Rent to Value Ratio

Active
$1,925,000
3
bds
|
3
ba
|
1,485
sqft
|
built
1999
125 Jefferson Ave, Miami Beach, FL 33139
$-5,311
Cash flow
-14.4%
Cash-on-Cash Return
3.0%
Cap rate
0.5%
Rent to Value Ratio
Active
$3,450,000
2
bds
|
3
ba
|
2,163
sqft
|
built
2004
6365 Collins Ave, Miami Beach, FL 33141
$-17,441
Cash flow
-26.4%
Cash-on-Cash Return
0.2%
Cap rate
0.2%
Rent to Value Ratio
Active
$23,500,000
5
bds
|
6
ba
|
7,025
sqft
|
built
2007
7143 Fisher Island Dr, Miami Beach, FL 33109
$-135,653
Cash flow
-30.1%
Cash-on-Cash Return
-0.7%
Cap rate
0.0%
Rent to Value Ratio

Active
$475,000
1
bds
|
1
ba
|
662
sqft
|
built
2008
6801 Collins Ave, Miami Beach, FL 33141
$-3,167
Cash flow
-34.8%
Cash-on-Cash Return
-1.7%
Cap rate
0.7%
Rent to Value Ratio

Active
$4,200,000
3
bds
|
3
ba
|
2,008
sqft
|
built
2002
1000 S Pointe Dr, Miami Beach, FL 33139
$-23,187
Cash flow
-28.8%
Cash-on-Cash Return
-0.4%
Cap rate
0.2%
Rent to Value Ratio

Active
$1,425,000
2
bds
|
2
ba
|
1,181
sqft
|
built
2008
6801 Collins Ave, Miami Beach, FL 33141
$-7,726
Cash flow
-28.3%
Cash-on-Cash Return
-0.2%
Cap rate
0.5%
Rent to Value Ratio

Active
$485,000
2
bds
|
2
ba
|
1,030
sqft
|
built
1968
5700 Collins Ave, Miami Beach, FL 33140
$-2,375
Cash flow
-25.5%
Cash-on-Cash Return
0.4%
Cap rate
0.6%
Rent to Value Ratio
Active
$850,000
2
bds
|
2
ba
|
1,035
sqft
|
built
2008
6799 Collins Ave, Miami Beach, FL 33141
$-48
Cash flow
-0.3%
Cash-on-Cash Return
6.2%
Cap rate
0.9%
Rent to Value Ratio
Active
$2,475,000
3
bds
|
2
ba
|
1,550
sqft
|
built
1997
1900 Purdy Ave, Miami Beach, FL 33139
$-10,488
Cash flow
-22.1%
Cash-on-Cash Return
1.2%
Cap rate
0.4%
Rent to Value Ratio