Milwaukee, WI Investment Properties for Sale
Browse homes for sale and investment properties in Milwaukee, WI. Refine your search by price, property type, or more.
Best cash flowing properties in Milwaukee, WI
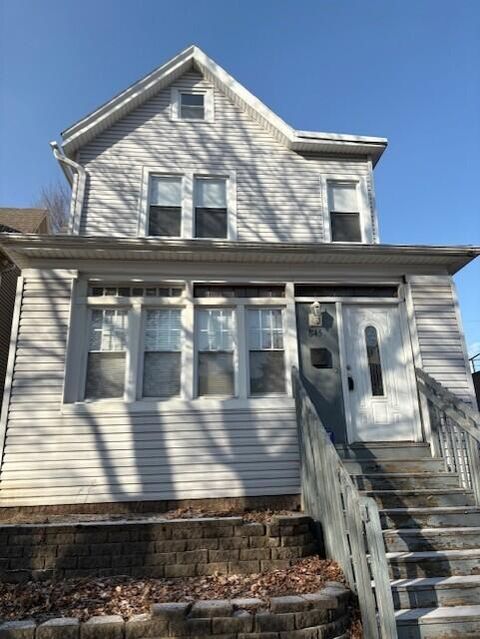
Active
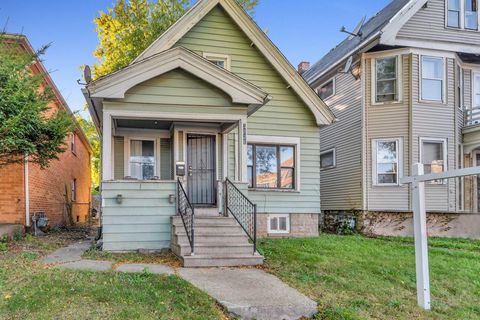
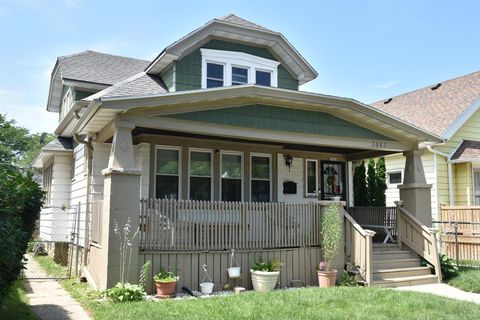
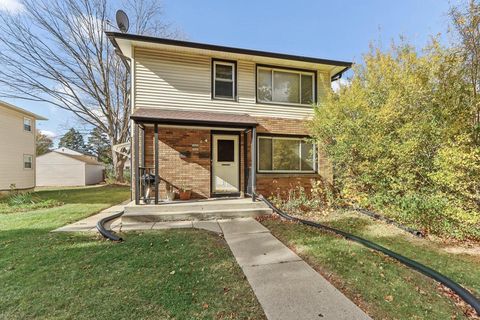
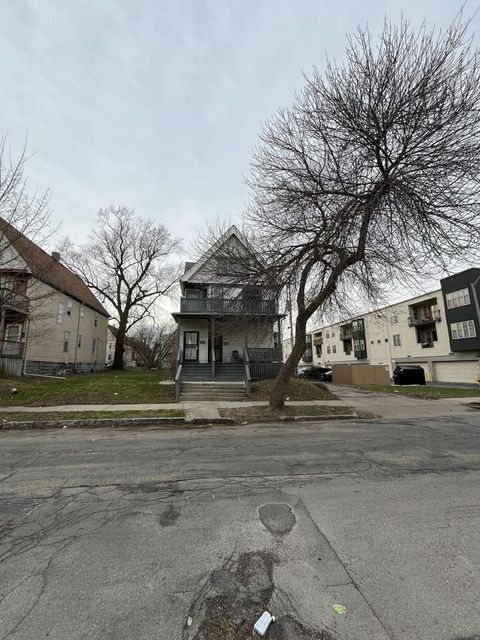
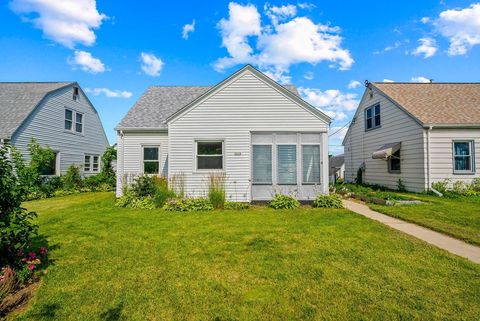
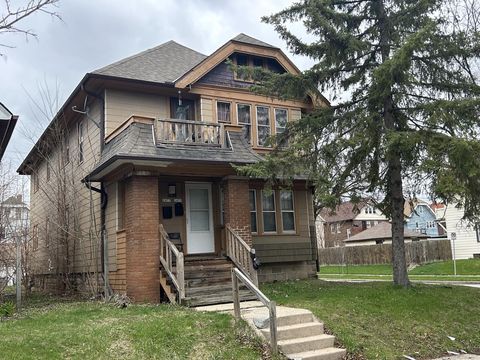
$85,000
3
bds
|
0
ba
|
1,174
sqft
|
built
1915
3221 N 38th St, Milwaukee, WI 53216
$250
Cash flow
15.3%
Cash-on-Cash Return
9.7%
Cap rate
1.4%
Rent to Value Ratio
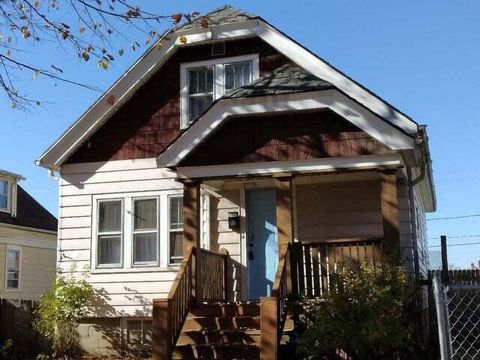
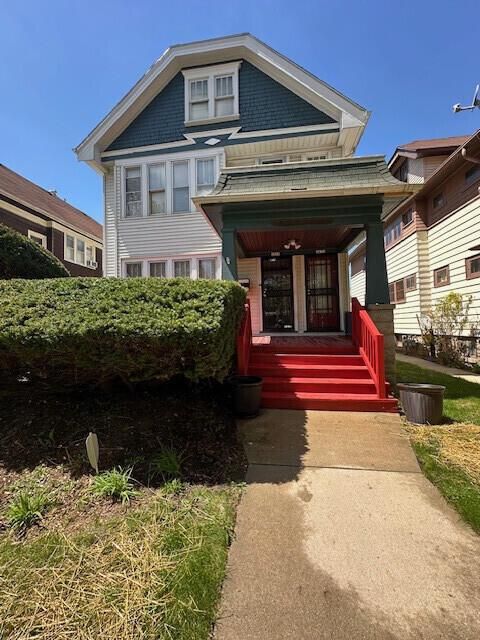
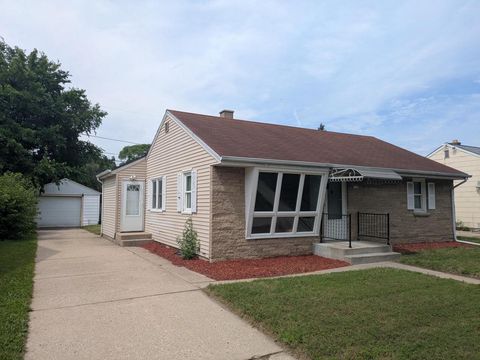
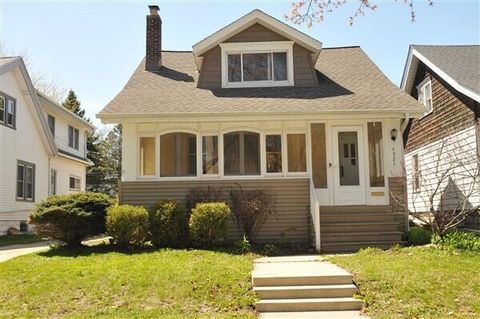
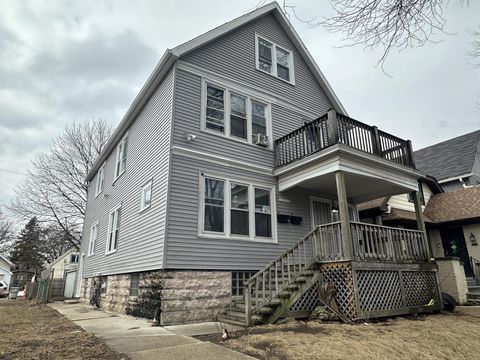
Active
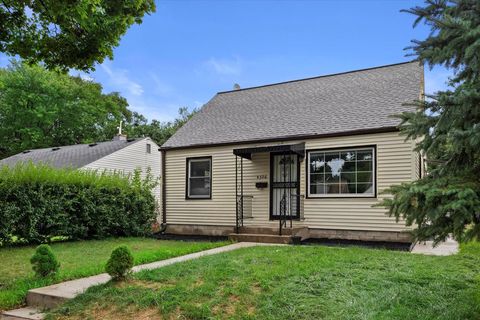
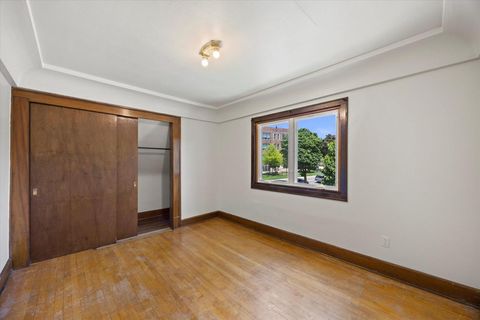
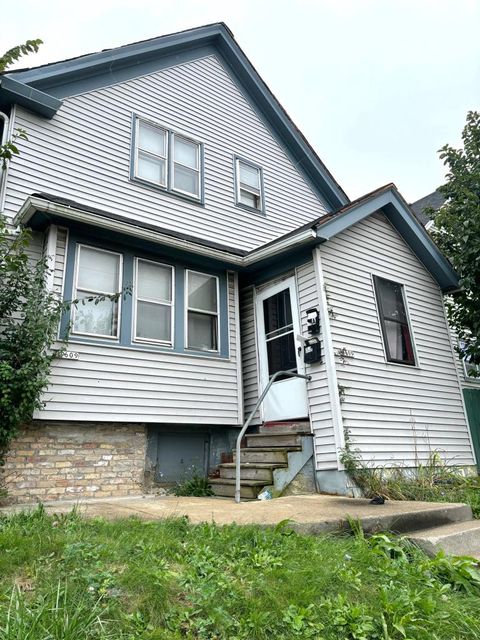
$90,000
3
bds
|
1
ba
|
892
sqft
|
built
1924
4715 N 39th St, Milwaukee, WI 53209
$222
Cash flow
12.9%
Cash-on-Cash Return
9.1%
Cap rate
1.3%
Rent to Value Ratio
380 out of 497 properties for sale in Milwaukee, WI
Limited Results Shown
Create a free account, or log in to reveal all property listings and enjoy the complete experience.
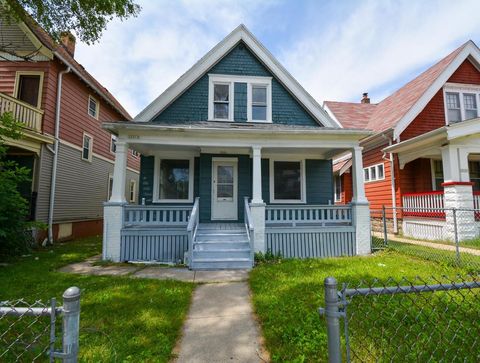
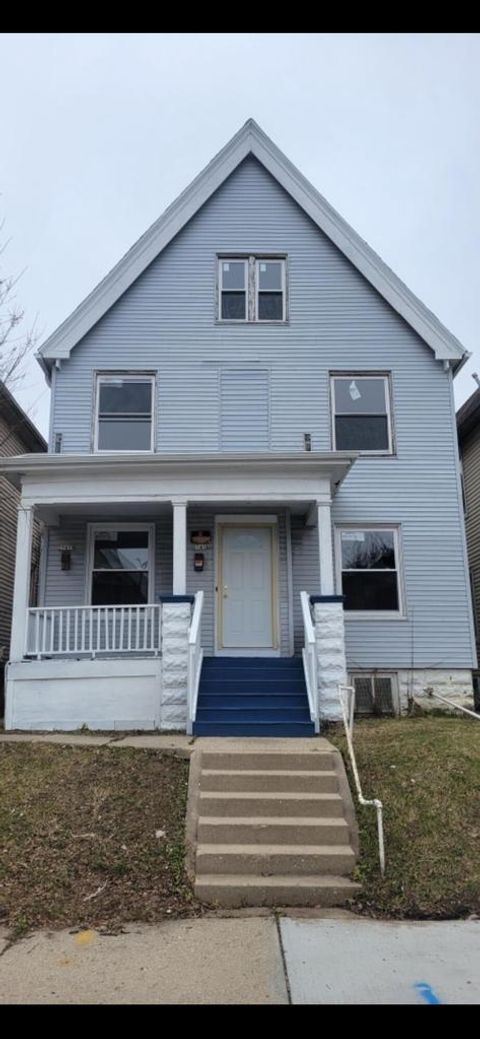
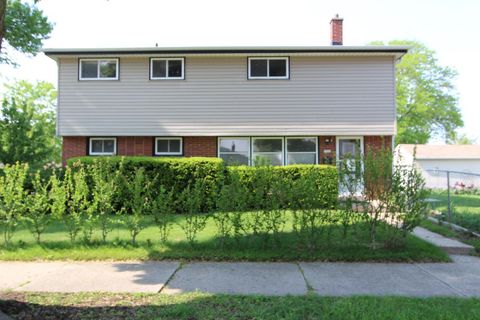
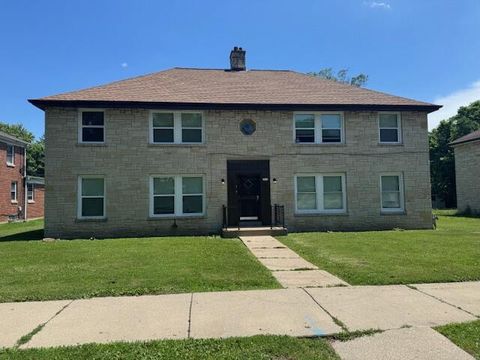
Active
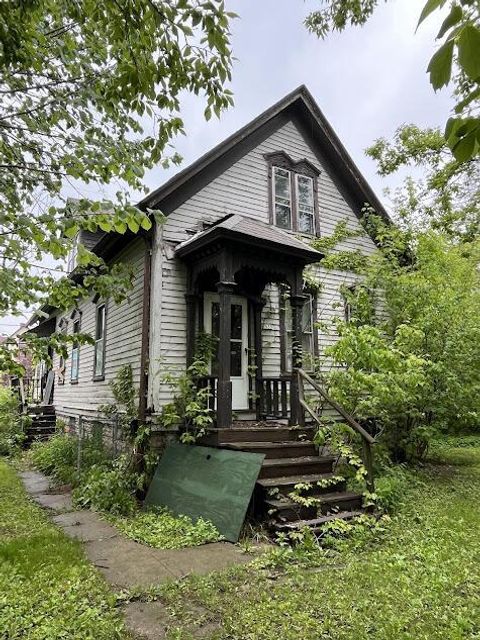
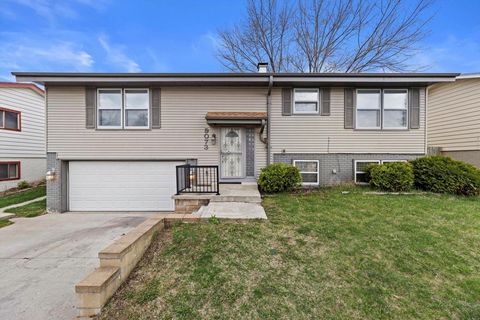
$139,900
5
bds
|
1
ba
|
1,688
sqft
|
built
1913
3221 N 29th St, Milwaukee, WI 53216
$-175
Cash flow
-6.5%
Cash-on-Cash Return
4.6%
Cap rate
0.6%
Rent to Value Ratio
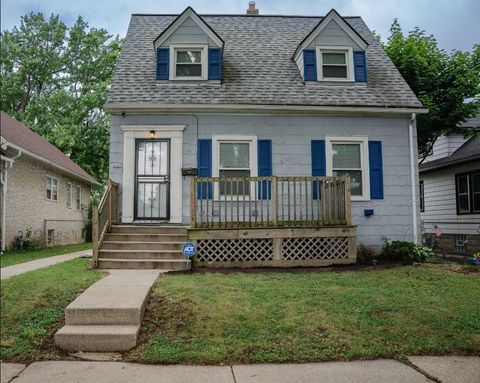
Active
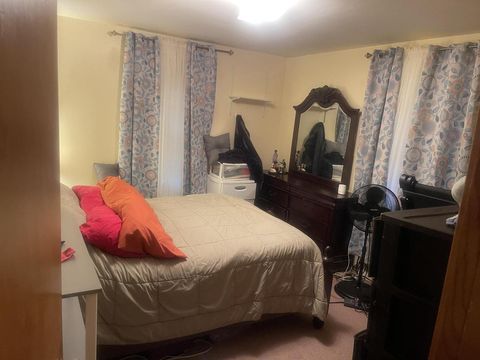
$162,500
2
bds
|
1.5
ba
|
1,057
sqft
|
built
1940
4429 N 56th St, Milwaukee, WI 53218
$-185
Cash flow
-5.9%
Cash-on-Cash Return
4.8%
Cap rate
0.8%
Rent to Value Ratio
Active
$130,000
2
bds
|
1
ba
|
1,110
sqft
|
built
1925
3843 N 25th St, Milwaukee, WI 53206
$108
Cash flow
4.3%
Cash-on-Cash Return
7.1%
Cap rate
1.0%
Rent to Value Ratio
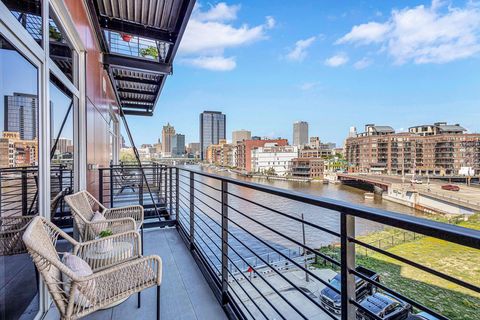
Active
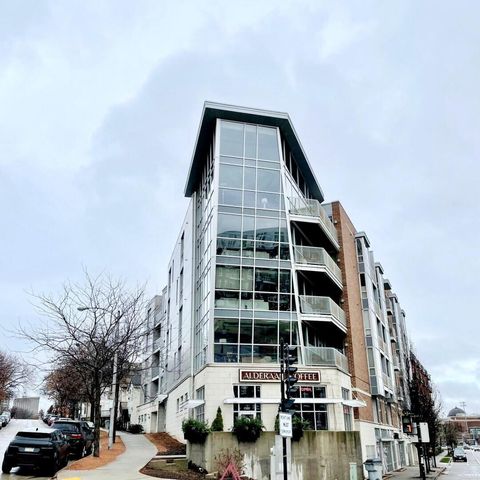
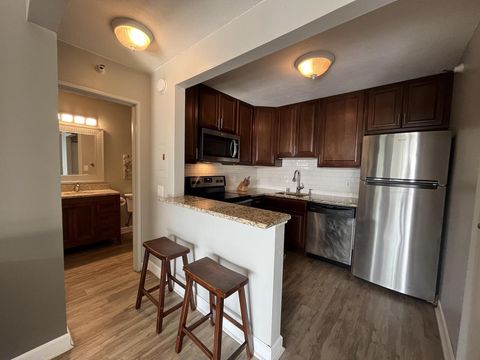
$299,000
1
bds
|
1
ba
|
678
sqft
|
built
2006
106 W Seeboth St, Milwaukee, WI 53204
$-1,456
Cash flow
-25.4%
Cash-on-Cash Return
0.3%
Cap rate
0.5%
Rent to Value Ratio
Active
$285,000
3
bds
|
2
ba
|
1,255
sqft
|
built
1967
1707 N Prospect Ave, Milwaukee, WI 53202
$-1,522
Cash flow
-27.9%
Cash-on-Cash Return
-0.3%
Cap rate
0.6%
Rent to Value Ratio
Active
$245,555
6
bds
|
0
ba
|
3,043
sqft
|
built
1923
2809 N 48th St, Milwaukee, WI 53210
$-679
Cash flow
-14.4%
Cash-on-Cash Return
2.8%
Cap rate
0.5%
Rent to Value Ratio
Active
$1,399,000
7
bds
|
5
ba
|
6,911
sqft
|
built
1895
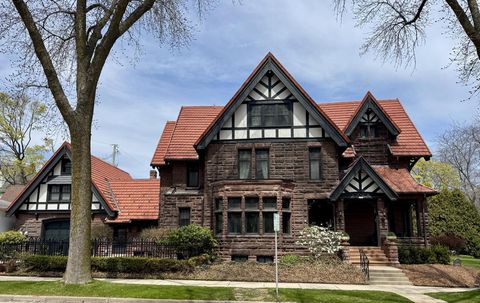
2701 N Lake Dr, Milwaukee, WI 53211
$-7,346
Cash flow
-27.4%
Cash-on-Cash Return
-0.2%
Cap rate
0.3%
Rent to Value Ratio
Active
$259,900
3
bds
|
1
ba
|
963
sqft
|
built
1953
5509 N 20th St, Milwaukee, WI 53209
$-183
Cash flow
-3.7%
Cash-on-Cash Return
5.3%
Cap rate
0.8%
Rent to Value Ratio
Active
$118,000
5
bds
|
0
ba
|
1,932
sqft
|
built
1910
2541 N 34th St, Milwaukee, WI 53210
$-3
Cash flow
-0.1%
Cash-on-Cash Return
6.1%
Cap rate
0.8%
Rent to Value Ratio
Active
$119,000
3
bds
|
1
ba
|
1,270
sqft
|
built
1893
3124 N 29th St, Milwaukee, WI 53216
$29
Cash flow
1.3%
Cash-on-Cash Return
6.4%
Cap rate
0.9%
Rent to Value Ratio
Active
$193,000
6
bds
|
1
ba
|
1,840
sqft
|
built
1953
5323 N 27th St, Milwaukee, WI 53209
$-487
Cash flow
-13.2%
Cash-on-Cash Return
3.1%
Cap rate
0.6%
Rent to Value Ratio

Active
$307,500
3
bds
|
1
ba
|
2,786
sqft
|
built
1927
2519 N 60th St, Milwaukee, WI 53210
$-828
Cash flow
-14.0%
Cash-on-Cash Return
2.9%
Cap rate
0.5%
Rent to Value Ratio
Active
$534,900
4
bds
|
3
ba
|
1,614
sqft
|
built
1920
4321 N Murray Ave, Milwaukee, WI 53211
$-2,285
Cash flow
-22.3%
Cash-on-Cash Return
1.0%
Cap rate
0.4%
Rent to Value Ratio
Active
$325,000
5
bds
|
2
ba
|
1,947
sqft
|
built
1954
5326 W Crawford Ave, Milwaukee, WI 53220
$-761
Cash flow
-12.2%
Cash-on-Cash Return
3.3%
Cap rate
0.6%
Rent to Value Ratio
Active
$319,900
1
bds
|
1
ba
|
858
sqft
|
built
2007
106 W Seeboth St, Milwaukee, WI 53204
$-1,675
Cash flow
-27.3%
Cash-on-Cash Return
-0.1%
Cap rate
0.5%
Rent to Value Ratio
Active
$475,000
2
bds
|
2
ba
|
1,329
sqft
|
built
1922
1325 N Van Buren St, Milwaukee, WI 53202
$-2,353
Cash flow
-25.8%
Cash-on-Cash Return
0.2%
Cap rate
0.4%
Rent to Value Ratio
Active
$249,900
5
bds
|
1
ba
|
2,470
sqft
|
built
1890
845 N 22nd St, Milwaukee, WI 53233
$-359
Cash flow
-7.5%
Cash-on-Cash Return
4.4%
Cap rate
0.8%
Rent to Value Ratio
Active
$169,420
4
bds
|
1
ba
|
2,016
sqft
|
built
1920
3151 N 41st St, Milwaukee, WI 53216
$-363
Cash flow
-11.2%
Cash-on-Cash Return
3.6%
Cap rate
0.6%
Rent to Value Ratio
Active
$399,900
bds
|
0
ba
|
0
sqft
|
built
1947
3910 N Sherman Blvd, Milwaukee, WI 53216
$-1,653
Cash flow
-21.6%
Cash-on-Cash Return
1.2%
Cap rate
0.4%
Rent to Value Ratio
Active
$89,000
1
bds
|
1
ba
|
625
sqft
|
built
1971
11926 W Mill Rd, Milwaukee, WI 53225
$-464
Cash flow
-27.2%
Cash-on-Cash Return
-0.1%
Cap rate
0.9%
Rent to Value Ratio
Active
$145,000
bds
|
0
ba
|
0
sqft
|
built
1904
2237 N 33rd St, Milwaukee, WI 53208
$59
Cash flow
2.1%
Cash-on-Cash Return
6.6%
Cap rate
1.0%
Rent to Value Ratio
Active
$224,900
4
bds
|
2
ba
|
1,396
sqft
|
built
1951
4326 N 51st Blvd, Milwaukee, WI 53216
$-440
Cash flow
-10.2%
Cash-on-Cash Return
3.8%
Cap rate
0.6%
Rent to Value Ratio
Active
$107,900
3
bds
|
1
ba
|
1,418
sqft
|
built
1885
2635 N 6th St, Milwaukee, WI 53212
$-53
Cash flow
-2.6%
Cash-on-Cash Return
5.6%
Cap rate
0.8%
Rent to Value Ratio
Active
$274,900
3
bds
|
1
ba
|
1,239
sqft
|
built
1948
3218 S Chase Ave, Milwaukee, WI 53207
$-389
Cash flow
-7.4%
Cash-on-Cash Return
4.4%
Cap rate
0.7%
Rent to Value Ratio
Active
$259,900
2
bds
|
1
ba
|
934
sqft
|
built
1926
3265 S Swain Ct, Milwaukee, WI 53207
$-602
Cash flow
-12.1%
Cash-on-Cash Return
3.4%
Cap rate
0.6%
Rent to Value Ratio
Active
$259,995
3
bds
|
2
ba
|
1,219
sqft
|
built
1979
9073 N Joyce Ave, Milwaukee, WI 53224
$-614
Cash flow
-12.3%
Cash-on-Cash Return
3.3%
Cap rate
0.7%
Rent to Value Ratio
Active
$164,999
2
bds
|
0
ba
|
925
sqft
|
built
1957
4300 N 73rd St, Milwaukee, WI 53216
$-217
Cash flow
-6.9%
Cash-on-Cash Return
4.6%
Cap rate
0.8%
Rent to Value Ratio
Active
$155,000
4
bds
|
0
ba
|
2,236
sqft
|
built
1926
2477 N 49th St, Milwaukee, WI 53210
$-481
Cash flow
-16.2%
Cash-on-Cash Return
2.4%
Cap rate
0.5%
Rent to Value Ratio
Active
$109,900
4
bds
|
1
ba
|
1,450
sqft
|
built
1918
3609 W Hampton Ave, Milwaukee, WI 53209
$-107
Cash flow
-5.1%
Cash-on-Cash Return
5.0%
Cap rate
0.9%
Rent to Value Ratio
Active
$315,000
2
bds
|
0
ba
|
1,140
sqft
|
built
2008
1541 N Jefferson St, Milwaukee, WI 53202
$-831
Cash flow
-13.8%
Cash-on-Cash Return
3.0%
Cap rate
0.6%
Rent to Value Ratio

Active
$600,000
2
bds
|
2
ba
|
1,612
sqft
|
built
2012
1141 N Old World 3rd St, Milwaukee, WI 53203
$-3,247
Cash flow
-28.2%
Cash-on-Cash Return
-0.3%
Cap rate
0.4%
Rent to Value Ratio
Active
$250,000
1
bds
|
1
ba
|
733
sqft
|
built
1990
1660 N Prospect Ave, Milwaukee, WI 53202
$-964
Cash flow
-20.1%
Cash-on-Cash Return
1.5%
Cap rate
0.6%
Rent to Value Ratio
Active
$215,000
3
bds
|
0
ba
|
918
sqft
|
built
1958
8210 W Winfield Ave, Milwaukee, WI 53218
$-476
Cash flow
-11.6%
Cash-on-Cash Return
3.5%
Cap rate
0.7%
Rent to Value Ratio
Active
$185,000
4
bds
|
0
ba
|
2,288
sqft
|
built
1926
3733 W Sarnow St, Milwaukee, WI 53208
$-314
Cash flow
-8.9%
Cash-on-Cash Return
4.1%
Cap rate
0.6%
Rent to Value Ratio
Active
$298,000
6
bds
|
2
ba
|
2,719
sqft
|
built
1928
3402 N 51st Blvd, Milwaukee, WI 53216
$-887
Cash flow
-15.5%
Cash-on-Cash Return
2.6%
Cap rate
0.5%
Rent to Value Ratio
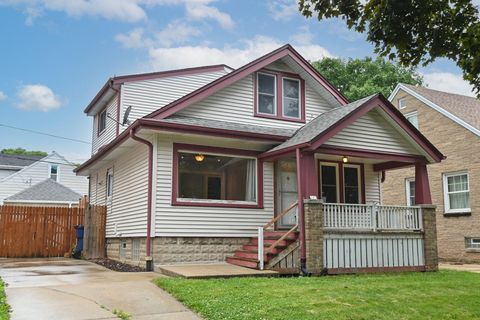
Active
$233,000
4
bds
|
1
ba
|
1,573
sqft
|
built
1907
1009 S 35th St, Milwaukee, WI 53215
$-298
Cash flow
-6.7%
Cash-on-Cash Return
4.6%
Cap rate
0.7%
Rent to Value Ratio
Active
$299,900
4
bds
|
2
ba
|
1,120
sqft
|
built
1926
203 N 71st St, Milwaukee, WI 53213
$-837
Cash flow
-14.6%
Cash-on-Cash Return
2.8%
Cap rate
0.5%
Rent to Value Ratio
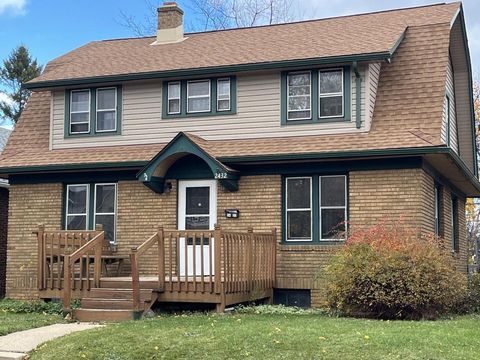
Active
$223,900
4
bds
|
1.5
ba
|
1,692
sqft
|
built
1924
2432 N 55th St, Milwaukee, WI 53210
$-326
Cash flow
-7.6%
Cash-on-Cash Return
4.4%
Cap rate
0.8%
Rent to Value Ratio