Milwaukee, WI Investment Properties for Sale
Browse homes for sale and investment properties in Milwaukee, WI. Refine your search by price, property type, or more.
Best cash flowing properties in Milwaukee, WI
Active
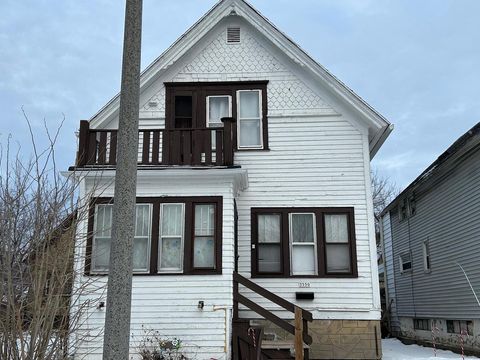
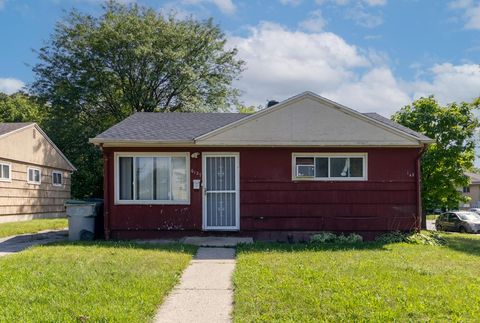
$59,900
3
bds
|
0
ba
|
1,476
sqft
|
built
1891
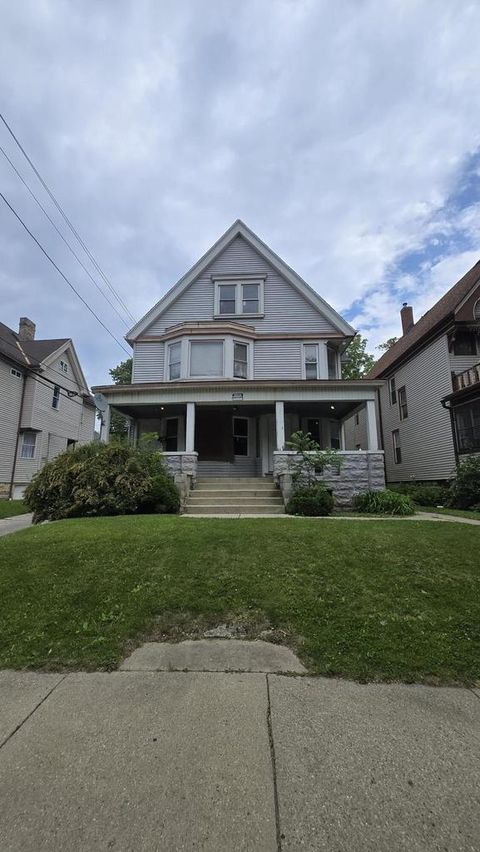
3550 N 11th St, Milwaukee, WI 53206
$821
Cash flow
16.0%
Cash-on-Cash Return
16.4%
Cap rate
2.3%
Rent to Value Ratio
Active
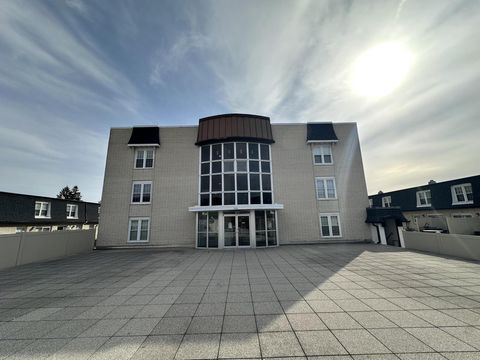
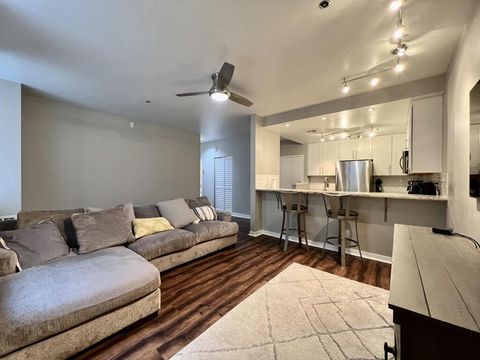
$63,500
1
bds
|
0
ba
|
632
sqft
|
built
1966
9500 N Green Bay Rd, Milwaukee, WI 53209
$682
Cash flow
12.5%
Cash-on-Cash Return
12.9%
Cap rate
1.7%
Rent to Value Ratio
801 out of 1,226 properties for sale in Milwaukee, WI
Limited Results Shown
Create a free account, or log in to reveal all property listings and enjoy the complete experience.
Active
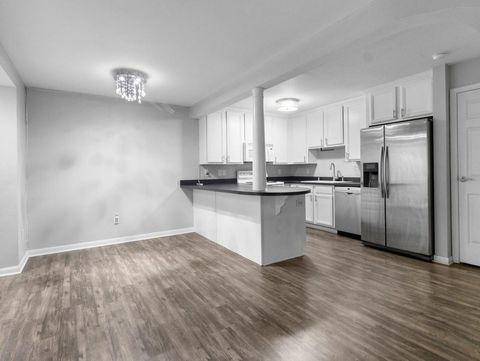
$63,500
1
bds
|
0
ba
|
632
sqft
|
built
1966
9500 N Green Bay Rd, Milwaukee, WI 53209
$682
Cash flow
12.5%
Cash-on-Cash Return
12.9%
Cap rate
1.7%
Rent to Value Ratio
Active
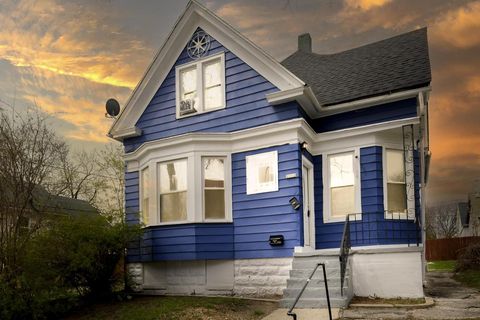
$214,900
4
bds
|
0
ba
|
1,910
sqft
|
built
1910
3124 N Buffum St, Milwaukee, WI 53212
$-353
Cash flow
-8.6%
Cash-on-Cash Return
4.2%
Cap rate
0.6%
Rent to Value Ratio

Active
$249,900
8
bds
|
0
ba
|
2,783
sqft
|
built
1910
2936 S 9th Pl, Milwaukee, WI 53215
$-829
Cash flow
-17.3%
Cash-on-Cash Return
2.2%
Cap rate
0.5%
Rent to Value Ratio
Active
$59,900
3
bds
|
0
ba
|
1,476
sqft
|
built
1891
3550 N 11th St, Milwaukee, WI 53206
$821
Cash flow
16.0%
Cash-on-Cash Return
16.4%
Cap rate
2.3%
Rent to Value Ratio
Active
$725,000
2
bds
|
0
ba
|
1,476
sqft
|
built
2006
106 W Seeboth St, Milwaukee, WI 53204
$-3,231
Cash flow
-23.3%
Cash-on-Cash Return
0.8%
Cap rate
0.3%
Rent to Value Ratio
Active
$113,900
2
bds
|
0
ba
|
672
sqft
|
built
1954
6127 W Carmen Ave, Milwaukee, WI 53218
$-47
Cash flow
-2.2%
Cash-on-Cash Return
5.6%
Cap rate
0.8%
Rent to Value Ratio
Active
$275,000
2
bds
|
0
ba
|
992
sqft
|
built
1893
234 N Broadway, Milwaukee, WI 53202
$-978
Cash flow
-18.6%
Cash-on-Cash Return
1.9%
Cap rate
0.5%
Rent to Value Ratio
Active
$243,900
2
bds
|
0
ba
|
974
sqft
|
built
1983
1108 N Milwaukee St, Milwaukee, WI 53202
$-571
Cash flow
-12.2%
Cash-on-Cash Return
3.3%
Cap rate
0.7%
Rent to Value Ratio
Active
$159,900
4
bds
|
0
ba
|
1,524
sqft
|
built
1901
2111 S 25th St, Milwaukee, WI 53215
$-369
Cash flow
-12.0%
Cash-on-Cash Return
3.4%
Cap rate
0.5%
Rent to Value Ratio

Active
$113,900
2
bds
|
0
ba
|
672
sqft
|
built
1954
5725 N 60th St, Milwaukee, WI 53218
$25
Cash flow
1.1%
Cash-on-Cash Return
6.4%
Cap rate
0.9%
Rent to Value Ratio
Active
$99,900
4
bds
|
0
ba
|
1,324
sqft
|
built
1924
5354 N 34th St, Milwaukee, WI 53209
$306
Cash flow
16.0%
Cash-on-Cash Return
9.8%
Cap rate
1.4%
Rent to Value Ratio
Active
$179,900
4
bds
|
0
ba
|
1,514
sqft
|
built
1928
4271 N 26th St, Milwaukee, WI 53209
$-1
Cash flow
0.0%
Cash-on-Cash Return
6.1%
Cap rate
0.9%
Rent to Value Ratio
Active
$139,900
3
bds
|
0
ba
|
961
sqft
|
built
1952
4362 N 41st St, Milwaukee, WI 53216
$-96
Cash flow
-3.6%
Cash-on-Cash Return
5.3%
Cap rate
0.9%
Rent to Value Ratio
Active
$155,000
4
bds
|
0
ba
|
1,721
sqft
|
built
1942
4426 W Medford Ave, Milwaukee, WI 53216
$-401
Cash flow
-13.5%
Cash-on-Cash Return
3.0%
Cap rate
0.6%
Rent to Value Ratio

Active
$274,900
2
bds
|
0
ba
|
1,174
sqft
|
built
1965
2525 S Shore Dr, Milwaukee, WI 53207
$-732
Cash flow
-13.9%
Cash-on-Cash Return
3.0%
Cap rate
0.6%
Rent to Value Ratio
Active
$379,000
2
bds
|
0
ba
|
1,125
sqft
|
built
1968
929 N Astor St, Milwaukee, WI 53202
$-1,162
Cash flow
-16.0%
Cash-on-Cash Return
2.5%
Cap rate
0.5%
Rent to Value Ratio

Active
$2,375,000
2
bds
|
0
ba
|
3,761
sqft
|
built
2007
825 N Prospect Ave, Milwaukee, WI 53202
$-12,997
Cash flow
-28.6%
Cash-on-Cash Return
-0.4%
Cap rate
0.2%
Rent to Value Ratio
Active
$400,000
4
bds
|
0
ba
|
2,420
sqft
|
built
2005
1304 W Garfield Ave, Milwaukee, WI 53205
$-1,050
Cash flow
-13.7%
Cash-on-Cash Return
3.0%
Cap rate
0.5%
Rent to Value Ratio

Active
$549,000
4
bds
|
0
ba
|
2,729
sqft
|
built
1906
2834 N Murray Ave, Milwaukee, WI 53211
$-1,504
Cash flow
-14.3%
Cash-on-Cash Return
2.9%
Cap rate
0.6%
Rent to Value Ratio
Active
$795,000
2
bds
|
0
ba
|
1,651
sqft
|
built
2006
311 E Erie St, Milwaukee, WI 53202
$-3,794
Cash flow
-24.9%
Cash-on-Cash Return
0.4%
Cap rate
0.3%
Rent to Value Ratio
Active
$550,000
1
bds
|
0
ba
|
1,235
sqft
|
built
2005
601 E Erie St, Milwaukee, WI 53202
$-1,742
Cash flow
-16.5%
Cash-on-Cash Return
2.3%
Cap rate
0.5%
Rent to Value Ratio

Active
$119,900
4
bds
|
0
ba
|
1,810
sqft
|
built
1927
3726 N 3rd St, Milwaukee, WI 53212
$-113
Cash flow
-4.9%
Cash-on-Cash Return
5.0%
Cap rate
0.8%
Rent to Value Ratio

Active
$445,000
5
bds
|
0
ba
|
2,731
sqft
|
built
1915
3348 N Oakland Ave, Milwaukee, WI 53211
$-1,609
Cash flow
-18.9%
Cash-on-Cash Return
1.8%
Cap rate
0.4%
Rent to Value Ratio

Active
$374,900
5
bds
|
0
ba
|
2,367
sqft
|
built
1950
8730 W Center St, Milwaukee, WI 53222
$-1,619
Cash flow
-22.5%
Cash-on-Cash Return
1.0%
Cap rate
0.3%
Rent to Value Ratio

Active
$399,900
bds
|
0
ba
|
0
sqft
|
built
1961
6110 W Appleton Ave, Milwaukee, WI 53210
$-1,586
Cash flow
-20.7%
Cash-on-Cash Return
1.4%
Cap rate
0.3%
Rent to Value Ratio

Active
$2,799,000
4
bds
|
0
ba
|
7,026
sqft
|
built
2007
825 N Prospect Ave, Milwaukee, WI 53202
$-18,227
Cash flow
-34.0%
Cash-on-Cash Return
-1.7%
Cap rate
0.2%
Rent to Value Ratio
Active
$220,000
bds
|
0
ba
|
3,082
sqft
|
built
1908
434 N 32nd St, Milwaukee, WI 53208
$-261
Cash flow
-6.2%
Cash-on-Cash Return
4.7%
Cap rate
0.7%
Rent to Value Ratio

Active
$229,000
5
bds
|
0
ba
|
3,968
sqft
|
built
1890
743 N 32nd St, Milwaukee, WI 53208
$47
Cash flow
1.1%
Cash-on-Cash Return
6.4%
Cap rate
0.9%
Rent to Value Ratio
Active
$259,900
2
bds
|
0
ba
|
980
sqft
|
built
1901
270 E Highland Ave, Milwaukee, WI 53202
$-617
Cash flow
-12.4%
Cash-on-Cash Return
3.3%
Cap rate
0.7%
Rent to Value Ratio
Active
$187,000
1
bds
|
0
ba
|
780
sqft
|
built
1854
715 N Milwaukee St, Milwaukee, WI 53202
$-196
Cash flow
-5.5%
Cash-on-Cash Return
4.9%
Cap rate
0.9%
Rent to Value Ratio
Active
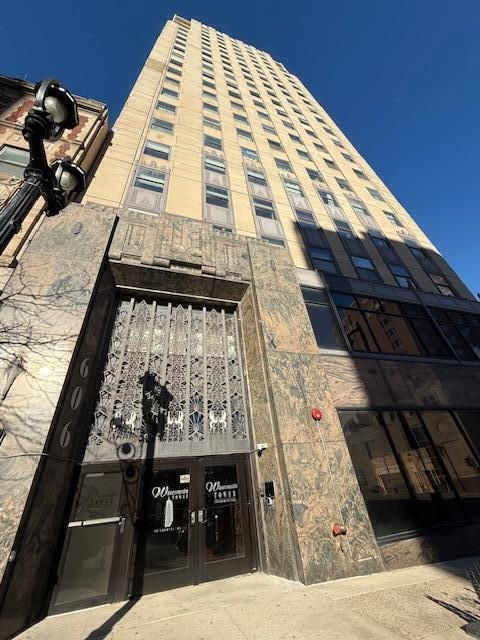
$222,000
1
bds
|
0
ba
|
1,002
sqft
|
built
1929
606 W Wisconsin Ave, Milwaukee, WI 53203
$-265
Cash flow
-6.2%
Cash-on-Cash Return
4.7%
Cap rate
0.8%
Rent to Value Ratio
Active
$379,000
2
bds
|
0
ba
|
1,145
sqft
|
built
1991
1660 N Prospect Ave, Milwaukee, WI 53202
$-1,300
Cash flow
-17.9%
Cash-on-Cash Return
2.0%
Cap rate
0.5%
Rent to Value Ratio

Active
$204,900
3
bds
|
0
ba
|
1,508
sqft
|
built
1950
4354 N 63rd St, Milwaukee, WI 53216
$-256
Cash flow
-6.5%
Cash-on-Cash Return
4.7%
Cap rate
0.8%
Rent to Value Ratio
Active
$549,900
4
bds
|
0
ba
|
2,306
sqft
|
built
1924
1500 E Oklahoma Ave, Milwaukee, WI 53207
$-2,386
Cash flow
-22.6%
Cash-on-Cash Return
0.9%
Cap rate
0.4%
Rent to Value Ratio
Active
$240,000
3
bds
|
0
ba
|
1,204
sqft
|
built
1955
6610 W Montana St, Milwaukee, WI 53219
$-474
Cash flow
-10.3%
Cash-on-Cash Return
3.8%
Cap rate
0.7%
Rent to Value Ratio
Active
$399,000
1
bds
|
0
ba
|
1,108
sqft
|
built
2006
106 W Seeboth St, Milwaukee, WI 53204
$-1,159
Cash flow
-15.2%
Cash-on-Cash Return
2.7%
Cap rate
0.6%
Rent to Value Ratio
Active
$366,500
4
bds
|
0
ba
|
1,902
sqft
|
built
1963
6108 S 18th St, Milwaukee, WI 53221
$-1,124
Cash flow
-16.0%
Cash-on-Cash Return
2.5%
Cap rate
0.5%
Rent to Value Ratio
Active
$184,500
3
bds
|
0
ba
|
1,073
sqft
|
built
1949
4877 N 40th St, Milwaukee, WI 53209
$-372
Cash flow
-10.5%
Cash-on-Cash Return
3.7%
Cap rate
0.7%
Rent to Value Ratio

Active
$349,000
3
bds
|
0
ba
|
1,250
sqft
|
built
1906
701 E Lincoln Ave, Milwaukee, WI 53207
$-1,096
Cash flow
-16.4%
Cash-on-Cash Return
2.4%
Cap rate
0.5%
Rent to Value Ratio
Active
$179,900
3
bds
|
0
ba
|
1,413
sqft
|
built
1955
5638 N 35th St, Milwaukee, WI 53209
$82
Cash flow
2.4%
Cash-on-Cash Return
6.7%
Cap rate
1.0%
Rent to Value Ratio