Milwaukee, WI Investment Properties for Sale
Browse homes for sale and investment properties in Milwaukee, WI. Refine your search by price, property type, or more.
Best cash flowing properties in Milwaukee, WI
Active
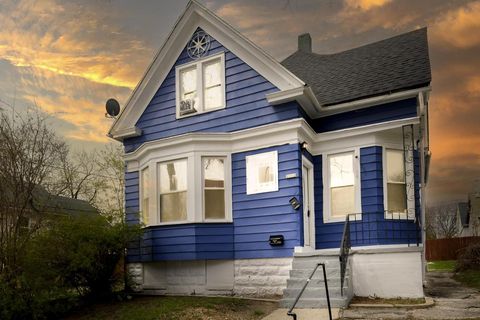
$59,900
3
bds
|
0
ba
|
1,476
sqft
|
built
1891
3550 N 11th St, Milwaukee, WI 53206
$821
Cash flow
16.0%
Cash-on-Cash Return
16.4%
Cap rate
2.3%
Rent to Value Ratio
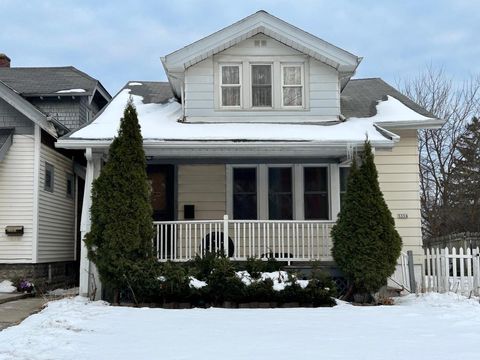
Active
$63,500
1
bds
|
0
ba
|
632
sqft
|
built
1966
9500 N Green Bay Rd, Milwaukee, WI 53209
$682
Cash flow
12.5%
Cash-on-Cash Return
12.9%
Cap rate
1.7%
Rent to Value Ratio
1,062 out of 1,224 properties for sale in Milwaukee, WI
Limited Results Shown
Create a free account, or log in to reveal all property listings and enjoy the complete experience.
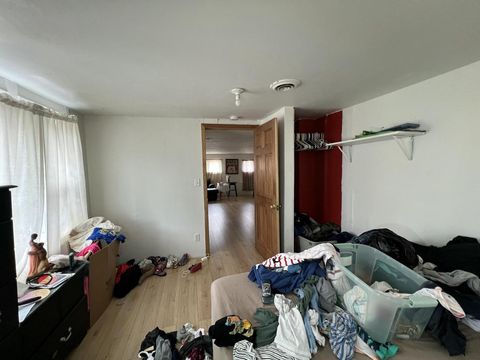
Active
$124,500
4
bds
|
0
ba
|
1,949
sqft
|
built
1924
4689 N 19th St, Milwaukee, WI 53209
$596
Cash flow
25.0%
Cash-on-Cash Return
11.9%
Cap rate
1.6%
Rent to Value Ratio
Active
$429,000
4
bds
|
0
ba
|
3,200
sqft
|
built
1996
12127 W Good Hope Rd, Milwaukee, WI 53224
$-1,173
Cash flow
-14.3%
Cash-on-Cash Return
2.9%
Cap rate
0.6%
Rent to Value Ratio

Active
$475,000
4
bds
|
0
ba
|
3,540
sqft
|
built
1994
6650 N 114th St, Milwaukee, WI 53224
$-1,228
Cash flow
-13.5%
Cash-on-Cash Return
3.0%
Cap rate
0.7%
Rent to Value Ratio
Active
$235,000
3
bds
|
0
ba
|
1,134
sqft
|
built
1959
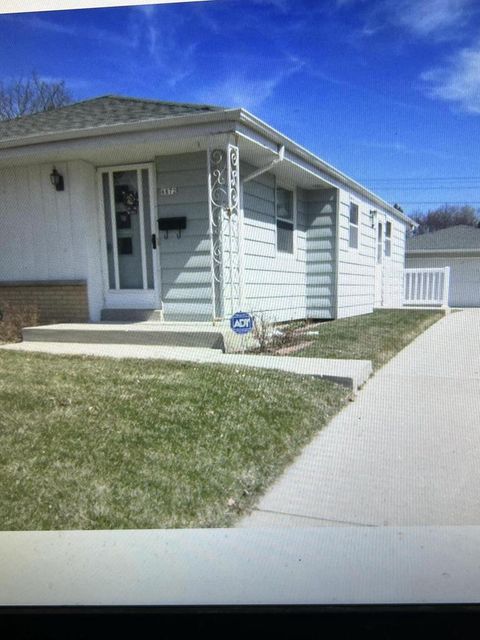
6872 N 40th Pl, Milwaukee, WI 53209
$-389
Cash flow
-8.6%
Cash-on-Cash Return
4.2%
Cap rate
0.7%
Rent to Value Ratio
Active
$180,000
4
bds
|
0
ba
|
2,066
sqft
|
built
1927
3158 N 39th St, Milwaukee, WI 53216
$-479
Cash flow
-13.9%
Cash-on-Cash Return
3.0%
Cap rate
0.5%
Rent to Value Ratio
Active
$251,000
1
bds
|
0
ba
|
1,027
sqft
|
built
1904
3059 N Weil St, Milwaukee, WI 53212
$-742
Cash flow
-15.4%
Cash-on-Cash Return
2.6%
Cap rate
0.5%
Rent to Value Ratio
Active
$215,000
1
bds
|
0
ba
|
1,045
sqft
|
built
1929
606 W Wisconsin Ave, Milwaukee, WI 53203
$-263
Cash flow
-6.4%
Cash-on-Cash Return
4.7%
Cap rate
0.8%
Rent to Value Ratio

Active
$134,000
5
bds
|
0
ba
|
2,257
sqft
|
built
1915
2539 N 45th St, Milwaukee, WI 53210
$-53
Cash flow
-2.1%
Cash-on-Cash Return
5.7%
Cap rate
0.9%
Rent to Value Ratio
Active
$99,000
3
bds
|
0
ba
|
1,054
sqft
|
built
1970
9241 W Allyn St, Milwaukee, WI 53224
$289
Cash flow
15.2%
Cash-on-Cash Return
9.6%
Cap rate
1.4%
Rent to Value Ratio

Active
$199,900
1
bds
|
0
ba
|
860
sqft
|
built
1965
2525 S Shore Dr, Milwaukee, WI 53207
$-193
Cash flow
-5.0%
Cash-on-Cash Return
5.0%
Cap rate
0.8%
Rent to Value Ratio

Active
$575,000
6
bds
|
0
ba
|
2,258
sqft
|
built
1904
2734 N Maryland Ave, Milwaukee, WI 53211
$-1,798
Cash flow
-16.3%
Cash-on-Cash Return
2.4%
Cap rate
0.4%
Rent to Value Ratio
Active
$339,900
4
bds
|
0
ba
|
2,246
sqft
|
built
1928
2116 N 60th St, Milwaukee, WI 53208
$-1,326
Cash flow
-20.4%
Cash-on-Cash Return
1.5%
Cap rate
0.4%
Rent to Value Ratio
Active
$120,000
2
bds
|
0
ba
|
897
sqft
|
built
1980
906 W Montana St, Milwaukee, WI 53215
$-90
Cash flow
-3.9%
Cash-on-Cash Return
5.3%
Cap rate
0.8%
Rent to Value Ratio

Active
$152,800
4
bds
|
0
ba
|
2,068
sqft
|
built
1926
4036 N 25th St, Milwaukee, WI 53209
$-60
Cash flow
-2.0%
Cash-on-Cash Return
5.7%
Cap rate
0.9%
Rent to Value Ratio
Active
$179,900
3
bds
|
0
ba
|
964
sqft
|
built
1955
5463 N 72nd St, Milwaukee, WI 53218
$-239
Cash flow
-6.9%
Cash-on-Cash Return
4.6%
Cap rate
0.7%
Rent to Value Ratio
Active
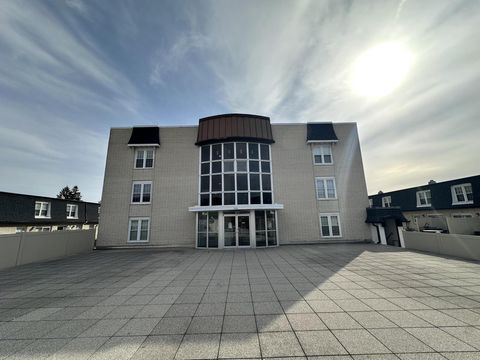
$63,500
1
bds
|
0
ba
|
632
sqft
|
built
1966
9500 N Green Bay Rd, Milwaukee, WI 53209
$682
Cash flow
12.5%
Cash-on-Cash Return
12.9%
Cap rate
1.7%
Rent to Value Ratio
Active
$214,900
4
bds
|
0
ba
|
1,910
sqft
|
built
1910
3124 N Buffum St, Milwaukee, WI 53212
$-353
Cash flow
-8.6%
Cash-on-Cash Return
4.2%
Cap rate
0.6%
Rent to Value Ratio

Active
$249,900
8
bds
|
0
ba
|
2,783
sqft
|
built
1910
2936 S 9th Pl, Milwaukee, WI 53215
$-829
Cash flow
-17.3%
Cash-on-Cash Return
2.2%
Cap rate
0.5%
Rent to Value Ratio
Active
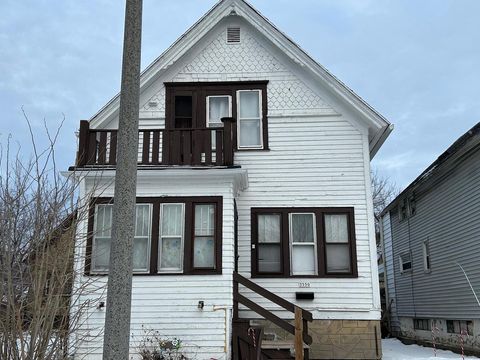
$59,900
3
bds
|
0
ba
|
1,476
sqft
|
built
1891
3550 N 11th St, Milwaukee, WI 53206
$821
Cash flow
16.0%
Cash-on-Cash Return
16.4%
Cap rate
2.3%
Rent to Value Ratio
Active
$725,000
2
bds
|
0
ba
|
1,476
sqft
|
built
2006
106 W Seeboth St, Milwaukee, WI 53204
$-3,231
Cash flow
-23.3%
Cash-on-Cash Return
0.8%
Cap rate
0.3%
Rent to Value Ratio
Active
$113,900
2
bds
|
0
ba
|
672
sqft
|
built
1954
6127 W Carmen Ave, Milwaukee, WI 53218
$-47
Cash flow
-2.2%
Cash-on-Cash Return
5.6%
Cap rate
0.8%
Rent to Value Ratio
Active
$275,000
2
bds
|
0
ba
|
992
sqft
|
built
1893
234 N Broadway, Milwaukee, WI 53202
$-978
Cash flow
-18.6%
Cash-on-Cash Return
1.9%
Cap rate
0.5%
Rent to Value Ratio
Active
$243,900
2
bds
|
0
ba
|
974
sqft
|
built
1983
1108 N Milwaukee St, Milwaukee, WI 53202
$-571
Cash flow
-12.2%
Cash-on-Cash Return
3.3%
Cap rate
0.7%
Rent to Value Ratio
Active
$159,900
4
bds
|
0
ba
|
1,524
sqft
|
built
1901
2111 S 25th St, Milwaukee, WI 53215
$-369
Cash flow
-12.0%
Cash-on-Cash Return
3.4%
Cap rate
0.5%
Rent to Value Ratio

Active
$113,900
2
bds
|
0
ba
|
672
sqft
|
built
1954
5725 N 60th St, Milwaukee, WI 53218
$25
Cash flow
1.1%
Cash-on-Cash Return
6.4%
Cap rate
0.9%
Rent to Value Ratio
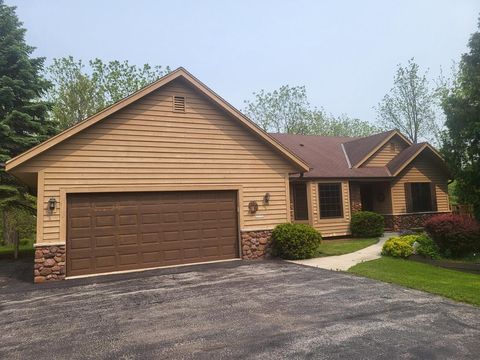
Active
$99,900
4
bds
|
0
ba
|
1,324
sqft
|
built
1924
5354 N 34th St, Milwaukee, WI 53209
$306
Cash flow
16.0%
Cash-on-Cash Return
9.8%
Cap rate
1.4%
Rent to Value Ratio
Active
$179,900
4
bds
|
0
ba
|
1,514
sqft
|
built
1928
4271 N 26th St, Milwaukee, WI 53209
$-1
Cash flow
0.0%
Cash-on-Cash Return
6.1%
Cap rate
0.9%
Rent to Value Ratio
Active
$139,900
3
bds
|
0
ba
|
961
sqft
|
built
1952
4362 N 41st St, Milwaukee, WI 53216
$-96
Cash flow
-3.6%
Cash-on-Cash Return
5.3%
Cap rate
0.9%
Rent to Value Ratio
Active
$155,000
4
bds
|
0
ba
|
1,721
sqft
|
built
1942
4426 W Medford Ave, Milwaukee, WI 53216
$-401
Cash flow
-13.5%
Cash-on-Cash Return
3.0%
Cap rate
0.6%
Rent to Value Ratio

Active
$274,900
2
bds
|
0
ba
|
1,174
sqft
|
built
1965
2525 S Shore Dr, Milwaukee, WI 53207
$-732
Cash flow
-13.9%
Cash-on-Cash Return
3.0%
Cap rate
0.6%
Rent to Value Ratio
Active
$379,000
2
bds
|
0
ba
|
1,125
sqft
|
built
1968
929 N Astor St, Milwaukee, WI 53202
$-1,162
Cash flow
-16.0%
Cash-on-Cash Return
2.5%
Cap rate
0.5%
Rent to Value Ratio

Active
$2,375,000
2
bds
|
0
ba
|
3,761
sqft
|
built
2007
825 N Prospect Ave, Milwaukee, WI 53202
$-12,997
Cash flow
-28.6%
Cash-on-Cash Return
-0.4%
Cap rate
0.2%
Rent to Value Ratio
Active
$174,000
2
bds
|
0
ba
|
803
sqft
|
built
1900
3623 W Mount Vernon Ave, Milwaukee, WI 53208
$-427
Cash flow
-12.8%
Cash-on-Cash Return
3.2%
Cap rate
0.5%
Rent to Value Ratio

Active
$276,000
3
bds
|
0
ba
|
1,597
sqft
|
built
1980
152 W Goldleaf Ave, Milwaukee, WI 53207
$-618
Cash flow
-11.7%
Cash-on-Cash Return
3.5%
Cap rate
0.7%
Rent to Value Ratio

Active
$284,500
2
bds
|
0
ba
|
1,411
sqft
|
built
1949
3663 S Whitnall Ave, Milwaukee, WI 53207
$-469
Cash flow
-8.6%
Cash-on-Cash Return
4.2%
Cap rate
0.7%
Rent to Value Ratio

Active
$259,900
4
bds
|
0
ba
|
1,204
sqft
|
built
1955
3807 S 51st St, Milwaukee, WI 53220
$-547
Cash flow
-11.0%
Cash-on-Cash Return
3.6%
Cap rate
0.6%
Rent to Value Ratio
Active
$195,900
3
bds
|
0
ba
|
1,006
sqft
|
built
1963
6217 W Spokane St, Milwaukee, WI 53223
$-177
Cash flow
-4.7%
Cash-on-Cash Return
5.1%
Cap rate
0.8%
Rent to Value Ratio
Active
$222,000
5
bds
|
0
ba
|
1,719
sqft
|
built
1924
2224 S 33rd St, Milwaukee, WI 53215
$-467
Cash flow
-11.0%
Cash-on-Cash Return
3.6%
Cap rate
0.6%
Rent to Value Ratio

Active
$339,900
4
bds
|
0
ba
|
1,878
sqft
|
built
1949
2745 S 45th St, Milwaukee, WI 53219
$-882
Cash flow
-13.5%
Cash-on-Cash Return
3.0%
Cap rate
0.6%
Rent to Value Ratio

Active
$159,900
3
bds
|
0
ba
|
1,512
sqft
|
built
1994
2200 W Galena St, Milwaukee, WI 53205
$-56
Cash flow
-1.8%
Cash-on-Cash Return
5.7%
Cap rate
1.0%
Rent to Value Ratio