Hennepin County Investment Properties for Sale
Browse homes for sale and investment properties in Hennepin County. Refine your search by price, property type, or more.
Best cash flowing properties in Hennepin County
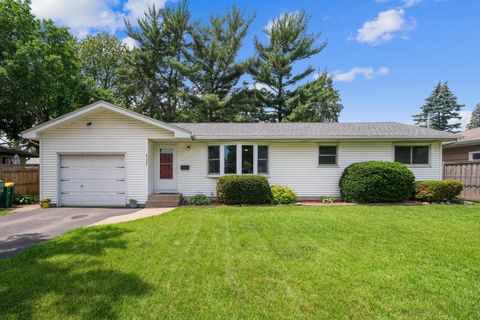
Active
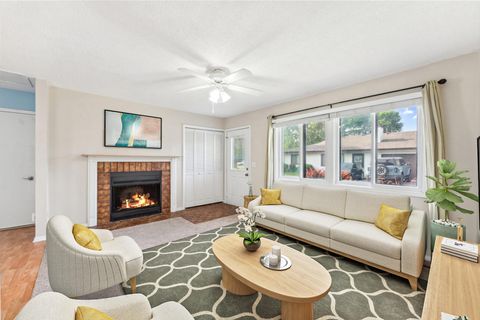
$119,000
1
bds
|
1
ba
|
552
sqft
|
built
1925
4720 Nicollet Ave, Minneapolis, MN 55419
$230
Cash flow
10.1%
Cash-on-Cash Return
8.6%
Cap rate
1.5%
Rent to Value Ratio
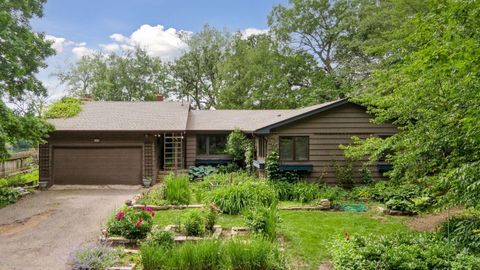
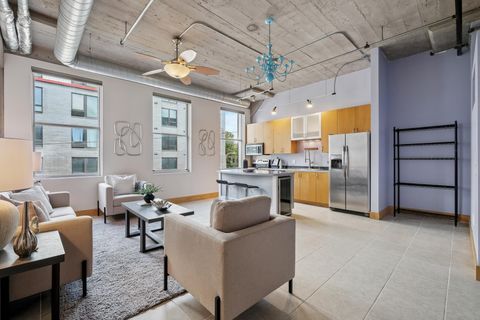
Active
$355,000
3
bds
|
2
ba
|
1,816
sqft
|
built
1951
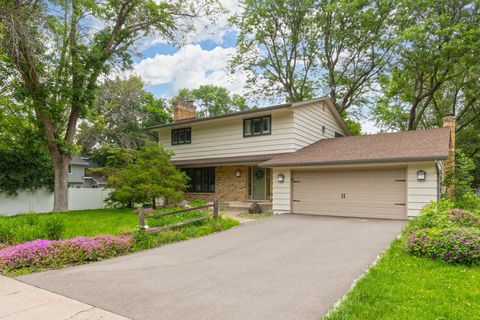
3826 Adair Ave N, Crystal, MN 55422
$-37
Cash flow
-0.5%
Cash-on-Cash Return
5.6%
Cap rate
0.8%
Rent to Value Ratio
1,731 out of 2,199 properties for sale in Hennepin County
Limited Results Shown
Create a free account, or log in to reveal all property listings and enjoy the complete experience.
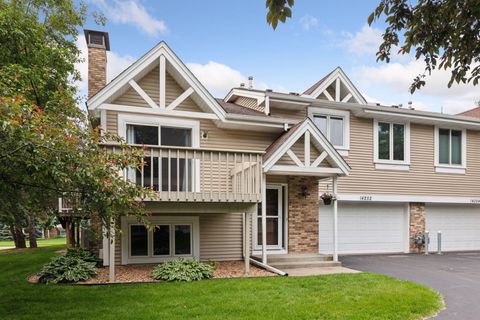
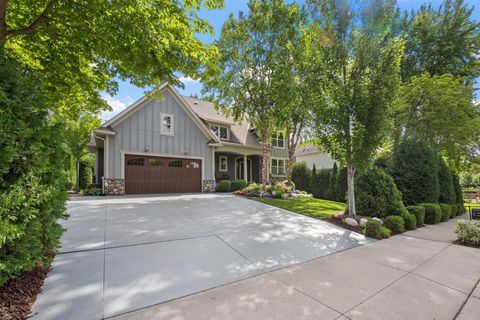
Active
$300,000
3
bds
|
2
ba
|
1,483
sqft
|
built
1985
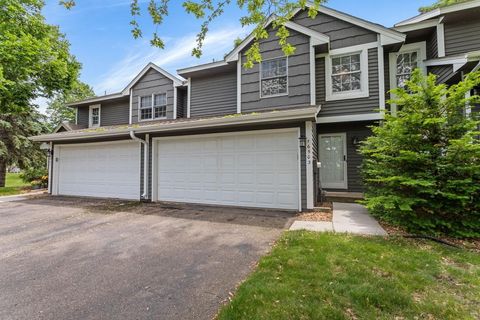
14252 Towers Ln, Eden Prairie, MN 55347
$-555
Cash flow
-9.7%
Cash-on-Cash Return
3.5%
Cap rate
0.8%
Rent to Value Ratio
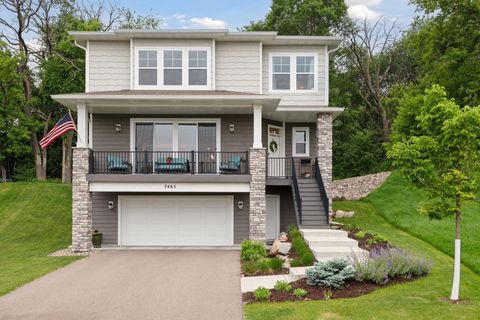
Active
$925,000
3
bds
|
4
ba
|
3,548
sqft
|
built
2021
7465 Glengarry Pl, Eden Prairie, MN 55344
$-1,816
Cash flow
-10.2%
Cash-on-Cash Return
3.3%
Cap rate
0.5%
Rent to Value Ratio
Active
$339,900
2
bds
|
1
ba
|
1,440
sqft
|
built
1950
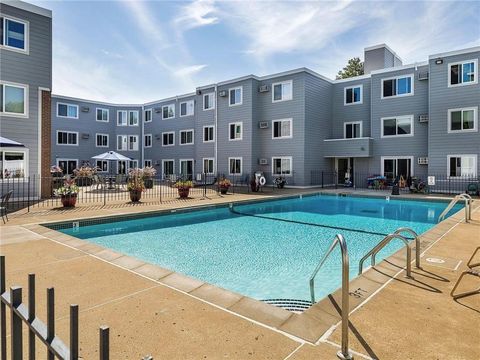
2905 Colorado Ave S, Saint Louis Park, MN 55416
$-318
Cash flow
-4.9%
Cash-on-Cash Return
5.1%
Cap rate
0.8%
Rent to Value Ratio
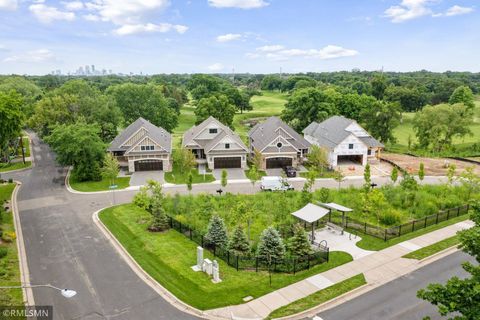
Active
$1,974,800
3
bds
|
3
ba
|
3,546
sqft
|
built
2024
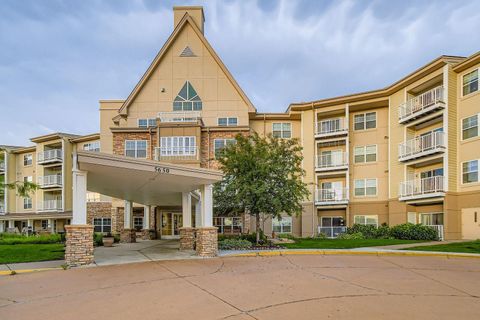
1230 Greenway Pass, Golden Valley, MN 55427
$-4,803
Cash flow
-12.7%
Cash-on-Cash Return
2.8%
Cap rate
0.4%
Rent to Value Ratio
Active
$399,900
2
bds
|
3
ba
|
2,267
sqft
|
built
2002
9260 Blackoaks Ct N, Osseo, MN 55311
$-712
Cash flow
-9.3%
Cash-on-Cash Return
3.5%
Cap rate
0.7%
Rent to Value Ratio
Active
$329,000
4
bds
|
2
ba
|
1,701
sqft
|
built
1980
7409 74th Ave N, Minneapolis, MN 55428
$-209
Cash flow
-3.3%
Cash-on-Cash Return
4.9%
Cap rate
0.8%
Rent to Value Ratio
Active
$189,900
2
bds
|
1
ba
|
726
sqft
|
built
1981
7929 85th Ct N, Brooklyn Park, MN 55445
$-376
Cash flow
-10.3%
Cash-on-Cash Return
3.3%
Cap rate
0.7%
Rent to Value Ratio

Active
$399,900
3
bds
|
2
ba
|
1,569
sqft
|
built
1920
4108 Highwood Rd, Mound, MN 55364
$-186
Cash flow
-2.4%
Cash-on-Cash Return
5.1%
Cap rate
0.7%
Rent to Value Ratio
Active
$219,900
2
bds
|
2
ba
|
1,176
sqft
|
built
1965
19 S 1st St, Minneapolis, MN 55401
$-676
Cash flow
-16.0%
Cash-on-Cash Return
2.0%
Cap rate
1.1%
Rent to Value Ratio
Active
$200,000
2
bds
|
2
ba
|
1,100
sqft
|
built
1985
4385 Trenton Ln N, Plymouth, MN 55442
$-436
Cash flow
-11.4%
Cash-on-Cash Return
3.1%
Cap rate
0.9%
Rent to Value Ratio
Active
$2,500,000
3
bds
|
3
ba
|
1,921
sqft
|
built
1968
5470 Maple Heights Rd, Greenwood, MN 55331
$-10,360
Cash flow
-21.6%
Cash-on-Cash Return
0.7%
Cap rate
0.2%
Rent to Value Ratio
Active
$310,000
4
bds
|
1
ba
|
1,737
sqft
|
built
1959
4337 Colorado Ave N, Crystal, MN 55422
$-284
Cash flow
-4.8%
Cash-on-Cash Return
4.6%
Cap rate
0.7%
Rent to Value Ratio

Active
$179,595
2
bds
|
2
ba
|
1,400
sqft
|
built
1986
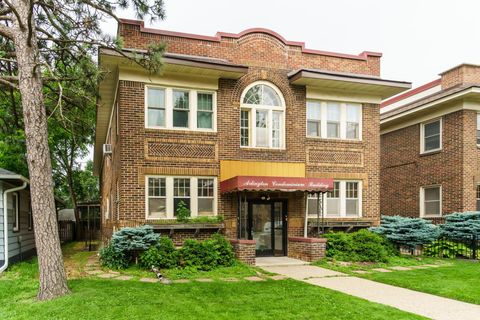
1425 W 28th St, Minneapolis, MN 55408
$-718
Cash flow
-20.9%
Cash-on-Cash Return
0.9%
Cap rate
1.0%
Rent to Value Ratio
Active
$229,000
1
bds
|
1
ba
|
800
sqft
|
built
1923
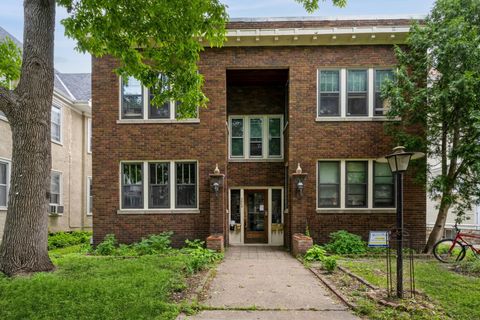
918 3rd St N, Minneapolis, MN 55401
$-578
Cash flow
-13.2%
Cash-on-Cash Return
2.7%
Cap rate
0.9%
Rent to Value Ratio
Active
$2,350,000
4
bds
|
4
ba
|
3,488
sqft
|
built
2012
221 George St, Excelsior, MN 55331
$-10,174
Cash flow
-22.6%
Cash-on-Cash Return
0.5%
Cap rate
0.2%
Rent to Value Ratio
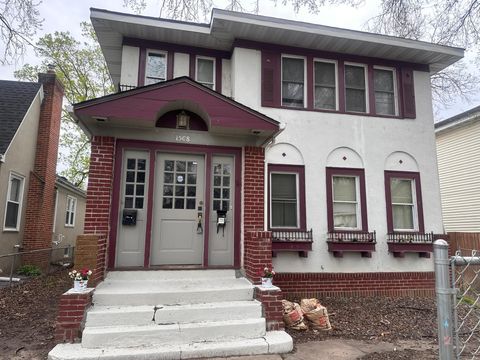
Active
$335,000
6
bds
|
2
ba
|
5,272
sqft
|
built
1900
1508 Oliver Ave N, Minneapolis, MN 55411
$-743
Cash flow
-11.6%
Cash-on-Cash Return
3.0%
Cap rate
0.5%
Rent to Value Ratio
Active
$800,000
4
bds
|
4
ba
|
2,607
sqft
|
built
1969
6521 Gleason Rd, Edina, MN 55439
$-1,795
Cash flow
-11.7%
Cash-on-Cash Return
3.0%
Cap rate
0.5%
Rent to Value Ratio

Active
$525,000
4
bds
|
2
ba
|
1,900
sqft
|
built
1917
3520 32nd Ave S, Minneapolis, MN 55406
$-1,217
Cash flow
-12.1%
Cash-on-Cash Return
2.9%
Cap rate
0.4%
Rent to Value Ratio
Active
$289,900
2
bds
|
2
ba
|
1,250
sqft
|
built
1987
16503 Biscayne Blvd, Eden Prairie, MN 55347
$-657
Cash flow
-11.8%
Cash-on-Cash Return
3.5%
Cap rate
0.8%
Rent to Value Ratio
Active
$199,900
2
bds
|
2
ba
|
960
sqft
|
built
1973
333 8th St SE, Minneapolis, MN 55414
$-560
Cash flow
-14.6%
Cash-on-Cash Return
2.3%
Cap rate
0.9%
Rent to Value Ratio
Active
$145,000
2
bds
|
2
ba
|
1,154
sqft
|
built
2005
5650 Boone Ave N, New Hope, MN 55428
$-689
Cash flow
-24.8%
Cash-on-Cash Return
0.0%
Cap rate
1.2%
Rent to Value Ratio
Active
$524,900
3
bds
|
2
ba
|
2,847
sqft
|
built
1960
7924 W River Rd, Brooklyn Park, MN 55444
$-1,108
Cash flow
-11.0%
Cash-on-Cash Return
3.1%
Cap rate
0.5%
Rent to Value Ratio
Active
$635,000
4
bds
|
3
ba
|
2,312
sqft
|
built
1976
575 N Branch Rd, Maple Plain, MN 55359
$-968
Cash flow
-8.0%
Cash-on-Cash Return
3.8%
Cap rate
0.6%
Rent to Value Ratio
Active
$465,000
3
bds
|
2
ba
|
2,110
sqft
|
built
1974
303 Heather Ln, Long Lake, MN 55356
$-415
Cash flow
-4.7%
Cash-on-Cash Return
4.6%
Cap rate
0.7%
Rent to Value Ratio
Active
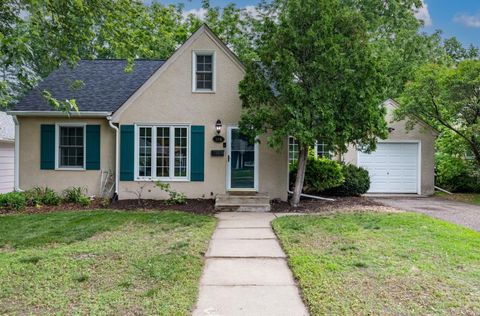
$324,900
3
bds
|
1
ba
|
1,667
sqft
|
built
1913
613 W 38th St, Minneapolis, MN 55409
$-168
Cash flow
-2.7%
Cash-on-Cash Return
5.1%
Cap rate
0.7%
Rent to Value Ratio

Active
$345,000
7
bds
|
3
ba
|
1,729
sqft
|
built
1900
344 16th Ave NE, Minneapolis, MN 55413
$-248
Cash flow
-3.8%
Cash-on-Cash Return
4.8%
Cap rate
0.8%
Rent to Value Ratio
Active
$525,000
3
bds
|
2
ba
|
1,947
sqft
|
built
1929
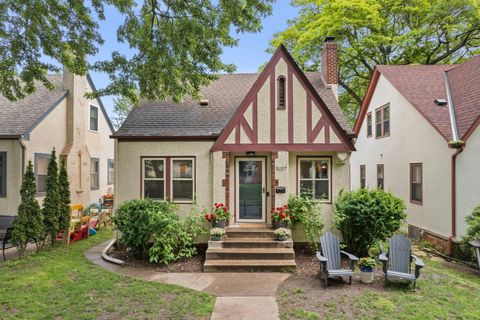
5227 10th Ave S, Minneapolis, MN 55417
$-881
Cash flow
-8.8%
Cash-on-Cash Return
3.7%
Cap rate
0.6%
Rent to Value Ratio
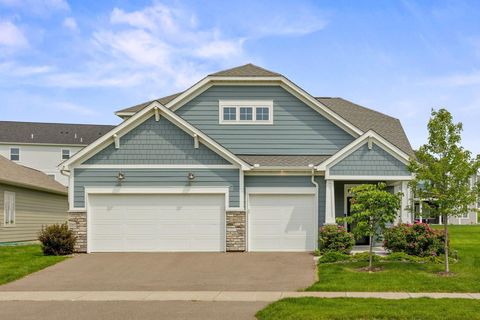
Active
$549,000
3
bds
|
3
ba
|
2,743
sqft
|
built
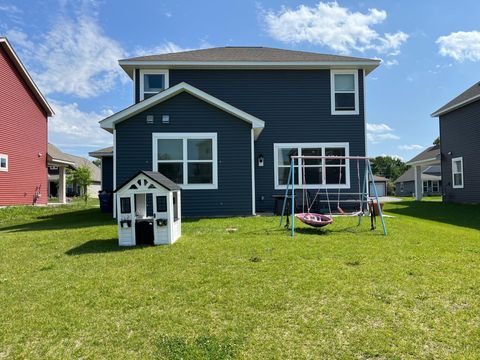
2022
14645 Cloquet St, Dayton, MN 55327
$-801
Cash flow
-7.6%
Cash-on-Cash Return
3.9%
Cap rate
0.7%
Rent to Value Ratio
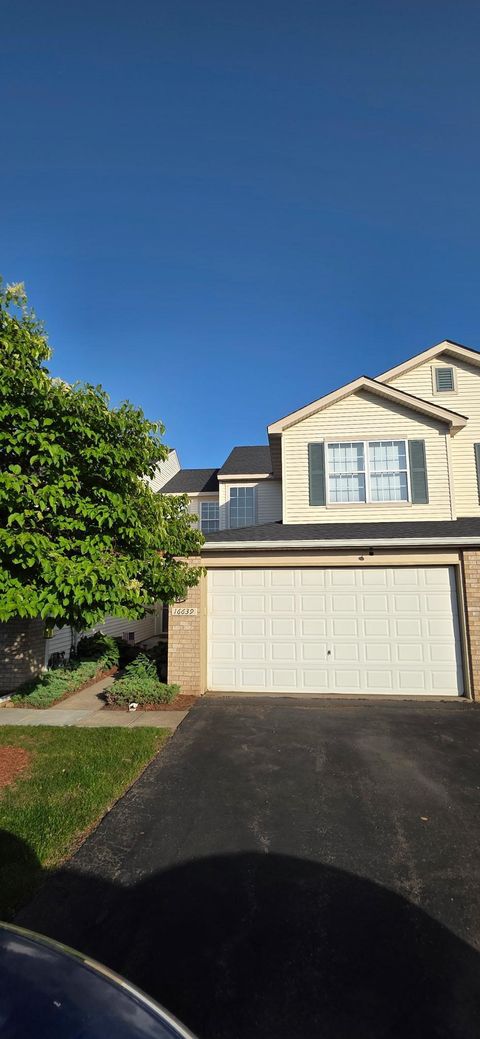
Active
$285,000
2
bds
|
2
ba
|
1,705
sqft
|
built
2000
16639 90th Ave N, Maple Grove, MN 55311
$-337
Cash flow
-6.2%
Cash-on-Cash Return
4.8%
Cap rate
0.9%
Rent to Value Ratio
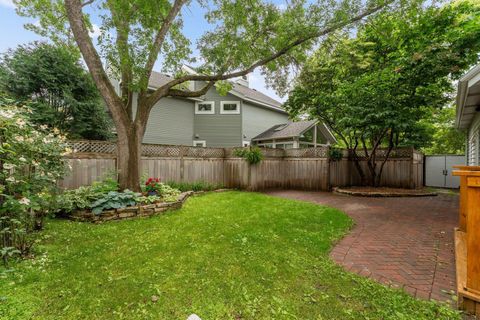
Active
$500,000
3
bds
|
3
ba
|
2,038
sqft
|
built
1992
15655 17th Pl N, Plymouth, MN 55447
$-1,100
Cash flow
-11.5%
Cash-on-Cash Return
3.6%
Cap rate
0.6%
Rent to Value Ratio
Active
$235,000
2
bds
|
1
ba
|
1,072
sqft
|
built
1916
2545 Bryant Ave S, Minneapolis, MN 55405
$-489
Cash flow
-10.9%
Cash-on-Cash Return
3.2%
Cap rate
0.8%
Rent to Value Ratio
Active
$440,000
4
bds
|
3
ba
|
1,907
sqft
|
built
2022
11242 131st Ave N, Dayton, MN 55327
$-359
Cash flow
-4.3%
Cash-on-Cash Return
4.7%
Cap rate
0.7%
Rent to Value Ratio
Active
$99,900
1
bds
|
1
ba
|
812
sqft
|
built
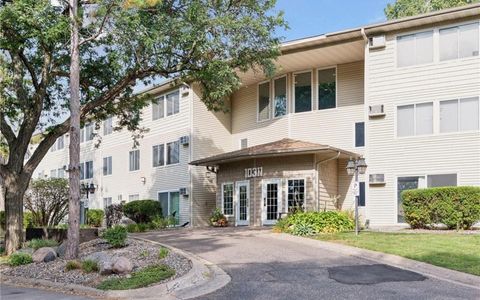
1969
10311 Cedar Lake Rd, Minnetonka, MN 55305
$-175
Cash flow
-9.1%
Cash-on-Cash Return
4.1%
Cap rate
1.4%
Rent to Value Ratio
Active
$289,900
3
bds
|
2
ba
|
1,618
sqft
|
built
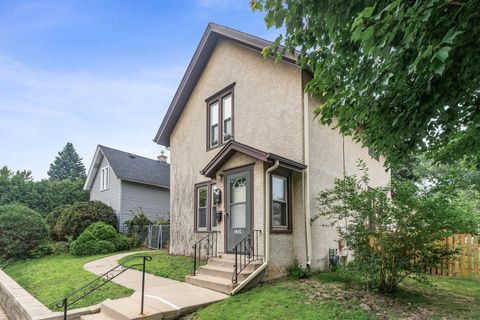
1900
1314 Washington St NE, Minneapolis, MN 55413
$-320
Cash flow
-5.8%
Cash-on-Cash Return
4.4%
Cap rate
0.7%
Rent to Value Ratio
Active
$300,000
3
bds
|
2
ba
|
1,517
sqft
|
built
1985
13704 85th Ave N, Maple Grove, MN 55369
$-443
Cash flow
-7.7%
Cash-on-Cash Return
4.5%
Cap rate
0.8%
Rent to Value Ratio
Active
$120,000
1
bds
|
1
ba
|
750
sqft
|
built
1971
4101 Parklawn Ave, Edina, MN 55435
$-385
Cash flow
-16.7%
Cash-on-Cash Return
1.8%
Cap rate
1.2%
Rent to Value Ratio
Active
$249,000
2
bds
|
1
ba
|
845
sqft
|
built
1951
6289 Edgewood Ave N, Brooklyn Park, MN 55428
$-160
Cash flow
-3.4%
Cash-on-Cash Return
4.9%
Cap rate
0.7%
Rent to Value Ratio
Active
$739,000
5
bds
|
2
ba
|
3,454
sqft
|
built
1932
5341 Nicollet Ave, Minneapolis, MN 55419
$-2,564
Cash flow
-18.1%
Cash-on-Cash Return
1.5%
Cap rate
0.3%
Rent to Value Ratio