Olmsted County Investment Properties for Sale
Browse homes for sale and investment properties in Olmsted County. Refine your search by price, property type, or more.
Best cash flowing properties in Olmsted County
Active
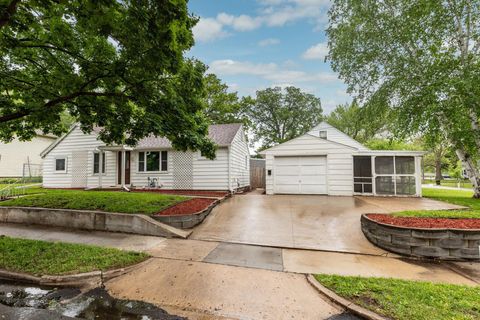
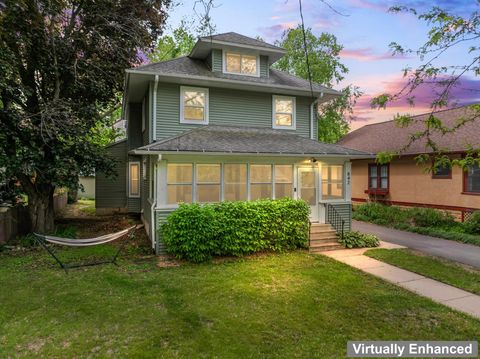
$224,900
4
bds
|
1
ba
|
1,288
sqft
|
built
1900
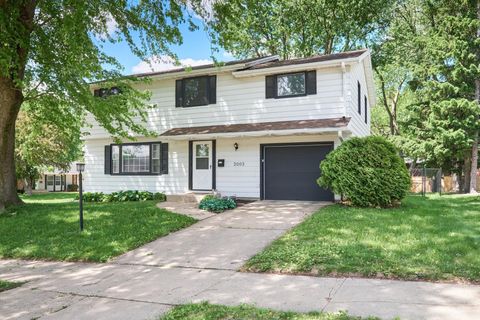
432 12th Ave SE, Rochester, MN 55904
$113
Cash flow
2.6%
Cash-on-Cash Return
6.3%
Cap rate
0.9%
Rent to Value Ratio
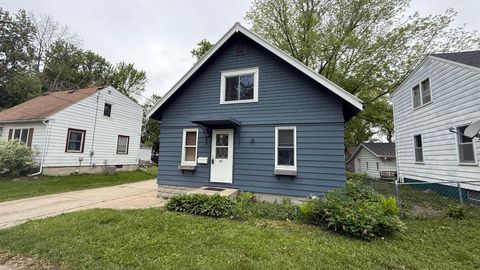
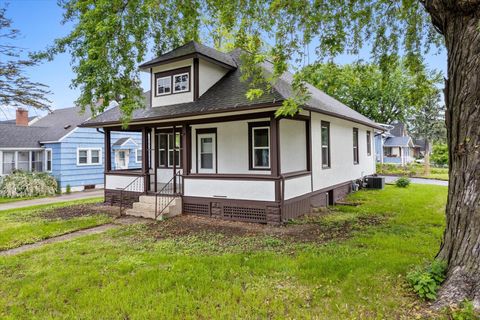
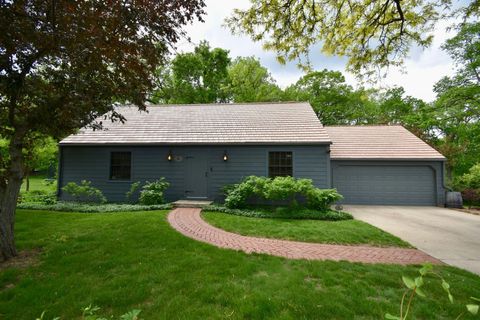
Active
$229,900
3
bds
|
1
ba
|
1,431
sqft
|
built
1922
707 11th Ave SE, Rochester, MN 55904
$98
Cash flow
2.2%
Cash-on-Cash Return
6.2%
Cap rate
0.9%
Rent to Value Ratio
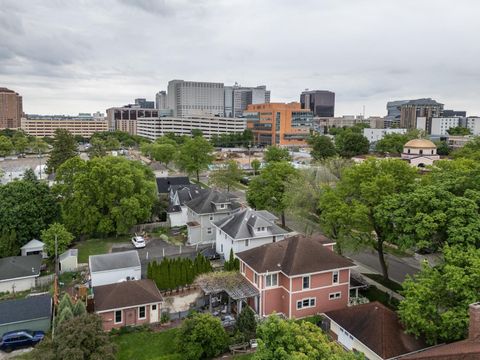
282 out of 436 properties for sale in Olmsted County
Limited Results Shown
Create a free account, or log in to reveal all property listings and enjoy the complete experience.
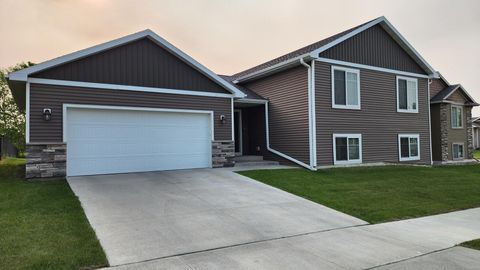
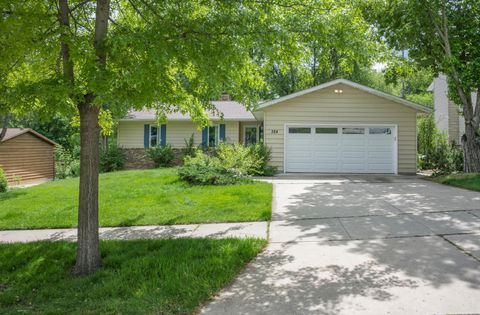
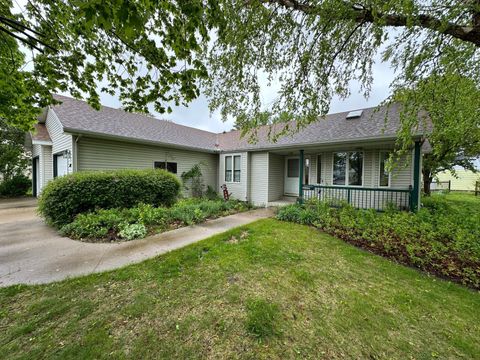
Active
$410,000
4
bds
|
2
ba
|
2,176
sqft
|
built
2018
5687 Prosper Ave NW, Rochester, MN 55901
$-304
Cash flow
-3.9%
Cash-on-Cash Return
4.8%
Cap rate
0.7%
Rent to Value Ratio
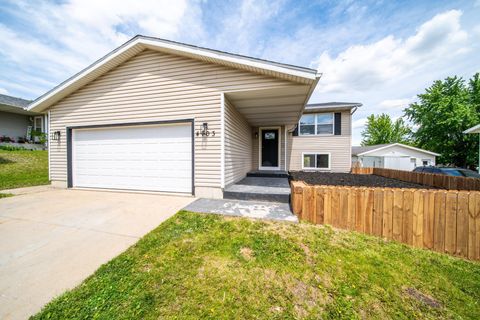
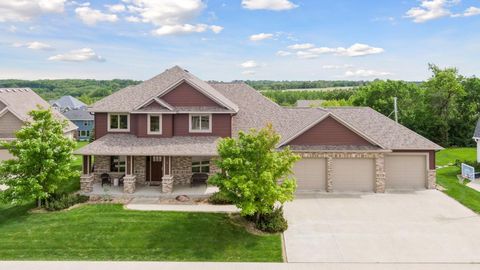
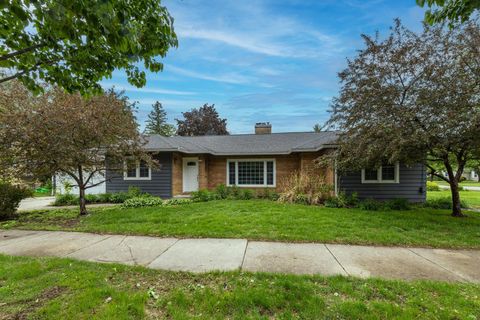
Active
$374,995
4
bds
|
2
ba
|
2,040
sqft
|
built
2001
4703 7th St NW, Rochester, MN 55901
$-546
Cash flow
-7.6%
Cash-on-Cash Return
3.9%
Cap rate
0.6%
Rent to Value Ratio
Active
$230,000
2
bds
|
2
ba
|
1,176
sqft
|
built
1985
1824 Lakeview Ct SW, Rochester, MN 55902
$-337
Cash flow
-7.6%
Cash-on-Cash Return
3.9%
Cap rate
0.9%
Rent to Value Ratio
Active
$544,000
4
bds
|
3
ba
|
1,812
sqft
|
built
1949
828 11th St SW, Rochester, MN 55902
$-981
Cash flow
-9.4%
Cash-on-Cash Return
3.5%
Cap rate
0.6%
Rent to Value Ratio
Active
$1,900,000
5
bds
|
5
ba
|
6,298
sqft
|
built
1973
5510 Heather Dr SW, Rochester, MN 55902
$-6,162
Cash flow
-16.9%
Cash-on-Cash Return
1.8%
Cap rate
0.3%
Rent to Value Ratio
Active
$285,000
3
bds
|
2
ba
|
1,365
sqft
|
built
1918
2139 19th St NW, Rochester, MN 55901
$-45
Cash flow
-0.8%
Cash-on-Cash Return
5.5%
Cap rate
0.8%
Rent to Value Ratio
Active
$419,000
4
bds
|
2
ba
|
3,073
sqft
|
built
1914
842 2nd St NW, Rochester, MN 55901
$-496
Cash flow
-6.2%
Cash-on-Cash Return
4.3%
Cap rate
0.6%
Rent to Value Ratio
Active
$269,900
3
bds
|
2
ba
|
1,168
sqft
|
built
1920
402 11th Ave NE, Rochester, MN 55906
$-150
Cash flow
-2.9%
Cash-on-Cash Return
5.0%
Cap rate
0.7%
Rent to Value Ratio
Active
$424,900
4
bds
|
3
ba
|
2,991
sqft
|
built
1986
324 Meadow Run Dr SW, Rochester, MN 55902
$-309
Cash flow
-3.8%
Cash-on-Cash Return
4.8%
Cap rate
0.7%
Rent to Value Ratio
Active
$989,000
6
bds
|
4
ba
|
4,254
sqft
|
built
2011
2304 Britwood Ln SW, Rochester, MN 55902
$-3,017
Cash flow
-15.9%
Cash-on-Cash Return
2.0%
Cap rate
0.4%
Rent to Value Ratio
Active
$674,900
4
bds
|
3
ba
|
2,563
sqft
|
built
1961
2645 Riverside Ln NE, Rochester, MN 55906
$-1,848
Cash flow
-14.3%
Cash-on-Cash Return
2.4%
Cap rate
0.4%
Rent to Value Ratio
Active
$630,000
4
bds
|
3
ba
|
2,416
sqft
|
built
1919
727 1st St NW, Rochester, MN 55901
$-1,370
Cash flow
-11.3%
Cash-on-Cash Return
3.1%
Cap rate
0.5%
Rent to Value Ratio
Active
$340,000
3
bds
|
2
ba
|
1,414
sqft
|
built
1994
112 Sprie Ct SE, Pine Island, MN 55963
$-279
Cash flow
-4.3%
Cash-on-Cash Return
4.7%
Cap rate
0.7%
Rent to Value Ratio
Active
$389,900
4
bds
|
2
ba
|
2,316
sqft
|
built
1946
705 10th St SW, Rochester, MN 55902
$-388
Cash flow
-5.2%
Cash-on-Cash Return
4.5%
Cap rate
0.7%
Rent to Value Ratio
Active
$650,000
4
bds
|
3
ba
|
3,539
sqft
|
built
2010
1121 Maplebeck Enclave NE, Byron, MN 55920
$-1,458
Cash flow
-11.7%
Cash-on-Cash Return
3.0%
Cap rate
0.6%
Rent to Value Ratio
Active
$825,000
4
bds
|
3
ba
|
3,634
sqft
|
built
2010
4051 Autumn Lake Ct SW, Rochester, MN 55902
$-2,494
Cash flow
-15.8%
Cash-on-Cash Return
2.1%
Cap rate
0.4%
Rent to Value Ratio
Active
$289,500
3
bds
|
2
ba
|
1,592
sqft
|
built
2003
1268 Sundance Ct NE, Byron, MN 55920
$-378
Cash flow
-6.8%
Cash-on-Cash Return
4.1%
Cap rate
0.8%
Rent to Value Ratio
Active
$516,000
3
bds
|
3
ba
|
2,807
sqft
|
built
1999
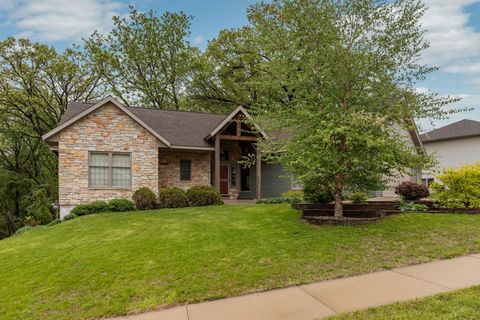
1101 Golfers Ct SE, Rochester, MN 55904
$-843
Cash flow
-8.5%
Cash-on-Cash Return
3.7%
Cap rate
0.6%
Rent to Value Ratio
Active
$499,000
4
bds
|
3
ba
|
2,689
sqft
|
built
2004
2373 Tee Time Rd SE, Rochester, MN 55904
$-890
Cash flow
-9.3%
Cash-on-Cash Return
3.5%
Cap rate
0.6%
Rent to Value Ratio

Active
$509,900
5
bds
|
3
ba
|
2,808
sqft
|
built
2019
4594 Buckingham Dr NW, Rochester, MN 55901
$-696
Cash flow
-7.1%
Cash-on-Cash Return
4.0%
Cap rate
0.6%
Rent to Value Ratio
Active
$310,000
4
bds
|
2
ba
|
2,125
sqft
|
built
1963
2003 20th Ave NW, Rochester, MN 55901
$-129
Cash flow
-2.2%
Cash-on-Cash Return
5.2%
Cap rate
0.7%
Rent to Value Ratio
Active
$575,000
5
bds
|
4
ba
|
3,374
sqft
|
built
2004
2320 Crimson Ridge Cir NW, Rochester, MN 55901
$-848
Cash flow
-7.7%
Cash-on-Cash Return
3.9%
Cap rate
0.6%
Rent to Value Ratio
Active
$579,761
4
bds
|
3
ba
|
2,692
sqft
|
built
2025
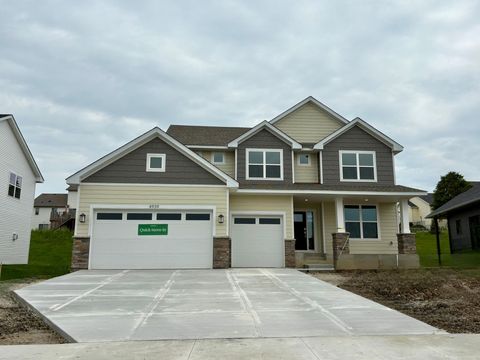
4939 Noble Ln NW, Rochester, MN 55901
$-1,226
Cash flow
-11.0%
Cash-on-Cash Return
3.1%
Cap rate
0.4%
Rent to Value Ratio
Active
$764,000
3
bds
|
3
ba
|
2,744
sqft
|
built
1990
9420 Fabian St NE, Byron, MN 55920
$-2,075
Cash flow
-14.2%
Cash-on-Cash Return
2.4%
Cap rate
0.4%
Rent to Value Ratio
Active
$449,900
4
bds
|
4
ba
|
3,154
sqft
|
built
1993
4822 3rd St NW, Rochester, MN 55901
$-595
Cash flow
-6.9%
Cash-on-Cash Return
4.1%
Cap rate
0.6%
Rent to Value Ratio
Active
$799,900
5
bds
|
4
ba
|
3,960
sqft
|
built
2006
2441 Rosewood Ln SW, Rochester, MN 55902
$-1,995
Cash flow
-13.0%
Cash-on-Cash Return
2.7%
Cap rate
0.4%
Rent to Value Ratio

Active
$849,900
4
bds
|
3
ba
|
2,747
sqft
|
built
1916
503 14th Ave SW, Rochester, MN 55902
$-2,264
Cash flow
-13.9%
Cash-on-Cash Return
2.5%
Cap rate
0.4%
Rent to Value Ratio
Active
$399,900
3
bds
|
3
ba
|
2,201
sqft
|
built
2000
2023 Woodcrest Ln SW, Rochester, MN 55902
$-480
Cash flow
-6.3%
Cash-on-Cash Return
4.2%
Cap rate
0.6%
Rent to Value Ratio
Active
$549,000
4
bds
|
4
ba
|
3,370
sqft
|
built
2001
2714 Colleen St NE, Rochester, MN 55906
$-860
Cash flow
-8.2%
Cash-on-Cash Return
3.8%
Cap rate
0.6%
Rent to Value Ratio
Active
$210,000
2
bds
|
2
ba
|
1,222
sqft
|
built
1969
207 5th Ave SW, Rochester, MN 55902
$-962
Cash flow
-23.9%
Cash-on-Cash Return
0.2%
Cap rate
1.0%
Rent to Value Ratio
Active
$309,900
2
bds
|
3
ba
|
1,680
sqft
|
built
2006
2117 Coopers Pl SE, Rochester, MN 55904
$-440
Cash flow
-7.4%
Cash-on-Cash Return
4.0%
Cap rate
0.7%
Rent to Value Ratio
Active
$920,000
4
bds
|
4
ba
|
4,361
sqft
|
built
2006
1315 Wicklow Ln SW, Rochester, MN 55902
$-2,357
Cash flow
-13.4%
Cash-on-Cash Return
2.6%
Cap rate
0.5%
Rent to Value Ratio

Active
$599,900
4
bds
|
4
ba
|
3,318
sqft
|
built
1985
2513 Aspen Ln SW, Rochester, MN 55902
$-1,406
Cash flow
-12.2%
Cash-on-Cash Return
2.9%
Cap rate
0.5%
Rent to Value Ratio

Active
$300,000
3
bds
|
2
ba
|
1,753
sqft
|
built
1987
2838 Riverwood Ln NW, Rochester, MN 55901
$-417
Cash flow
-7.3%
Cash-on-Cash Return
4.0%
Cap rate
0.8%
Rent to Value Ratio
Active
$290,000
3
bds
|
3
ba
|
1,563
sqft
|
built
2017
1217 Sundance Ct NE, Byron, MN 55920
$-339
Cash flow
-6.1%
Cash-on-Cash Return
4.3%
Cap rate
0.8%
Rent to Value Ratio
Active
$400,000
3
bds
|
3
ba
|
2,290
sqft
|
built
2005
455 Manor Ridge Dr NW, Rochester, MN 55901
$-314
Cash flow
-4.1%
Cash-on-Cash Return
4.7%
Cap rate
0.7%
Rent to Value Ratio

Active
$712,500
5
bds
|
3
ba
|
3,122
sqft
|
built
2005
2348 Teakwood Ln SW, Rochester, MN 55902
$-1,608
Cash flow
-11.8%
Cash-on-Cash Return
3.0%
Cap rate
0.5%
Rent to Value Ratio

Active
$680,000
3
bds
|
3
ba
|
2,838
sqft
|
built
2003
2592 Aspen Pl SW, Rochester, MN 55902
$-1,579
Cash flow
-12.1%
Cash-on-Cash Return
2.9%
Cap rate
0.5%
Rent to Value Ratio