Olmsted County Investment Properties for Sale
Browse homes for sale and investment properties in Olmsted County. Refine your search by price, property type, or more.
Best cash flowing properties in Olmsted County
Active
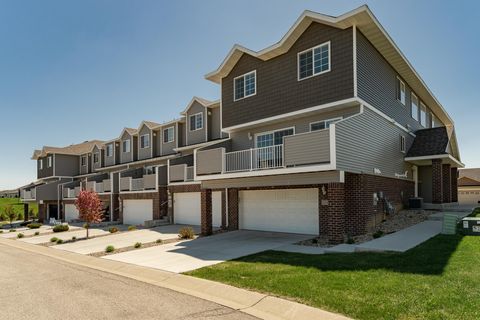
$294,500
3
bds
|
3
ba
|
1,558
sqft
|
built
2017
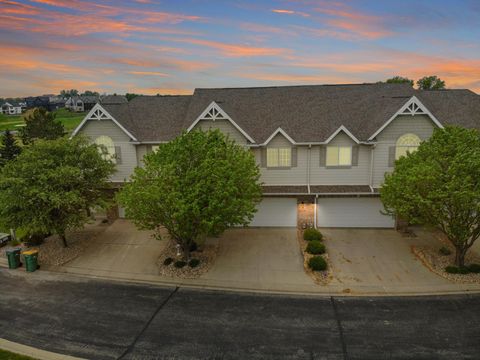
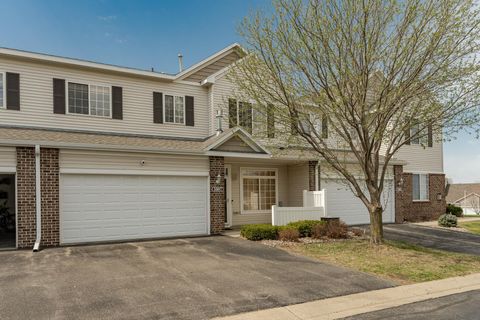
1215 Sundance Ct NE, Byron, MN 55920
$63
Cash flow
1.1%
Cash-on-Cash Return
5.9%
Cap rate
0.8%
Rent to Value Ratio

Active
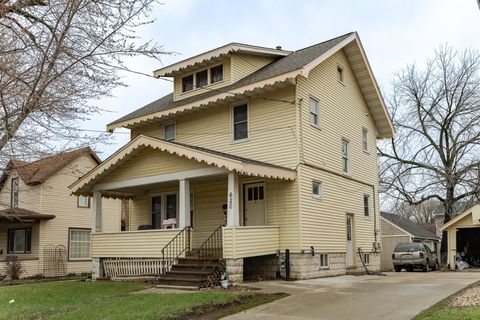
$279,300
3
bds
|
2
ba
|
2,516
sqft
|
built
1965
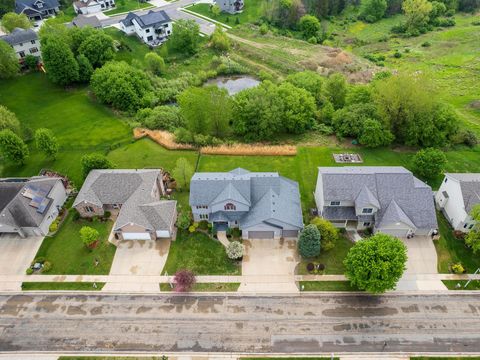
309 Frontier Rd SW, Byron, MN 55920
$59
Cash flow
1.1%
Cash-on-Cash Return
5.9%
Cap rate
0.8%
Rent to Value Ratio
302 out of 478 properties for sale in Olmsted County
Limited Results Shown
Create a free account, or log in to reveal all property listings and enjoy the complete experience.
Active
$294,500
3
bds
|
3
ba
|
1,558
sqft
|
built
2017
1215 Sundance Ct NE, Byron, MN 55920
$63
Cash flow
1.1%
Cash-on-Cash Return
5.9%
Cap rate
0.8%
Rent to Value Ratio
Active
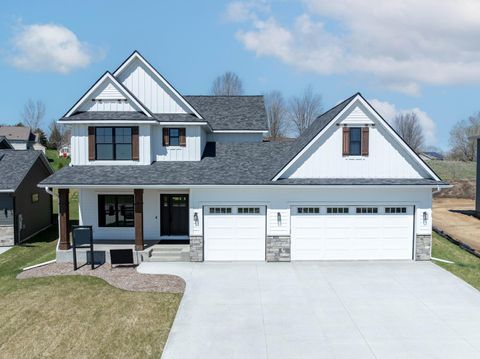
$359,000
3
bds
|
3
ba
|
1,974
sqft
|
built
1998
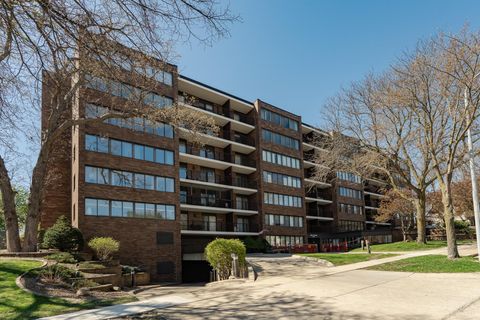
402 25th St SW, Rochester, MN 55902
$-339
Cash flow
-4.9%
Cash-on-Cash Return
4.5%
Cap rate
0.7%
Rent to Value Ratio

Active
$680,000
3
bds
|
3
ba
|
2,838
sqft
|
built
2003
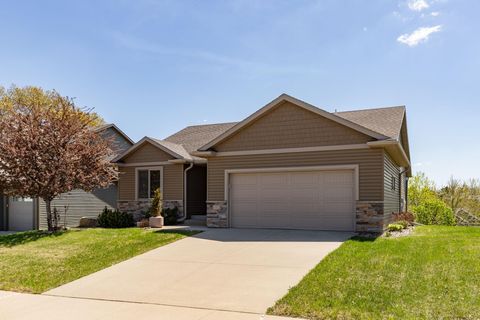
2592 Aspen Pl SW, Rochester, MN 55902
$-1,579
Cash flow
-12.1%
Cash-on-Cash Return
2.9%
Cap rate
0.5%
Rent to Value Ratio

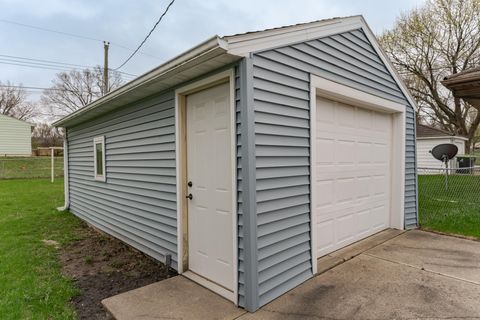
Active
$204,900
2
bds
|
1
ba
|
800
sqft
|
built
1956
1707 Hillview Ln SE, Rochester, MN 55904
$10
Cash flow
0.3%
Cash-on-Cash Return
5.7%
Cap rate
0.8%
Rent to Value Ratio
Active
$325,000
4
bds
|
4
ba
|
2,165
sqft
|
built
2017
5123 Foxfield Dr NW, Rochester, MN 55901
$-398
Cash flow
-6.4%
Cash-on-Cash Return
4.2%
Cap rate
0.8%
Rent to Value Ratio
Active
$499,000
4
bds
|
3
ba
|
2,686
sqft
|
built
2021
1644 Brandt Dr NE, Byron, MN 55920
$-983
Cash flow
-10.3%
Cash-on-Cash Return
3.3%
Cap rate
0.6%
Rent to Value Ratio
Active
$425,000
3
bds
|
3
ba
|
2,522
sqft
|
built
1985
2339 2nd Ave SW, Rochester, MN 55902
$-614
Cash flow
-7.5%
Cash-on-Cash Return
3.9%
Cap rate
0.6%
Rent to Value Ratio
Active
$639,900
5
bds
|
4
ba
|
3,976
sqft
|
built
2005
2163 Neptune Pl SW, Rochester, MN 55902
$-1,014
Cash flow
-8.3%
Cash-on-Cash Return
3.8%
Cap rate
0.6%
Rent to Value Ratio
Active
$584,900
5
bds
|
4
ba
|
3,460
sqft
|
built
2003
2381 Timberwood Ln SW, Rochester, MN 55902
$-1,122
Cash flow
-10.0%
Cash-on-Cash Return
3.4%
Cap rate
0.5%
Rent to Value Ratio

Active
$739,900
4
bds
|
4
ba
|
3,440
sqft
|
built
1986
6385 13th Ave NW, Rochester, MN 55901
$-1,757
Cash flow
-12.4%
Cash-on-Cash Return
2.8%
Cap rate
0.4%
Rent to Value Ratio
Active
$939,900
4
bds
|
3
ba
|
3,824
sqft
|
built
1969
4615 County Road 5 NW, Byron, MN 55920
$-3,262
Cash flow
-18.1%
Cash-on-Cash Return
1.5%
Cap rate
0.2%
Rent to Value Ratio
Active
$359,900
4
bds
|
2
ba
|
1,940
sqft
|
built
2004
5094 King Arthur Dr NW, Rochester, MN 55901
$-350
Cash flow
-5.1%
Cash-on-Cash Return
4.5%
Cap rate
0.7%
Rent to Value Ratio
Active
$349,900
2
bds
|
3
ba
|
2,204
sqft
|
built
2002
1459 Belvior Ln NE, Byron, MN 55920
$-761
Cash flow
-11.3%
Cash-on-Cash Return
3.1%
Cap rate
0.7%
Rent to Value Ratio
Active
$680,000
5
bds
|
4
ba
|
4,017
sqft
|
built
2003
1870 Century Valley Rd NE, Rochester, MN 55906
$-1,735
Cash flow
-13.3%
Cash-on-Cash Return
2.6%
Cap rate
0.5%
Rent to Value Ratio

Active
$629,900
4
bds
|
3
ba
|
2,748
sqft
|
built
2002
2447 Colleen Ln NE, Rochester, MN 55906
$-1,341
Cash flow
-11.1%
Cash-on-Cash Return
3.1%
Cap rate
0.5%
Rent to Value Ratio

Active
$364,900
3
bds
|
3
ba
|
2,075
sqft
|
built
2002
1463 Belvior Ln NE, Byron, MN 55920
$-574
Cash flow
-8.2%
Cash-on-Cash Return
3.8%
Cap rate
0.8%
Rent to Value Ratio
Active
$519,999
2
bds
|
3
ba
|
1,979
sqft
|
built
1979
600 4th St SW, Rochester, MN 55902
$-2,144
Cash flow
-21.5%
Cash-on-Cash Return
0.7%
Cap rate
0.5%
Rent to Value Ratio
Active
$499,000
3
bds
|
3
ba
|
2,692
sqft
|
built
2013
4992 4th St NW, Rochester, MN 55901
$-800
Cash flow
-8.4%
Cash-on-Cash Return
3.8%
Cap rate
0.6%
Rent to Value Ratio
Active
$339,900
3
bds
|
3
ba
|
1,776
sqft
|
built
2023
634 Shardlow Ln NE, Byron, MN 55920
$-427
Cash flow
-6.6%
Cash-on-Cash Return
4.2%
Cap rate
0.8%
Rent to Value Ratio

Active
$250,000
2
bds
|
2
ba
|
1,134
sqft
|
built
1969
207 5th Ave SW, Rochester, MN 55902
$-931
Cash flow
-19.4%
Cash-on-Cash Return
1.2%
Cap rate
0.9%
Rent to Value Ratio
Active
$230,000
3
bds
|
2
ba
|
1,248
sqft
|
built
1918
620 3rd Ave SE, Rochester, MN 55904
$-34
Cash flow
-0.8%
Cash-on-Cash Return
5.5%
Cap rate
0.8%
Rent to Value Ratio
Active
$765,000
3
bds
|
3
ba
|
2,281
sqft
|
built
2023
4951 Noble Ln NW, Rochester, MN 55901
$-2,407
Cash flow
-16.4%
Cash-on-Cash Return
1.9%
Cap rate
0.2%
Rent to Value Ratio
Active
$279,900
3
bds
|
1
ba
|
1,295
sqft
|
built
1958
1340 Elton Hills Dr NW, Rochester, MN 55901
$-313
Cash flow
-5.8%
Cash-on-Cash Return
4.3%
Cap rate
0.6%
Rent to Value Ratio

Active
$519,000
4
bds
|
3
ba
|
3,268
sqft
|
built
1963
1509 Woodland Dr SW, Rochester, MN 55902
$-802
Cash flow
-8.1%
Cash-on-Cash Return
3.8%
Cap rate
0.6%
Rent to Value Ratio
Active
$289,900
3
bds
|
2
ba
|
1,827
sqft
|
built
1957
2309 3rd Ave SW, Rochester, MN 55902
$-36
Cash flow
-0.6%
Cash-on-Cash Return
5.5%
Cap rate
0.8%
Rent to Value Ratio
Active
$1,790,000
4
bds
|
6
ba
|
6,102
sqft
|
built
1997
956 Hunters Point Ln SW, Rochester, MN 55902
$-6,833
Cash flow
-19.9%
Cash-on-Cash Return
1.1%
Cap rate
0.2%
Rent to Value Ratio
Active
$735,000
4
bds
|
3
ba
|
2,931
sqft
|
built
2023
4945 Noble Ln NW, Rochester, MN 55901
$-2,265
Cash flow
-16.1%
Cash-on-Cash Return
2.0%
Cap rate
0.2%
Rent to Value Ratio

Active
$685,000
4
bds
|
3
ba
|
3,358
sqft
|
built
2016
2077 Kerry Dr NE, Rochester, MN 55906
$-449
Cash flow
-3.4%
Cash-on-Cash Return
4.9%
Cap rate
0.7%
Rent to Value Ratio
Active
$223,500
2
bds
|
2
ba
|
1,677
sqft
|
built
2000
720 10th St SW, Pine Island, MN 55963
$-106
Cash flow
-2.5%
Cash-on-Cash Return
5.1%
Cap rate
0.9%
Rent to Value Ratio

Active
$728,000
5
bds
|
4
ba
|
4,604
sqft
|
built
2005
1213 Grey Fox Ave SW, Rochester, MN 55902
$-1,197
Cash flow
-8.6%
Cash-on-Cash Return
3.7%
Cap rate
0.6%
Rent to Value Ratio

Active
$224,900
2
bds
|
2
ba
|
1,280
sqft
|
built
2004
3084 River Falls Ct NW, Rochester, MN 55901
$-56
Cash flow
-1.3%
Cash-on-Cash Return
5.4%
Cap rate
0.9%
Rent to Value Ratio

Active
$795,000
5
bds
|
3
ba
|
4,076
sqft
|
built
1995
1062 23rd Ave SW, Rochester, MN 55902
$-2,096
Cash flow
-13.8%
Cash-on-Cash Return
2.5%
Cap rate
0.5%
Rent to Value Ratio
Active
$279,300
3
bds
|
2
ba
|
2,516
sqft
|
built
1965
309 Frontier Rd SW, Byron, MN 55920
$59
Cash flow
1.1%
Cash-on-Cash Return
5.9%
Cap rate
0.8%
Rent to Value Ratio
Active
$247,500
2
bds
|
2
ba
|
1,528
sqft
|
built
2004
5987 Sandcherry Pl NW, Rochester, MN 55901
$-314
Cash flow
-6.6%
Cash-on-Cash Return
4.2%
Cap rate
0.8%
Rent to Value Ratio

Active
$998,900
4
bds
|
3
ba
|
5,480
sqft
|
built
2000
3065 Grand View Ln SW, Byron, MN 55920
$-2,898
Cash flow
-15.1%
Cash-on-Cash Return
2.2%
Cap rate
0.4%
Rent to Value Ratio
Active
$1,350,000
5
bds
|
5
ba
|
4,737
sqft
|
built
2022
3251 Century Ridge Pl NE, Rochester, MN 55906
$-5,347
Cash flow
-20.7%
Cash-on-Cash Return
0.9%
Cap rate
0.3%
Rent to Value Ratio
Active
$364,000
3
bds
|
3
ba
|
2,155
sqft
|
built
1910
909 E Center St, Rochester, MN 55904
$-137
Cash flow
-2.0%
Cash-on-Cash Return
5.2%
Cap rate
0.8%
Rent to Value Ratio
Active
$725,000
4
bds
|
4
ba
|
3,271
sqft
|
built
1992
3300 65th St NE, Rochester, MN 55906
$-1,665
Cash flow
-12.0%
Cash-on-Cash Return
2.9%
Cap rate
0.4%
Rent to Value Ratio
Active
$389,900
3
bds
|
3
ba
|
2,759
sqft
|
built
2004
3087 Monroe Dr NW, Rochester, MN 55901
$-630
Cash flow
-8.4%
Cash-on-Cash Return
3.7%
Cap rate
0.7%
Rent to Value Ratio

Active
$1,699,999
5
bds
|
5
ba
|
5,710
sqft
|
built
2000
2736 Headland Ct SW, Rochester, MN 55902
$-5,985
Cash flow
-18.4%
Cash-on-Cash Return
1.5%
Cap rate
0.2%
Rent to Value Ratio