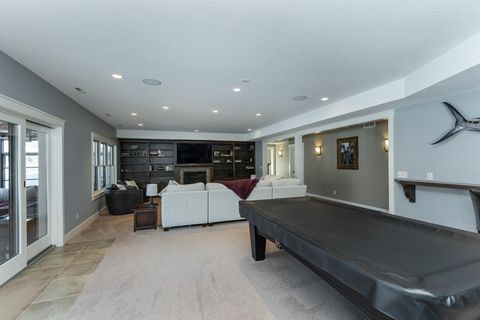
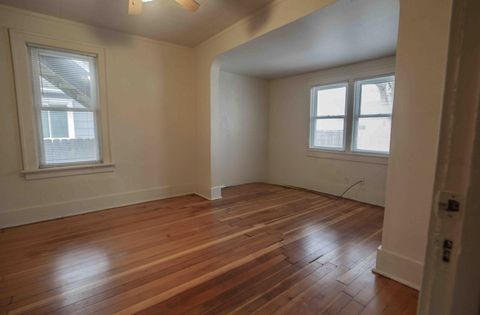
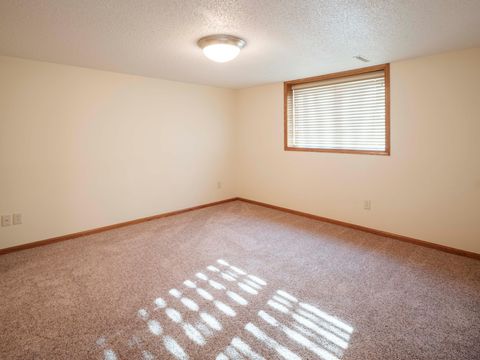
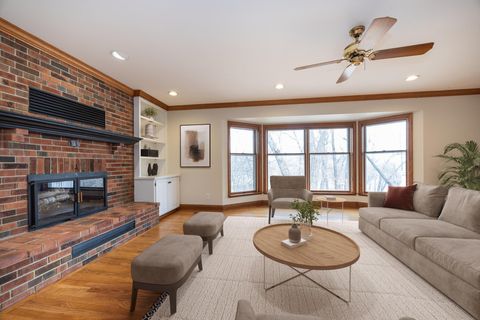
Olmsted County Investment Properties for Sale
Browse homes for sale and investment properties in Olmsted County. Refine your search by price, property type, or more.
Best cash flowing properties in Olmsted County
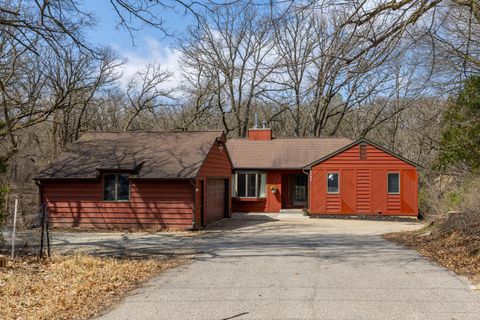
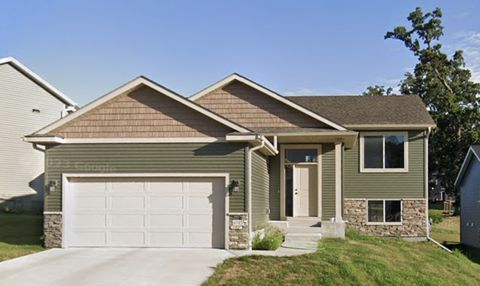
Active
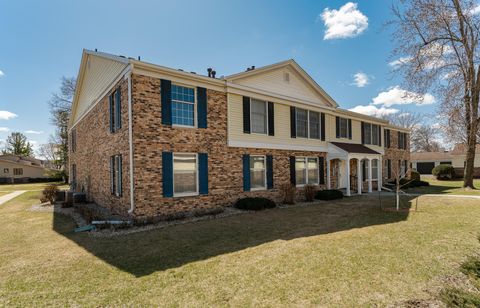
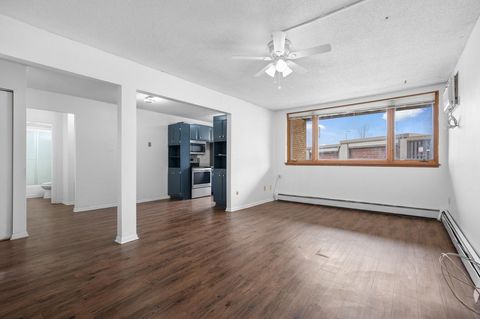
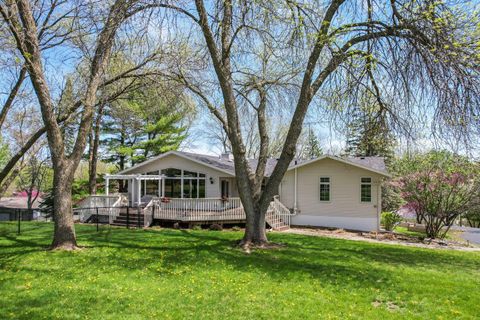
$175,000
3
bds
|
2
ba
|
1,312
sqft
|
built
1974
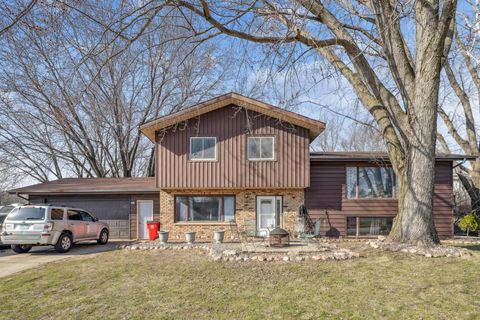
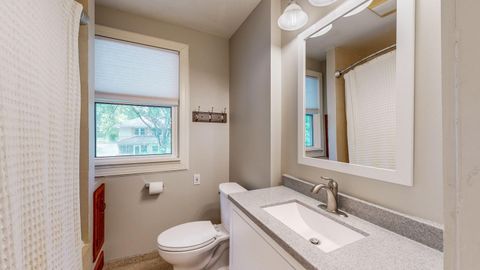
2053 Carriage Dr SW, Rochester, MN 55902
$59
Cash flow
1.8%
Cash-on-Cash Return
6.1%
Cap rate
1.1%
Rent to Value Ratio
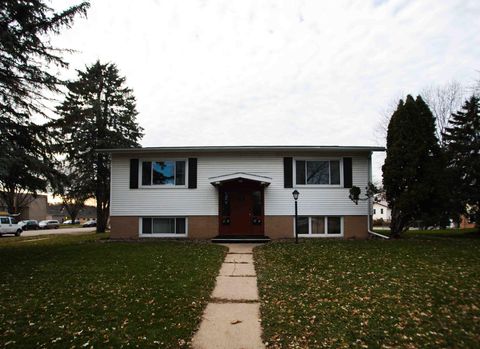
Active
$124,900
2
bds
|
1
ba
|
913
sqft
|
built
1970
1911 Viking Dr NW, Rochester, MN 55901
$-88
Cash flow
-3.7%
Cash-on-Cash Return
4.8%
Cap rate
1.1%
Rent to Value Ratio
302 out of 478 properties for sale in Olmsted County
Limited Results Shown
Create a free account, or log in to reveal all property listings and enjoy the complete experience.
Active
$315,000
2
bds
|
2
ba
|
1,320
sqft
|
built
2004
2810 Talon Pl SE, Rochester, MN 55904
$-502
Cash flow
-8.3%
Cash-on-Cash Return
3.8%
Cap rate
0.7%
Rent to Value Ratio
Active
$674,900
4
bds
|
3
ba
|
3,255
sqft
|
built
2007
3262 Jade Ct NE, Rochester, MN 55906
$-1,662
Cash flow
-12.8%
Cash-on-Cash Return
2.7%
Cap rate
0.5%
Rent to Value Ratio

Active
$419,999
4
bds
|
2
ba
|
2,019
sqft
|
built
2006
3691 44th Ave NW, Rochester, MN 55901
$-521
Cash flow
-6.5%
Cash-on-Cash Return
4.2%
Cap rate
0.6%
Rent to Value Ratio
Active
$525,500
4
bds
|
3
ba
|
2,443
sqft
|
built
1983
2395 18th Ave SW, Rochester, MN 55902
$-914
Cash flow
-9.1%
Cash-on-Cash Return
3.6%
Cap rate
0.6%
Rent to Value Ratio
Active
$269,900
2
bds
|
3
ba
|
2,337
sqft
|
built
1890
606 11th St SE, Rochester, MN 55904
$-171
Cash flow
-3.3%
Cash-on-Cash Return
4.9%
Cap rate
0.7%
Rent to Value Ratio
Active
$799,000
6
bds
|
4
ba
|
4,803
sqft
|
built
2003
3134 Sherburn Pl SW, Rochester, MN 55902
$-2,122
Cash flow
-13.9%
Cash-on-Cash Return
2.5%
Cap rate
0.5%
Rent to Value Ratio
Active
$280,000
2
bds
|
1
ba
|
1,180
sqft
|
built
1921
4163 Horseshoe Ct NE, Rochester, MN 55906
$-144
Cash flow
-2.7%
Cash-on-Cash Return
5.1%
Cap rate
0.7%
Rent to Value Ratio

Active
$489,900
5
bds
|
3
ba
|
2,380
sqft
|
built
2020
6325 Sunset Hill Pl NW, Rochester, MN 55901
$-626
Cash flow
-6.7%
Cash-on-Cash Return
4.1%
Cap rate
0.6%
Rent to Value Ratio

Active
$599,900
4
bds
|
4
ba
|
4,159
sqft
|
built
1987
1404 Woodland Dr SW, Rochester, MN 55902
$-700
Cash flow
-6.1%
Cash-on-Cash Return
4.3%
Cap rate
0.5%
Rent to Value Ratio
Active
$408,500
4
bds
|
3
ba
|
2,100
sqft
|
built
2019
6735 Gaillardia Dr NW, Rochester, MN 55901
$-318
Cash flow
-4.1%
Cash-on-Cash Return
4.7%
Cap rate
0.7%
Rent to Value Ratio
Active
$439,000
7
bds
|
4
ba
|
5,040
sqft
|
built
1968
1351 5th Ave SE, Rochester, MN 55904
$-1,396
Cash flow
-16.6%
Cash-on-Cash Return
1.9%
Cap rate
0.4%
Rent to Value Ratio
Active
$124,900
2
bds
|
1
ba
|
913
sqft
|
built
1970
1911 Viking Dr NW, Rochester, MN 55901
$-88
Cash flow
-3.7%
Cash-on-Cash Return
4.8%
Cap rate
1.1%
Rent to Value Ratio

Active
$499,900
4
bds
|
3
ba
|
2,800
sqft
|
built
2015
1499 Belvior Ln NE, Byron, MN 55920
$-1,330
Cash flow
-13.9%
Cash-on-Cash Return
2.5%
Cap rate
0.6%
Rent to Value Ratio
Active
$675,000
5
bds
|
5
ba
|
5,895
sqft
|
built
2007
6724 Clarkia Dr NW, Rochester, MN 55901
$-1,174
Cash flow
-9.1%
Cash-on-Cash Return
3.6%
Cap rate
0.6%
Rent to Value Ratio

Active
$269,900
3
bds
|
2
ba
|
1,592
sqft
|
built
2004
1254 Sundance Ct NE, Byron, MN 55920
$-416
Cash flow
-8.0%
Cash-on-Cash Return
3.8%
Cap rate
0.7%
Rent to Value Ratio
Active
$280,000
2
bds
|
2
ba
|
1,024
sqft
|
built
1917
949 9th Ave SE, Rochester, MN 55904
$-122
Cash flow
-2.3%
Cash-on-Cash Return
5.2%
Cap rate
0.7%
Rent to Value Ratio

Active
$479,900
4
bds
|
3
ba
|
2,776
sqft
|
built
1992
1000 Rocky Creek Dr NE, Rochester, MN 55906
$-771
Cash flow
-8.4%
Cash-on-Cash Return
3.8%
Cap rate
0.6%
Rent to Value Ratio
Active
$342,000
3
bds
|
3
ba
|
2,299
sqft
|
built
1974
37 9th St NW, Byron, MN 55920
$-270
Cash flow
-4.1%
Cash-on-Cash Return
4.7%
Cap rate
0.7%
Rent to Value Ratio

Active
$991,810
5
bds
|
4
ba
|
2,831
sqft
|
built
1973
1810 Mayowood Rd SW, Rochester, MN 55902
$-3,319
Cash flow
-17.5%
Cash-on-Cash Return
1.7%
Cap rate
0.3%
Rent to Value Ratio

Active
$299,000
2
bds
|
2
ba
|
1,320
sqft
|
built
2006
2110 Coopers Pl SE, Rochester, MN 55904
$-459
Cash flow
-8.0%
Cash-on-Cash Return
3.8%
Cap rate
0.7%
Rent to Value Ratio

Active
$1,300,000
4
bds
|
4
ba
|
5,560
sqft
|
built
2003
1502 Epperstone Enclave, Byron, MN 55920
$-4,913
Cash flow
-19.7%
Cash-on-Cash Return
1.1%
Cap rate
0.3%
Rent to Value Ratio
Active
$659,900
3
bds
|
3
ba
|
3,139
sqft
|
built
1995
499 73rd St NW, Rochester, MN 55901
$-1,441
Cash flow
-11.4%
Cash-on-Cash Return
3.1%
Cap rate
0.5%
Rent to Value Ratio

Active
$414,900
4
bds
|
3
ba
|
2,790
sqft
|
built
1983
1007 20th St NW, Rochester, MN 55901
$-442
Cash flow
-5.6%
Cash-on-Cash Return
4.4%
Cap rate
0.7%
Rent to Value Ratio
Active
$319,900
2
bds
|
2
ba
|
1,061
sqft
|
built
2009
1880 3rd Ave NW, Rochester, MN 55901
$-951
Cash flow
-15.5%
Cash-on-Cash Return
2.1%
Cap rate
0.6%
Rent to Value Ratio
Active
$175,000
3
bds
|
2
ba
|
1,312
sqft
|
built
1974
2053 Carriage Dr SW, Rochester, MN 55902
$59
Cash flow
1.8%
Cash-on-Cash Return
6.1%
Cap rate
1.1%
Rent to Value Ratio
Active
$410,000
3
bds
|
3
ba
|
1,796
sqft
|
built
1929
848 8th Ave SW, Rochester, MN 55902
$-397
Cash flow
-5.1%
Cash-on-Cash Return
4.5%
Cap rate
0.7%
Rent to Value Ratio
Active
$469,900
4
bds
|
2
ba
|
2,285
sqft
|
built
1916
510 6th St SW, Rochester, MN 55902
$-322
Cash flow
-3.6%
Cash-on-Cash Return
4.9%
Cap rate
0.7%
Rent to Value Ratio

Active
$625,000
5
bds
|
5
ba
|
3,969
sqft
|
built
2016
1837 Hadley Creek Dr NE, Rochester, MN 55906
$-1,044
Cash flow
-8.7%
Cash-on-Cash Return
3.7%
Cap rate
0.6%
Rent to Value Ratio
Active
$317,900
2
bds
|
2
ba
|
1,345
sqft
|
built
2001
622 Southern Woods Cir SW, Rochester, MN 55902
$-484
Cash flow
-7.9%
Cash-on-Cash Return
3.9%
Cap rate
0.7%
Rent to Value Ratio
Active
$934,000
6
bds
|
5
ba
|
4,250
sqft
|
built
1973
2472 Gates Dr SW, Rochester, MN 55902
$-2,513
Cash flow
-14.0%
Cash-on-Cash Return
2.5%
Cap rate
0.4%
Rent to Value Ratio
Active
$965,000
5
bds
|
4
ba
|
4,306
sqft
|
built
2016
959 Southwell Enclave, Byron, MN 55920
$-2,280
Cash flow
-12.3%
Cash-on-Cash Return
2.8%
Cap rate
0.5%
Rent to Value Ratio
Active
$1,575,000
5
bds
|
5
ba
|
6,348
sqft
|
built
2009
4243 Mayo Woodlands Rd SW, Rochester, MN 55902
$-6,088
Cash flow
-20.2%
Cash-on-Cash Return
1.0%
Cap rate
0.2%
Rent to Value Ratio
Active
$234,900
3
bds
|
2
ba
|
1,430
sqft
|
built
1920
306 10th Ave NE, Rochester, MN 55906
$-224
Cash flow
-5.0%
Cash-on-Cash Return
4.5%
Cap rate
0.7%
Rent to Value Ratio
Active
$453,000
4
bds
|
3
ba
|
2,964
sqft
|
built
2005
3220 Coral Pl NE, Rochester, MN 55906
$-857
Cash flow
-9.9%
Cash-on-Cash Return
3.4%
Cap rate
0.6%
Rent to Value Ratio
Active
$714,900
5
bds
|
4
ba
|
3,884
sqft
|
built
1985
1410 Woodland Dr SW, Rochester, MN 55902
$-1,038
Cash flow
-7.6%
Cash-on-Cash Return
3.9%
Cap rate
0.6%
Rent to Value Ratio
Active
$750,000
5
bds
|
3
ba
|
3,796
sqft
|
built
1973
2211 Lenwood Dr SW, Rochester, MN 55902
$-1,274
Cash flow
-8.9%
Cash-on-Cash Return
3.6%
Cap rate
0.5%
Rent to Value Ratio
Active
$599,900
4
bds
|
4
ba
|
3,280
sqft
|
built
1996
5174 61st Ave SE, Rochester, MN 55904
$-763
Cash flow
-6.6%
Cash-on-Cash Return
4.2%
Cap rate
0.6%
Rent to Value Ratio
Active
$689,900
4
bds
|
3
ba
|
2,715
sqft
|
built
2022
1383 Trophy Lake Rd SW, Pine Island, MN 55963
$-2,152
Cash flow
-16.3%
Cash-on-Cash Return
1.9%
Cap rate
0.4%
Rent to Value Ratio
Active
$149,900
2
bds
|
2
ba
|
1,240
sqft
|
built
1964
410 6th Ave SW, Rochester, MN 55902
$-675
Cash flow
-23.5%
Cash-on-Cash Return
0.3%
Cap rate
1.3%
Rent to Value Ratio
Active
$449,900
4
bds
|
3
ba
|
2,277
sqft
|
built
2022
2005 Elk Run Dr SE, Pine Island, MN 55963
$-841
Cash flow
-9.8%
Cash-on-Cash Return
3.4%
Cap rate
0.6%
Rent to Value Ratio